Open Access
Research Article
Max Screen >>
ISSN: 2455-765X
Copyright: © 2016 Bourget G. This is an open-access article distributed under the terms of the Creative Commons Attribution License, which permits unrestricted use, distribution, and reproduction in any medium, provided the original author and source are credited.
Related article at Pubmed, Google Scholar
Microarray data has a high dimensional data structure that makes statistical inference drawn from this type of data challenging. Since current statistical methods are generally for “small p and large n”, these methods can be insufficient to draw valid conclusions for microarray data. Nevertheless, some of these methods, such as ANOVA (F test), are still widely used. One of the assumptions of the classical F test is that populations (genes) are assumed to be independent. This assumption is obviously violated in microarray experiments because gene-gene interactions can naturally occur. In this paper, we use an effective “column” size idea to take correlations among genes into account to modify the classical F test. We consider various magnitudes of correlation among genes in Monte Carlo simulation studies. We compare the proposed test (F -MOD) with the classical F test and multivariate Hotelling’s T2 test through validity and power analyses. We also demonstrate the proposed test with real type 2 diabetes mellitus gene expression data, which was obtained from the Gene Expression Omnibus (GEO) database with accession number GSE25724.
Keywords: Effective sample size; High dimensional data; Hotelling’s T2 test; Microarray
Completion of the human genome sequence allows researchers to study expression of 20,000-30,000 genes in a single assay. There are three types of platforms: short oligonucleotide (25-30 base), long oligonucleotide (50-80 base), and cDNA. However, the most two common platform are based on collections of cDNA clones [1] or short (25 base) oligonucleotides synthesized in situ by photolithographic methods [2]. Although microarrays are the most extensively used technology for studying gene expression, it has a high dimensional data structure that makes statistical inference from this type of data challenging [3]. Several methods such as clustering and classification have been used to identify groups of genes that share similar functions [4,5]. However, while clustering and classification are useful techniques to search for similar genes, these techniques do not answer the question of which genes are differentially expressed under different conditions (e.g. cancer cells versus normal cells). The answer to the question requires hypothesis testing with null hypothesis of no difference in the means of gene expressions under different conditions. Various statistical tests have been proposed involving fold change, linear models, as well as Bayesian methods [6-8]; however, progress has been slow in adopting these methods in microarray analysis. Moreover, all of these methods have the common characteristic of being univariate methods.
A common characteristic of high dimensional data is that it has high dimension (p), and relatively small sample size (n). This kind of data structure is called “large p and small n”. Besides having high dimensional data, microarray data also have correlation structure [9]. Most of the current methods either ignore high dimensional data structure or fail to efficiently take correlations among genes into account. Multivariate analysis can take correlations among genes into account by analyzing genes jointly. Consequently, multivariate analysis methods have recently being used in microrray data [10,11]. However, these methods are not straightforward, and most importantly ignore the multidimensional structure of the gene expression data.
Hotelling’s T2 test is one of the multivariate analysis methods that takes correlations among genes into account to identify differentially expressed genes. It has been applied in genome association studies [12], microarray process control [13], and data control charts [14]. However, Hotelling’s T2 test does not take high dimensional data structure into account. For example, in a comparison of two groups, this test requires an explicit condition on data dimension and sample size: for fixed p, p < n1 + n2 − 1, where p is the number of genes, n1 is the sample size of the group 1, and n2 is the sample size of the group 2. Lu, et al. [15] presented a new T2 statistic for analyzing microarray data. They used first a multiple forward search algorithm to select a subset of feature vectors in a high-dimensional microarray dataset to reduce the dimension (i.e., p) to satisfy the restriction p < n1 + n2 − 1, and then they implemented the Hotelling’s T2 test.
Moreover, as an alternative test to Hotelling’s T2, Chen, et al. [16] proposed a two-sample test for the means of high-dimensional data.
In this paper, we present a different approach proposed in Lu, et al. [15]. Our approach is more general and practical than that of in [15], and moreover does not implement Hotelling’s T2 test but the simple classical F test. The proposed modified F test is denoted by F -MOD. We use an effective sample size idea to take correlation among genes into account [17-19]. The effective sample size formula was originally proposed by Clifford, et al. [20], and was improved for small sample sizes by Dutilleul, et al. (1993) [21]. Also, the same effective sample size formula was used in modified F tests to assess multiple correlation between one spatial process and several others [22], and to assess correlation between two time series [23]. We implement the same effective sample size formula described in [21] to compute effective column size not effective sample size. Henceforth, we introduce a new nomenclature term “effective column size”. To adopt the formula in [21], we consider the same structure of the design matrix (1) in the Methods section.
An another statistical technique for finding significant genes in a set of microarray experiments is Significance Analysis of Microarray (SAM) proposed by Tusher, et al. [24]. The SAM uses repeated permutations of the data to determine if the expression of any genes are significantly related to the response. It uses a set of gene-specific t tests. Since, the classical F , Hotellings T2, and F -MOD tests use global F tests and not individual t tests as in SAM, we do not consider the SAM as one of the methods to be compared in this paper. Also, the goal of SAM is to handle gene-specific fluctuations by considering a statistic based on the ratio of change in gene expression to standard deviation in the data for that gene. However, in this paper, our goal is to handle gene-gene interactions and not in gene-specific fluctuations, which are two different problems to tackle.
The remainder of the paper is organized as follows. In the Methods section, we describe Hotelling’s T2, classical F, and F -MOD tests, and in the Results section we outline Monte Carlo simulation studies, present its findings, and analyze gene expression data of type 2 diabetes mellitus. Finally, we draw conclusions in the Discussion section.
A s ingle multivariate observation is the collection of measurements on p different variables (genes) taken from the same trial (array). If n observations have been obtained, the entire data set can be represented in an n × p matrix
 (1)
(1)
The row vector  represents the jth multivariate observation. The matrix X represents p genes each having n observations. Now, consider a microarray experiment of n1 and n2 samples from populations 1 and 2, respectively. For example, population 1 can represent the disease group, while population 2 can represent the healthy group. Suppose that the expression levels of p genes are measured and matrix representations of populations 1 and 2 are defined in (1) as X and Y. The observations on p variables can be arranged as follows:
Our goal in this paper is to only make inferences about the differences of the vector mean of the populations. That is, we want to know if μ1 = μ2, or equivalently if μ1 − μ2 = 0. However, one further can investigate which means are different if the hypothesis of μ1 − μ2 = 0 is concluded. We need to make some assumptions to provide answers to these questions. The assumptions are:
1. The sample  is a random sample of n1 from a p-variate population with mean vector μ1 and covariance matrix Σ1.
2. The sample  is a random sample of n2 from a p-variate population with mean vector μ2 and covariance matrix Σ2.
3. The samples  are independent of the samples
  .
.
For large samples, these assumptions are enough to make an inference about μ1 − μ2. However, when the sample sizes n1 and n1 are small we need to have the following assumptions as well.
1. Both populations are multivariate normal, and
2. Σ1 = Σ2.
The null (H0) and alternative (Ha) hypotheses we are interested are:
H0: μ1 − μ2 = 0 versus Ha : μ1 − μ2 ≠ 0 (2)
where μ1 = (μ11, μ12, . . . , μ1p)' is the vector mean expression level of population 1, and μ2 = (μ21, μ22, . . . , μ2p)' is the vector mean expression level of population 2. The null and alternative hypotheses can also be rewritten as
H0 : (μ11 − μ21, μ12 − μ22, . . . , μ1p − μ2p)' = (0, 0, . . . , 0)'
Ha : (μ11 − μ21, μ12 − μ22, . . . , μ1p − μ2p)' ≠ (0, 0, . . . , 0)' (3)
or equivalently
H0 : μ11 = μ21, μ12 = μ22, . . . , μ1p = μ2p
Ha : at least one μ1i = μ2i, (i = 1, 2, . . . , p) (4)
Note that, we test the mean expression of p genes all together not the individual mean expressions in (2) - (4). That is, we consider a global test not an individual test.
We consider a microarray experiment composing of n1 samples from population 1 and n2 samples from population 2. Let Xij be the expression level for gene j of sample i from population 1, and Ykj be the expression level for gene j of sample k from population 2. The expression level vectors for sample i from population 1 can be expressed as Xi = (Xi1, . . . , Xip)' . The mean expression level of gene j in population 1 is defined as
 (5)
(5)
Then, the mean expression level vector for p genes for population 1 is given by
 We can similarly define these expressions for population 2. The pooled variance-covariance matrix of p genes for populations 1 and 2 can be written as
 (6)
(6)
where SX and SY are the sample variance covariance matrices of populations 1 and 2. Note that correlation among genesare taken into account through sample variance covariance matrices.
The Hotelling’s T2 test [25] is defined as
 (7)
(7)
By Central Limit Theorem,
 (8)
(8)
has classical F distribution with p degrees of freedom for the numerator and n1 + n2 − p – 1 degrees of freedom for the denominator. This test requires that the degrees of freedoms are positive, that is, it forces the condition p < n1 + n2 − 1. However, this restriction makes it almost impossible to implement Hotelling’s T2 test in microarray experiments.
The classical F test compares the means of the columns of X, and assumes that these columns are independent (univariate case). In microarray experiment, we want to compare the differences of the p means of X and Y. Since we want to compare multivariate (Hotelling’s T2) and univariate (classical F) methods, we adopt the data structure from the multivariate to univariate case by considering the observations as the differences of the data matrices X and Y. That is, we compute Xij − Yij , and apply the univariate F test on these observations. The F test is defined as
 (9)
(9)
where MST is the mean square for treatments (genes), and MSE is the mean square for errors. The Fobs in (9) follows an F distribution with p − 1 degrees of freedom for the numerator and p(n − 1) degrees of freedom for the denominator, where n1 = n2 = n.
When the assumptions are not satisfied by sample data, there are two general remedies: (1) to transform the data so that the assumptions are satisfied, or (2) to develop a modified inferential method in which the assumptions are relaxed at the estimation stage, or deviations from the assumptions are taken into account at the testing stage.
In linear models, the autocorrelation of errors has an impact on the inefficiency of slope estimators and the invalidity of significance levels. When regressors have fixed structure, the only source of autocorrelation comes from errors. However, when regressors also have random structures, their autocorrelations along with correlations of errors have an impact on estimation and testing [17-19,26,27]. Since the autocovariances of stochastic processes bias the variance of sample correlation coefficients [28], the incorporation of effective sample size into modified t-tests were proposed [20,21]. The effective sample size nˆ in [20] was defined as
 (10)
(10)
where  and
and  were the estimated covariance matrices of X and Y, respectively. Dutilleul (1993) proposed an improved effective sample size for small sample sizes [21]. However, the effective sample sizes prosed in [20] and [21] behave similarly for large sample sizes. The effective sample size in [21] was defined as
 (11)
(11)
where B = n-1(I – n-1J), J is the n × n matrix of ones, and I is the identity matrix.
In this paper, we use equation (11) defined in [21] to compute effective column size to identify differentially expressed genes in microarray data. We considered the following steps for F -MOD test in the simulation runs: first, we computed the effective column size,  , as in equation (11).
The estimated covariance matrices and were computed using the raw data of X and Y, respectively. Second, we replaced p by in the degrees of freedoms of the classical F test defined in (9). Finally, we computed the p-value of the global F test in (9) with − 1 and (n − 1) degrees of freedoms for the numerator and denominator degrees of freedoms, respectively. Note that, the sample size is n1 = n2 = n.
We generated two multivariate normal distributions: MVN(μ1, Σ1) and MVN(μ2, Σ2), each with dimension p (genes). The variance covariance matrices are defined as

where
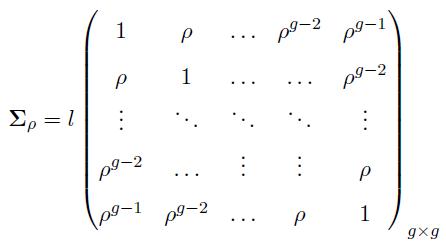 (12)
(12)
where  We can similarly define Σ(-ρ) by replacing ρ by (−ρ) in (12).
The matrices Σ(ρ) and Σ(-ρ) have dimensions g × g, and the matrices Σ1 = Σ2 have dimensions p × p. The constant term l is cancelled out in the computation of the effective column size in (11), hence, it has no effect on the effective column size. However, this term is considered to generate the data matrices X and Y with covariance matrices defined in (12).
Actually, the simulation setup has sound basis in methodologies used in analyzing real microarray data. It is common knowledge that genes are networked together in pathways. Although, it is true that weak connections between groups may exist, independence between groups is a reasonable assumption. Also, within each group, genes are either positively or negatively correlated, and due to their relative distance in the regulatory pathway, the further apart two genes, the less correlation between them. These are exactly the reasons why we considered the structures of Σ1 and Σ2 defined in (12) for microarray data.
We assumed that both populations have equal sample sizes (i.e., n1 = n2), and there are 10 matrices on the diagonals of Σ1 and Σ2. For example, if p = 100 then there are 10 matrices on the diagonal of Σ1 and Σ2 with 10 genes in each matrix (i.e., g = 10). To assess the effects of correlation among genes, we took ρ = 0, 0.1, 0.2, . . . , 0.9 as various magnitudes of correlations. We also set the variances of each gene at 0.01 (i.e., σ2 = 0.01). Even though the value of σ2 is needed to generate X and Y, it has no effect on the computation of the effective column size. Two different significance levels, α = 0.01 and 0.05, were used in validity and power analyses.
The null hypothesis in validity analysis was set to μ1 = μ2 |= (0,0,0,.....,0)'(p × p) whereas in power analysis μ1 ≠ μ2 with
μ1 = (0,0,0,.....,0)'(p × 1) and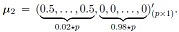
More precisely, the first 2% of the means of the genes were set to 0.5, and the rest were set to 0 in μ2. If 0.02 * p was not an integer value, then we used ceiling function in R that takes a single numeric argument a and returns a numeric value containing the smallest integers not less than the corresponding elements of a.
The simulation program was written and run in R, which is a free software environment for statistical computing and graphics. We ran 10,000 data sets to test the null hypothesis. We computed empirical significance levels (p-values) and powers of the tests to draw conclusions about the testing procedures.
Lu, et al. [15], Chen, et al. [16], and SAM [24] methods were not compared in the simulation. The SAM handles gene-specific fluctuations by considering a statistic based on the ratio of change in gene expression to standard deviation in the data for that gene. However, in this paper, our goal is to handle gene-gene interactions and not gene-specific fluctuations. Also, Lu, et al. [15] modified the degrees of freedom in Hotellings T2 test but F -MOD modified the degrees of freedom of the classical F test. Moreover, the method of Chen, et al. [16] was not compared because they proposed a two-sample test, and we used a test that modified the global F-test.
The strict definition of a testing procedure to be valid at a significance level α is that if the actual p-value, which is the probability of rejecting the null hypothesis when in fact the null hypothesis is true, is less than or equal to α. To take variability among generated data into account in simulation runs, one may consider the upper limit of the approximate 95% confidence interval for the actual p-value. Under binomial distribution model, for α and m simulation runs, the approximate 95% confidence interval is α ± 2√α(1 − α)/m. In simulation runs, we took α = 0.01 and 0.05, and m = 10, 000. The upper limits are
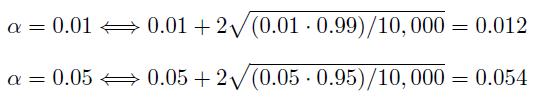
Therefore, we assessed the validity of the testing procedures based on the strict definition of the validity and the variability associated with the data generation. That is, the validity conditions are p-value ≤ 0.012 when α = 0.01, and p-value ≤ 0.054 when α = 0.05 in Table 1 and 2.
In Table 1, we investigated the validit y of the tests at α = 0.01 and 0.05 when p < n1 + n2 − 1. We need this restriction to perform the Hotelling’s T2 test, but not the other two tests. Table 1 showed that the classical F test suffered lack of validity when correlations among genes were between mild and strong. The Hotelling’s T2 test is known to be not well-defined when p is much greater than n because the variance-covariance matrices Σ1 and Σ2 become singular. As a result, Hotelling’s T2 test becomes unstable. This phenomena was ascertained in Table 1 when p > 60. Therefore, we suggest not to use Hotelling’s T2 test when p > 60. In contrast, the proposed F -MOD test always provided valid tests for any ρ, except only in two cases (p = 50 when α = 0.05 and α = 0.01), which might be solely due to variation among data.
We studied the validity of F and F -MOD tests without the restriction p < n1 + n2 − 1 in Table 2. Since F MOD performed very well up to p = 80, we ran simulations for p = 100 and 200 to better understand the performance of the test for larger number of genes. Both tests performed similarly as in Table 1. That is, F test was only valid when correlation among genes did not exist or the magnitudes of the correlations were very weak. The F -MOD test always provided valid testings, except in one case.
Table 3 provided power analysis at α = 0.01 and 0.05 when p < n1 + n2 − 1. Since F test suffered lack of validity when ρ > 0.2, we did not analyze the power values in the table; these values were provided only for completeness of the Table. Hence, the power of F test should be ignored when ρ > 0.2. While Hotelling’s T2 test provided better power when correlations among genes were not too strong, the power decreased as correlations among genes got stronger. The Hotelling’s T2 test actually became powerless as p increased. This is not an unusual observation because it is known that even when p ≤ n, the Hotelling’s T2 test perform poorly if p is nearly as large as n. The performance of the Hotelling’s T2 test under p, n → ∞ with p/n → 1 – Є was studied in [29], which they showed that the asymptotic power of the test suffered for small values of Є > 0. A number of improvements to give better power on the Hotelling’s T2 test in high-dimensional data have been proposed in [16, 29-31]. It was interesting to observe that Hotelling’s T2 test was more powerful when α = 0.05 than when α = 0.01. Its powers were more than 88.5% when α = 0.05, but not more than 35.4% when α = 0.01. In contrast, the F -MOD always provided powers at 100%.
We did not provide a table for power analysis when the restriction p < n1 + n2 − 1 was because held because it provided similar results to those in Table 3.
Table 4 shows average effective column sizes computed from (11) when 10,000 simulation runs were performed. The effective column sizes decreased as correlations among genes got stronger. As expected, when genes are independent (i.e., ρ = 0) the effective column size was the same as the original number of genes (p).
We used the gene expressions of type 2 diabetes from the data base Gene Expression Omnibus (GEO) with accession number GSE25724 [32] (data was not collected by us). The normalized gene expression data of p = 22, 283 genes was obtained from six type 2 diabetic human islets (population 1, n1 = 6) and seven non-diabetic human islet (population 2, n2 = 7). In over all design, human islets were isolated from the pancreas of organ donors by collagenase digestion followed by density gradient purification, then hand-picked and cultured two days in M199 culture medium. The platform GPL96 [HG-U133A]) by Affymetrix was used.
The programming codes to analyze gene expression data were written in R software. The dimensions of the matrices X and Y were 6 × 22, 283, and 7 × 22, 283, respectively. Since F -MOD test required the differences of the observations from two populations, six non-diabetic patients were chosen to have equal sample sizes for both populations (n1 = n2 = 6). That is, the dimension of the difference matrix was 6 × 22, 283. The data structure was high dimensional (p = 22, 283 genes, and n = 6 observations), which caused memory exhaustion in R. However, we used built-in functions such as “as.big.matrix” to do matrix operations and “bigcor” to compute correlation and covariance matrices of size 22, 283 × 22, 283. The effective column size in (11) was easily computed using the as.big.matrix function to multiply two or four matrices of sizes 22, 283 × 22, 283.
Before analyzing the data, we verified that the assumptions of the fixed one-way ANOVA were satisfied: (1) our data did not violate the assumption of normal distribution, because fixed one-way ANOVA is considered a robust test against the normality assumption. (2) the equality of variances were not violated because it is well known that when the error variances are unequal, the F test for equality of means with the fixed one-way ANOVA model is only slightly affected if all factor level sample sizes are equal or do not differ greatly. In real data, the sample size was six in each gene, hence this assumption was not violated. However, 3) the independence of the populations were violated. To show dependency, we computed the correlation matrices for both populations. The correlation matrix has entries of correlations for pairwise genes. The number of pairwise genes for 22,283 genes is  = 2.48254903 × 10⁸. We counted the pairwise correlations that are more than 0.5, 0.7, and 0.9 in absolute values. The result is shown in Table 5. We concluded that genes were correlated in both populations, and hence the classical F test was not performed. The Hotelling’s T2 was also not performed because 22, 283 ≮ 6 + 6 − 1. Therefore, we only considered F -MOD test to analyze the data.
In the simulation study, we were only interested in the hypotheses defined in (2) or (3). That is, if there was a difference in the vector means of the populations. In the data analysis we proceeded one step further to identify differentially expressed genes if the null hypothesis in (2) or (3) was rejected. The statistic in (9) was Fobs = 5.609043, and the effective column size in (11) was computed as = 9.424243. Since p-value= 4.13 × 10⁻⁵ was smaller than the significance levels α = 0.01 or α = 0.05, we rejected the null hypothesis, and concluded that 22,283 genes were differentially expressed together. We then run t tests for each genes with the adjusted degree of freedoms (n1 − 1) with and without Bonferroni corrections at α = 0.01 and α = 0.05 significance levels. Below, we only presented the number of significant genes without the Bonferroni corrections but provided the list of significant genes with the Bonferroni corrections in Tables 6-9. With or without Bonferroni corrections, we then compared these significant genes with significant genes listed at the GeneCards database. GeneCards is a searchable, integrated database of human genes that provides comprehensive, updated, and user-friendly information on all known and predicted human genes (https://www.genecards.org). The search is automatically extracted from more than 100 carefully selected web sources, and uses standard nomenclature and approved gene symbols. Moreover, it presents a rich subset of data for each gene by providing links to the original sources for further examination. Its use is free for academic non-profit institutions. We identified 1083 significant genes related to type 2 diabetes by searching the keywords “type 2 diabetes mellitus”.
There were 4215 significant genes at α = 0.01 significance level (without Bonferroni correction) in which 297 of them were matched with GeneCards database (results were not shown).
After Bonferroni correction, there were 674 significant genes at α = 0.01/22283 = 4.49 × 10⁻⁷ significance level in which 52 were matched with GeneCards database (Table 6 and 7). Without Bonferroni correction at α = 0.05 significance level, there were 7116 significant genes in which 554 of them were matched with the GeneCards (results were not shown). With Bonferroni correction at α = 0.05/22, 283 = 2.24 × 10⁻⁶, there were 901 significant genes in which 73 of them were matched with the GeneCards data (Table 8 and 9).
We used PANTHER classification system, which is a comprehensive, curated database of protein families, trees, subfamilies and functions [33,34], for the significant genes identified in Tables 6-9. The tool is available at https://pantherdb.org. The results are presented in Tables 10-12. The main goals of PANTHER are to make accurate inference of genes and protein functions over large sequence databases. PANTHER extrapolates phylogenetic trees to represent gene family evolution. It also identifies subfamilies and protein class. In Tables 10-12, we presented families/subfamilies and protein class for each gene. The significant genes were grouped in the following protein classes: peptide hormones and protein hormones (have an effect on the endocrine system of animals and humans); DNA-binding proteins (can incorporate domains as the zinc finger, the helix-turn-helix, and the leucine zipper that facilitate binding to nucleic acid); acetyltransferase or transacetylase (is a type of transferase enzyme that transfers an acetyl group); carbohydrate kinase domain also known as CARKD; chemokines (are a family of small cytokines, or signaling proteins secreted by cells); hydrolase (is an enzyme that catalyzes the hydrolysis of a chemical bond); dehydrogenase also called DHO (is an enzyme belonging to the group of oxidoreductases that oxidizes a substrate by a reduction reaction that transfers one or more hydrides (H-) to an electron acceptor); peroxidases (are a large family of enzymes); and reductase (is an enzyme that catalyzes a reduction reaction).
Microarray data has a high dimensional data structure that makes statistical inference from this type of data challenging. The most widely used statistical methods for finding differentially expressed genes from microarray data are univariate. While univariate methods do not take correlations among genes into account, gene-gene interactions shouldn’t be ignored in testing procedures. Multivariate statistical methods can overcome this deficiency of univariate methods by taking gene-gene interactions into account through variance-covariance matrices. However, these methods are sometimes not straightforward, and moreover ignore the multidimensional structure of the gene expression data.
The Hotelling’s T2 test is one of the multivariate analysis methods that takes correlations among genes into account but requires the restriction p < n1 + n2 − 1, when two populations are considered with sample sizes of n1 and n2. In microarray experiments, it is almost impossible to satisfy this condition because p is always larger than n1 and n2. That means Hotelling’s T2 suffers to handle curse of dimensionality. One solution is to apply Principal Component Analysis (PCA), or some other methods to satisfy the restriction before implementing the Hotelling’s T2 test. However, even this condition is satisfied, this test still suffers lack of powers when p, n → ∞ with p/n → 1 − Є for small values of Є > 0.
In the Real Data section, we analyzed gene expressions of type 2 diabetes [32]. There were 117,610,455 pairwise genes that had correlations in absolute value more than 0.5 in the non-diabetic group, and 107,977,419 pairwise genes that had correlations in absolute value more than0.5 in the diabetic group. We concluded that the assumptions of independence were violated in both groups, and hence the classical F test was not performed. We also did not implement Hotelling’s T2 test because the restriction 22, 283 < 6 + 6 − 1 did not hold. Since F -MOD takes correlations among genes into account, we analyzed the data only using F -MOD test with and without Bonferroni corrections. For example, we identified 901 significant genes in which 73 of them were matched with the GeneCards data at α = 0.05/22, 283 = 2.24 × 10⁻⁶.
In this paper, we consider F -MOD test that used the novel idea of effective column size concept in microarray data. The test provides valid testings and 100% powers for any ρ. More- over, the computation of F -MOD can easily be performed in R using built-in functions such as “as.big.matrix” and “bigcor” without exhausting the memory in R. To adopt the data structure from the multivariate case to the univariate case, the differences of the data matrices X and Y were considered as observations. If the null hypothesis in (2) is rejected, then we suggest testing to identify differentially expressed genes
H0 : μ1i = μ2i versus Ha : μ1i ≠ μ2i (i = 1, 2, . . . , p)
using the classical t-test with (n1 − 1) degree of freedoms with Bonferroni correction. Here, μ1i is the mean expression of gene i from population 1, and μ2i is the mean expression of gene i from population 2.
We suggest for researchers to consider the F -MOD test with a multiple test adjustment correction, such as Boferroni correction, instead of the classical F test if the assumption of independence is in question. Hotelling’s T2 is the second competitive test to F -MOD. However, the restriction p < n1 + n2 − 1 does not hold in microarray data, and renders this test inapplicable. We believe that the use of effective column size in microarray experiment will be a novel approach that will help practitioners to choose an easy, effective, and powerful testing procedure instead of a complicated or a procedure with restrictions, such as Hotelling’s T2 test.
In future work, it is interesting to investigate the performance of a test that modifies Hotelling’s T2 test by taking into account the effective column size concept in the degrees of freedoms.
We would like to thank the referees for their valuable comments that helped improve the quality of the article.

![]()
p = 50, n1 = n2 = 26
ρ
|
|||||||||||
|---|---|---|---|---|---|---|---|---|---|---|---|
α |
Test |
0 |
0.1 |
0.2 |
0.3 |
0.4 |
0.5 |
0.6 |
0.7 |
0.8 |
0.9 |
0.05 |
F |
0.049 |
0.056 |
0.054 |
0.060 |
0.076 |
0.084 |
0.094 |
0.108 |
0.130 |
0.144 |
F-MOD |
0.049 |
0.055 |
0.049 |
0.049 |
0.054 |
0.052 |
0.048 |
0.048 |
0.052 |
0.044 |
|
Hotelling’s |
0.049 |
0.051 |
0.051 |
0.048 |
0.054 |
0.049 |
0.049 |
0.048 |
0.048 |
0.052 |
|
0.01 |
F |
0.011 |
0.011 |
0.012 |
0.013 |
0.019 |
0.029 |
0.038 |
0.048 |
0.063 |
0.087 |
F-MOD |
0.012 |
0.011 |
0.011 |
0.009 |
0.011 |
0.011 |
0.013 |
0.011 |
0.011 |
0.009 |
|
Hotelling’s |
0.011 |
0.011 |
0.011 |
0.012 |
0.009 |
0.012 |
0.011 |
0.009 |
0.009 |
0.009 |
|
p = 60, n1 = n2 = 31 |
|||||||||||
0.05 |
F |
0.046 |
0.049 |
0.053 |
0.061 |
0.068 |
0.081 |
0.095 |
0.123 |
0.136 |
0.167 |
F-MOD |
0.046 |
0.049 |
0.048 |
0.049 |
0.049 |
0.046 |
0.047 |
0.052 |
0.046 |
0.045 |
|
Hotelling’s |
0.050 |
0.052 |
0.049 |
0.046 |
0.051 |
0.052 |
0.048 |
0.048 |
0.050 |
0.051 |
|
0.01 |
F |
0.009 |
0.013 |
0.013 |
0.016 |
0.019 |
0.032 |
0.034 |
0.051 |
0.069 |
0.092 |
F-MOD |
0.009 |
0.013 |
0.010 |
0.011 |
0.009 |
0.012 |
0.010 |
0.009 |
0.011 |
0.010 |
|
Hotelling’s |
0.009 |
0.009 |
0.009 |
0.009 |
0.009 |
0.009 |
0.010 |
0.011 |
0.010 |
0.011 |
|
p = 80, n1 = n2 = 41 |
|||||||||||
0.05 |
F |
0.051 |
0.052 |
0.053 |
0.058 |
0.072 |
0.086 |
0.101 |
0.12 |
0.146 |
0.176 |
F-MOD |
0.051 |
0.050 |
0.047 |
0.046 |
0.049 |
0.049 |
0.049 |
0.048 |
0.047 |
0.045 |
|
Hotelling’s |
0.000 |
0.000 |
0.000 |
0.000 |
0.000 |
0.000 |
0.000 |
0.000 |
0.000 |
0.000 |
|
0.01 |
F |
0.011 |
0.009 |
0.011 |
0.015 |
0.019 |
0.028 |
0.039 |
0.058 |
0.078 |
0.113 |
F-MOD |
0.011 |
0.008 |
0.009 |
0.009 |
0.011 |
0.011 |
0.011 |
0.011 |
0.011 |
0.008 |
|
Hotelling’s |
0.000 |
0.000 |
0.000 |
0.000 |
0.000 |
0.000 |
0.000 |
0.000 |
0.000 |
0.000 |
|
| Table 1: Validity analysis with restriction p < n1 + n2 − 1, where p is the number of columns (e.g., the number of genes) and n is the number of sample size (e.g., the number of individuals.) | |||||||||||
p = 100, n1 = n2 = 20
ρ
|
|||||||||||
|---|---|---|---|---|---|---|---|---|---|---|---|
α |
Test |
0 |
0.1 |
0.2 |
0.3 |
0.4 |
0.5 |
0.6 |
0.7 |
0.8 |
0.9 |
0.05 |
F |
0.051 |
0.056 |
0.055 |
0.066 |
0.075 |
0.088 |
0.104 |
0.127 |
0.152 |
0.188 |
F-Mod |
0.052 |
0.055 |
0.049 |
0.052 |
0.053 |
0.049 |
0.048 |
0.048 |
0.047 |
0.047 |
|
0.01 |
F |
0.011 |
0.011 |
0.013 |
0.013 |
0.020 |
0.029 |
0.044 |
0.063 |
0.088 |
0.121 |
F-Mod |
0.011 |
0.010 |
0.010 |
0.010 |
0.012 |
0.011 |
0.012 |
0.012 |
0.009 |
0.011 |
|
p = 200, n1 = n2 = 20 |
|||||||||||
0.05 |
F |
0.047 |
0.053 |
0.055 |
0.064 |
0.072 |
0.099 |
0.114 |
0.135 |
0.175 |
0.213 |
F-Mod |
0.048 |
0.052 |
0.049 |
0.050 |
0.048 |
0.050 |
0.048 |
0.049 |
0.048 |
0.045 |
|
0.01 |
F |
0.010 |
0.010 |
0.013 |
0.015 |
0.022 |
0.033 |
0.050 |
0.067 |
0.098 |
0.147 |
F-Mod |
0.010 |
0.009 |
0.010 |
0.010 |
0.010 |
0.012 |
0.011 |
0.011 |
0.010 |
0.010 |
|
| Table 2: Validity analysis without restriction p < n1 + n2 − 1, where p is the number of columns (e.g., the number of genes) and n is the number of sample size (e.g., the number of individuals.) | |||||||||||
p = 50, n1 = n2 = 26
ρ
|
|||||||||||
|---|---|---|---|---|---|---|---|---|---|---|---|
α |
Test |
0 |
0.1 |
0.2 |
0.3 |
0.4 |
0.5 |
0.6 |
0.7 |
0.8 |
0.9 |
0.05 |
F |
1.000 |
1.000 |
1.000 |
1.000 |
1.000 |
1.000 |
1.000 |
1.000 |
1.000 |
1.000 |
F-MOD |
1.000 |
1.000 |
1.000 |
1.000 |
1.000 |
1.000 |
1.000 |
1.000 |
1.000 |
1.000 |
|
Hotelling's |
0.893 |
0.894 |
0.891 |
0.893 |
0.894 |
0.895 |
0.888 |
0.885 |
0.890 |
0.888 |
|
0.01 |
F |
1.000 |
1.000 |
1.000 |
1.000 |
1.000 |
1.000 |
1.000 |
1.000 |
1.000 |
1.000 |
F-MOD |
1.000 |
1.000 |
1.000 |
1.000 |
1.000 |
1.000 |
1.000 |
1.000 |
1.000 |
1.000 |
|
Hotelling's |
0.257 |
0.252 |
0.249 |
0.255 |
0.256 |
0.259 |
0.256 |
0.249 |
0.252 |
0.252 |
|
p = 60, n1 = n2 = 31 |
|||||||||||
0.05 |
F |
1.000 |
1.000 |
1.000 |
1.000 |
1.000 |
1.000 |
1.000 |
1.000 |
1.000 |
1.000 |
F-MOD |
1.000 |
1.000 |
1.000 |
1.000 |
1.000 |
1.000 |
1.000 |
1.000 |
1.000 |
1.000 |
|
Hotelling's |
0.976 |
0.967 |
0.961 |
0.949 |
0.938 |
0.928 |
0.915 |
0.906 |
0.899 |
0.887 |
|
0.01 |
F |
1.000 |
1.000 |
1.000 |
1.000 |
1.000 |
1.000 |
1.000 |
1.000 |
1.000 |
1.000 |
F-MOD |
1.000 |
1.000 |
1.000 |
1.000 |
1.000 |
1.000 |
1.000 |
1.000 |
1.000 |
1.000 |
|
Hotelling's |
0.354 |
0.330 |
0.317 |
0.305 |
0.294 |
0.281 |
0.267 |
0.258 |
0.010 |
0.248 |
|
p = 80, n1 = n2 = 41 |
|||||||||||
0.05 |
F |
1.000 |
1.000 |
1.000 |
1.000 |
1.000 |
1.000 |
1.000 |
1.000 |
1.000 |
1.000 |
F-MOD |
1.000 |
1.000 |
1.000 |
1.000 |
1.000 |
1.000 |
1.000 |
1.000 |
1.000 |
1.000 |
|
Hotelling's |
0.000 |
0.000 |
0.000 |
0.000 |
0.000 |
0.000 |
0.000 |
0.000 |
0.000 |
0.000 |
|
0.01 |
F |
1.000 |
1.000 |
1.000 |
1.000 |
1.000 |
1.000 |
1.000 |
1.000 |
1.000 |
1.000 |
F-MOD |
1.000 |
1.000 |
1.000 |
1.000 |
1.000 |
1.000 |
1.000 |
1.000 |
1.000 |
1.000 |
|
Hotelling's |
0.000 |
0.000 |
0.000 |
0.000 |
0.000 |
0.000 |
0.000 |
0.000 |
0.000 |
0.000 |
|
| Table 3: Power analysis with restriction p < n1 + n2 − 1, where p is the number of columns (e.g., the number of genes) and n is the number of sample size (e.g., the number of individuals.) | |||||||||||
|
ρ
|
|||||||||||
|---|---|---|---|---|---|---|---|---|---|---|---|
p |
n |
0 |
0.1 |
0.2 |
0.3 |
0.4 |
0.5 |
0.6 |
0.7 |
0.8 |
0.9 |
50 |
26 |
17.4 |
17.3 |
17 |
16.6 |
15.9 |
15.1 |
14.1 |
12.8 |
11.3 |
9.6 |
60 |
31 |
60.1 |
59.2 |
56.5 |
52.3 |
46.8 |
40.6 |
33.9 |
27.2 |
20.9 |
15.4 |
80 |
41 |
80.1 |
78.8 |
74.9 |
68.9 |
61.3 |
52.5 |
43.2 |
33.9 |
25.0 |
17.1 |
100 |
20 |
100.6 |
98.9 |
93.9 |
86.1 |
76.2 |
64.9 |
52.9 |
41.0 |
29.4 |
19.1 |
200 |
20 |
200.8 |
197.6 |
186.7 |
169.9 |
149.1 |
125.4 |
100.3 |
75.4 |
51.3 |
28.9 |
| Table 4: Effective column size pˆ for p when n1 = n2 = n | |||||||||||
Correlations greater than in absolute value |
Non-diabetic |
Diabetic |
0.5 |
117,610,455 |
107,977,419 |
0.7 |
62,064,682 |
52,999,817 |
0.9 |
11,663,163 |
8,784,875 |
| Table 5: The number of pairwise correlations from the correlation matrices for non-diabetic and diabetic groups | ||
No. |
Gene Symbol |
ID |
PVAL |
Gene Title |
1 |
ACP1 |
201630 _s_at |
4.06e-12 |
acid phosphatase 1, soluble |
2 |
ALDOB |
217238_s_at |
3.5e-07 |
aldolase B, fructose-bisphosphate |
3 |
ARG2 |
203946_s_at |
1.34e-11 |
arginase, type II |
4 |
CAT |
201432_at |
1.07e-08 |
catalase |
5 |
CPE |
201117_s_at |
3.35e-08 |
carboxypeptidase E |
6 |
CPE |
201116_s_at |
8.65e-14 |
carboxypeptidase E |
7 |
CXCL10 |
204533_at |
1.17e-11 |
chemokine (C-X-C motif) ligand 10 |
8 |
CYB5R4 |
219079_at |
2.3e-07 |
cytochrome b5 reductase 4 |
9 |
FTL |
213187_x_at |
3.83e-07 |
ferritin, light polypeptide |
10 |
FUCA1 |
202838_at |
4.38e-07 |
fucosidase, alpha-L- 1, tissue |
11 |
GAD2 |
206780_at |
2.96e-07 |
glutamate decarboxylase 2 (pancreatic islets and brain, 65kDa) |
12 |
GAPDH |
* |
1.92e-07 |
glyceraldehyde-3-phosphate dehydrogenase |
13 |
GAPDH |
** |
3.45e-11 |
glyceraldehyde-3-phosphate dehydrogenase |
14 |
GC |
204965_at |
7.04e-09 |
group-specific component (vitamin D binding protein) |
15 |
GCG |
206422_at |
5.33e-10 |
glucagon |
16 |
GNAI1 |
209576_at |
9.24e-09 |
guanine nucleotide binding protein (G protein), alpha inhibiting activity polypeptide 1 |
17 |
GNAS |
200981_x_at |
1.79e-08 |
GNAS complex locus |
18 |
GNAS |
214548_x_at |
6.95e-08 |
GNAS complex locus |
19 |
GNAS |
200780_x_at |
1.17e-07 |
GNAS complex locus |
20 |
GNAS |
212273_x_at |
1.21e-08 |
GNAS complex locus |
21 |
GNAS |
214157_at |
7.59e-13 |
GNAS complex locus |
22 |
GPX3 |
214091_s_at |
2.08e-08 |
glutathione peroxidase 3 (plasma) |
23 |
GREM1 |
218468_s_at |
7.55e-13 |
gremlin 1 |
24 |
GREM1 |
218469_at |
7.54e-11 |
gremlin 1 |
25 |
GYG1 |
201554_x_at |
1.72e-08 |
glycogenin 1 |
26 |
HMGCR |
202539_s_at |
6.44e-12 |
3-hydroxy-3-methylglutaryl-CoA reductase |
27 |
HPRT1 |
202854_at |
1.95e-08 |
hypoxanthine phosphoribosyltransferase 1 |
28 |
HSPA8 |
210338_s_at |
1.08e-12 |
heat shock 70kDa protein 8 |
29 |
IAPP |
207062_at |
1.95e-18 |
islet amyloid polypeptide |
30 |
IARS2 |
217900_at |
2.22e-08 |
isoleucyl-tRNA synthetase 2, mitochondrial |
31 |
LEPROT |
202377_at |
1.57e-07 |
leptin receptor overlapping transcript |
32 |
LIPA |
201847_at |
1.28e-08 |
lipase A, lysosomal acid, cholesterol esterase |
33 |
NAMPT |
217738_at |
1.13e-09 |
nicotinamide phosphoribosyltransferase |
34 |
NEUROD1 |
206282_at |
2.51e-07 |
neurogenic differentiation 1 |
35 |
PCSK1 |
205825_at |
8.42e-18 |
proprotein convertase subtilisin/kexin type 1 |
| Table 6: The significant genes of Type 2 Diabetes Mellitus at α = 0.01/22283 = 4.49 × 10⁻⁷ when genes are matched with GeneCards data base The second column shows the name of the genes from UniGene bank. The third column shows the Entrez Gene Database UID number. The fourth column shows the p-values adjusted by Bonferroni correction. The last column shows the title of the gene represented by the probe set. In column three, * and ** symbols are replaced for AFFX-HUMGAPDH/M33197_M_at and AFFX-HUMGAPDH/M33197_5_at, respectively.ene represented by the probe set. In column three, ? symbol is replaced for AFFX-HUMGAPDH/M33197_5_at respectively |
||||
No. |
Gene Symbol |
ID |
PVAL |
Gene Title |
36 |
PEX2 |
210296_s_at |
3.26e-12 |
peroxisomal biogenesis factor 2 |
37 |
PFKM |
210976_s_at |
8.3e-08 |
phosphofructokinase, muscle |
38 |
PLAGL1 |
209318_x_at |
3.36e-09 |
pleiomorphic adenoma gene-like 1 |
39 |
PSMC6 |
201699_at |
3.54e-08 |
proteasome (prosome, macropain) 26S subunit, AT-Pase, 6 |
40 |
PTGS2 |
204748_at |
4.32e-07 |
prostaglandin-endoperoxide synthase 2 (prostaglandin G/H synthase and cyclooxygenase) |
41 |
PTPRN2 |
203029_s_at |
1.82e-07 |
protein tyrosine phosphatase, receptor type, N polypeptide 2 |
42 |
PTS |
209694_at |
3.06e-07 |
6-pyruvoyltetrahydropterin synthase |
43 |
RBP4 |
219140_s_at |
5.06e-14 |
retinol binding protein 4, plasma |
44 |
SCD |
200832_s_at |
4.2e-08 |
stearoyl-CoA desaturase (delta-9-desaturase) |
45 |
SDHB |
202675_at |
2.37e-09 |
succinate dehydrogenase complex, subunit B, iron sul-fur (Ip) |
46 |
SEL1L |
202061_s_at |
8.62e-10 |
sel-1 suppressor of lin-12-like (C. elegans) |
47 |
SSBP1 |
202591_s_at |
1.64e-10 |
single-stranded DNA binding protein 1 |
48 |
TFPI |
210665_at |
1.64e-09 |
tissue factor pathway inhibitor (lipoprotein-associated coagulation inhibitor) |
49 |
TFRC |
207332_s_at |
1.28e-10 |
transferrin receptor (p90, CD71) |
50 |
TTR |
209660_at |
5.23e-08 |
transthyretin |
51 |
USO1 |
201832_s_at |
2.12e-08 |
USO1 vesicle docking protein homolog (yeast) |
52 |
VDAC1 |
212038_s_at |
3.59e-09 |
voltage-dependent anion channel 1 |
| Table 7: Table 6 continues | ||||
No. |
Gene Symbol |
ID |
PVAL |
Gene Title |
1 |
ACP1 |
201630_s_at |
4.06e-12 |
acid phosphatase 1, soluble |
2 |
ALDOB |
217238_s_at |
3.5e-07 |
aldolase B, fructose-bisphosphate |
3 |
APC |
203525_s_at |
4.7e-07 |
adenomatous polyposis coli |
4 |
ARG2 |
203946_s_at |
1.34e-11 |
arginase, type II |
5 |
ATP5B |
201322_at |
1.28e-06 |
ATP synthase, H+ transporting, mitochondrial F1 complex, beta polypeptide |
6 |
CAT |
201432_at |
1.07e-08 |
catalase |
7 |
CFTR |
215702_s_at |
1.06e-06 |
cystic fibrosis transmembrane conductance regulator (ATP-binding cassette sub-family C, member 7) |
8 |
CPE |
201116_s_at |
8.65e-14 |
carboxypeptidase E |
9 |
CPE |
201117_s_at |
3.35e-08 |
carboxypeptidase E |
10 |
CTGF |
209101_at |
8.4e-07 |
connective tissue growth factor |
11 |
CX3CL1 |
823_at |
9.49e-07 |
chemokine (C-X3-C motif) ligand 1 |
12 |
CXCL10 |
204533_at |
1.17e-11 |
chemokine (C-X-C motif) ligand 10 |
13 |
CYB5R4 |
219079_at |
2.3e-07 |
cytochrome b5 reductase 4 |
14 |
CYCS |
208905_at |
1.85e-06 |
cytochrome c, somatic |
15 |
FABP5 |
202345_s_at |
2.08e-06 |
fatty acid binding protein 5 (psoriasis-associated) |
16 |
FTL |
213187_x_at |
3.83e-07 |
ferritin, light polypeptide |
17 |
FUCA1 |
202838_at |
4.38e-07 |
fucosidase, alpha-L- 1, tissue |
18 |
GAD2 |
206780_at |
2.96e-07 |
glutamate decarboxylase 2 (pancreatic islets and brain, 65kDa) |
19 |
GAPDH |
* |
1.92e-07 |
glyceraldehyde-3-phosphate dehydrogenase |
20 |
GAPDH |
** |
3.45e-11 |
glyceraldehyde-3-phosphate dehydrogenase |
21 |
GC |
204965_at |
7.04e-09 |
group-specific component (vitamin D binding protein) |
22 |
GCG |
206422_at |
5.33e-10 |
glucagon |
23 |
GFPT1 |
202722_s_at |
5.72e-07 |
glutamine–fructose-6-phosphate transaminase 1 |
24 |
GLO1 |
200681_at |
7.17e-07 |
glyoxalase I |
25 |
GNAI1 |
209576_at |
9.24e-09 |
guanine nucleotide binding protein (G protein), alpha inhibiting activity polypeptide 1 |
26 |
GNAS |
200981_x_at |
1.79e-08 |
GNAS complex locus |
27 |
GNAS |
212273_x_at |
1.21e-08 |
hypoxanthine phosphoribosyltransferase 1 |
28 |
GNAS |
200780_x_at |
1.17e-07 |
GNAS complex locus |
29 |
GNAS |
214157_at |
7.59e-13 |
GNAS complex locus |
30 |
GNAS |
214548_x_at |
6.95e-08 |
GNAS complex locus |
31 |
GPX3 |
214091_s_at |
2.08e-08 |
glutathione peroxidase 3 (plasma) |
32 |
GREM1 |
218469_at |
7.54e-11 |
gremlin 1 |
33 |
GREM1 |
218468_s_at |
7.55e-13 |
gremlin 1 |
34 |
GYG1 |
201554_x_at |
1.72e-08 |
glycogenin 1 |
35 |
HMGCR |
202539_s_at |
6.44e-12 |
3-hydroxy-3-methylglutaryl-CoA reductase |
| Table 8: The significant genes of Type 2 Diabetes Mellitus at α = 0.05/22283 = 2.24 × 10⁻⁶ when genes are matched with GeneCards data base In column three, *and **symbols are replaced for AFFX-HUMGAPDH/M33197_M_at and AFFX-HUMGAPDH/M33197_5_at, respectively. |
||||
No. |
Gene Symbol |
ID |
PVAL |
Gene Title |
36 |
HPRT1 |
202854_at |
1.95e-08 |
hypoxanthine phosphoribosyltransferase 1 |
37 |
HSPA8 |
210338_s_at |
1.08e-12 |
heat shock 70kDa protein 8 |
38 |
HSPA8 |
208687_x_at |
1.58e-06 |
heat shock 70kDa protein 8 |
39 |
HSPD1 |
200806_s_at |
1.24e-06 |
heat shock 60kDa protein 1 (chaperonin) |
40 |
IAPP |
207062_at |
1.95e-18 |
islet amyloid polypeptide |
41 |
IARS2 |
217900_at |
2.22e-08 |
isoleucyl-tRNA synthetase 2, mitochondrial |
42 |
INS |
206598_at |
5.49e-07 |
insulin |
43 |
ISL1 |
206104_at |
1.75e-06 |
ISL LIM homeobox 1 |
44 |
LEPROT |
202377_at |
1.57e-07 |
leptin receptor overlapping transcript |
45 |
LIPA |
201847_at |
1.28e-08 |
lipase A, lysosomal acid, cholesterol esterase |
46 |
NAMPT |
217738_at |
1.13e-09 |
nicotinamide phosphoribosyltransferase |
47 |
NEUROD1 |
206282_at |
2.51e-07 |
neurogenic differentiation 1 |
48 |
NUCB2 |
203675_at |
1.8e-06 |
nucleobindin 2 |
49 |
OGT |
209240_at |
1.32e-06 |
O-linked N-acetylglucosamine (GlcNAc) transferase (UDP-N-acetylglucosamine:polypeptide-N-acetylglucosaminyl transferase) |
50 |
PCSK1 |
205825_at |
8.42e-18 |
proprotein convertase subtilisin/kexin type 1 |
51 |
PDHX |
203067_at |
1.11e-06 |
pyruvate dehydrogenase complex, component X |
52 |
PEX2 |
210296_s_at |
3.26e-12 |
peroxisomal biogenesis factor 2 |
53 |
PFKM |
210976_s_at |
8.3e-08 |
phosphofructokinase, muscle |
54 |
PLAGL1 |
209318_x_at |
3.36e-09 |
pleiomorphic adenoma gene-like 1 |
55 |
PON2 |
210830_s_at |
6.93e-07 |
paraoxonase 2 |
56 |
PROS1 |
207808_s_at |
1.88e-06 |
protein S (alpha) |
57 |
PSMC6 |
201699_at |
3.54e-08 |
proteasome (prosome, macropain) 26S subunit, AT-Pase, 6 |
58 |
PTGS2 |
204748_at |
4.32e-07 |
prostaglandin-endoperoxide synthase 2 (prostaglandin G/H synthase and cyclooxygenase) |
59 |
PTPN12 |
202006_at |
5.75e-07 |
protein tyrosine phosphatase, non-receptor type 12 |
60 |
PTPRN2 |
203029_s_at |
1.82e-07 |
protein tyrosine phosphatase, receptor type, N polypeptide 2 |
61 |
PTS |
209694_at |
3.06e-07 |
6-pyruvoyltetrahydropterin synthase |
62 |
RBP4 |
219140_s_at |
5.06e-14 |
retinol binding protein 4, plasma |
63 |
SCD |
200832_s_at |
4.2e-08 |
stearoyl-CoA desaturase (delta-9-desaturase) |
64 |
SDHB |
202675_at |
2.37e-09 |
succinate dehydrogenase complex, subunit B, iron sulfur (Ip) |
65 |
SEL1L |
202061_s_at |
8.62e-10 |
sel-1 suppressor of lin-12-like (C. elegans) |
66 |
SSBP1 |
202591_s_at |
1.64e-10 |
single-stranded DNA binding protein 1 |
67 |
SST |
213921_at |
8.11e-07 |
somatostatin |
68 |
TFPI |
210665_at |
1.64e-09 |
tissue factor pathway inhibitor (lipoprotein-associated coagulation inhibitor) |
69 |
TFPI |
210664_s_at |
6.24e-07 |
tissue factor pathway inhibitor (lipoprotein-associated coagulation inhibitor) |
70 |
TFRC |
207332_s_at |
1.28e-10 |
transferrin receptor (p90, CD71) |
71 |
TTR |
209660_at |
5.23e-08 |
transthyretin |
72 |
USO1 |
201832_s_at |
2.12e-08 |
USO1 vesicle docking protein homolog (yeast) |
73 |
VDAC1 |
212038_s_at |
3.59e-09 |
voltage-dependent anion channel 1 |
| Table 9: Table 8 continues | ||||
No. |
Gene Symbol |
Panther family/subfamily |
PANTHER Protein Class |
1 |
APC |
Adenomatous polyposis coli protein (pthr12607:sf11) |
|
2 |
FTL |
Ferritin light chain (pthr11431:sf47) |
storage protein |
3 |
HMGCR |
3-hydroxy-3-methylglutaryl-Coenzyme a reductase (pthr10572:sf2) |
|
4 |
PEX2 |
Peroxisome biogenesis factor2 PEX2 ortholog |
|
5 |
PLAGL1 |
Zinc finger protein plagl1 (pthr10032:sf227) |
KRAB box transcription factor |
6 |
PTGS2 |
Prostaglandin g/h synthase 2 (pthr11903:sf8) |
oxygenase |
7 |
ATP5B |
Atp synthase subunit beta, mito-channel;
Chondrial (pthr15184:sf44) |
ATP ligand-gated ion channel; DNA binding protein; hydrolase |
8 |
GC |
Vitamin d-binding protein (pthr11385:sf11) |
|
9 |
GNAI1 |
Guanine nucleotide-binding Protein g(i) subunit alpha-1 (pthr10218:sf227) |
heterotrimeric G-protein |
10 |
GYG1 |
Glycogenin-1 (pthr11183:sf18) |
glycosyltransferase |
11 |
INS |
Insulin-related (pthr11454:sf9) |
growth factor; peptide hormone |
12 |
PON2 |
Serum paraoxonase/arylesterase 2
(pthr11799:sf17) |
|
13 |
FABP5 |
Fatty acid-binding protein, Epidermal-related (pthr11955:sf58) |
|
14 |
GREM1 |
Gremlin-1 (pthr15283:sf3) |
|
15 |
HPRT1 |
Hypoxanthine-guanine phosphoribo-syltransferase (pthr22573:sf38) |
glycosyltransferase; mutase |
16 |
IAPP |
Islet amyloid polypeptide (pthr10505:sf4) |
peptide hormone |
17 |
IARS2 |
Isoleucine–trna ligase, mitochon-Drial (pthr11946:sf82) |
aminoacyl-tRNA synthetase |
18 |
PCSK1 |
Prosaas (pthr15531:sf0) |
|
19 |
PTS |
6-pyruvoyl tetrahydrobiopterin syn- Thase (pthr12589:sf1) |
|
20 |
ARG2 |
Arginase-2, mitochondrial (pthr11358:sf18) |
hydrolase |
21 |
CTGF |
Connective tissue growth factor (pthr11348:sf7) |
growth factor |
22 |
FUCA1 |
Tissue alpha-l-fucosidase (pthr10030:sf2) |
|
| Table 10: Functional classification of the genes in Tables 6-9 by PANTHER | |||
No. |
Gene Symbol |
Panther family/subfamily |
PANTHER Protein Class |
23 |
GAPDH |
Glyceraldehyde-3-phosphate dehy- Drogenase (pthr10836:sf51)
|
Dehydrogenase |
24 |
GLO1 |
Lactoylglutathione lyase (pthr10374:sf8) |
|
25 |
ISL1 |
Insulin gene enhancer protein isl-1 (pthr24204:sf3) |
Homeobox transcription factor; zinc finger transcription factor; nucleic acid binding |
26 |
OGT |
Udp-n-acetylglucosamine–peptide N-acetylglucosaminyltransferase 110 Kda subunit (pthr23083:sf364) |
Glycosyltransferase |
27 |
PCSK1 |
Neuroendocrine convertas 1 (pthr10795:sf407) |
Serine protease |
28 |
PSMC6 |
26s protease regulatory subunit 10b (pthr23073:sf31) |
Hydrolase |
29 |
PTPN12 |
Tyrosine-protein phosphatase non-receptor type 12 (pthr19134:sf283) |
Protein phosphatase |
30 |
SSBP1 |
Single-stranded dna-binding pro- Tein, mitochondrial (pthr10302:sf0) |
DNA binding protein |
31 |
TFRC |
Transferrin receptor protein 1 (pthr10404:sf26) |
Receptor |
32 |
CFTR |
Cystic fibrosis transmembrane conductance regulator (pthr24223:sf19) |
Anion channel |
33 |
CXCL10 |
C-x-c motif chemokine 10 (pthr10179:sf47) |
Chemokine |
34 |
NEUROD1 |
Neurogenic differentiation factor 1 (pthr19290:sf88) |
Basic helix-loop-helix transcription factor; nuclease |
35 |
NUCB2 |
Nucleobindin-2 (pthr19237:sf22) |
Nucleic acid binding; annexin; calmodulin |
36 |
PDHX |
Pyruvate dehydrogenase pro-Tein x component, mitochondrial (pthr23151:sf57) |
Acetyltransferase |
37 |
PFKM |
6-phosphofructokinase, muscle type (pthr13697:sf13) |
Carbohydrate kinase |
38 |
RBP4 |
Retinol-binding protein 4 (pthr11873:sf2) |
transfer/carrie protein |
39 |
SCD |
Acyl-coa desaturase (pthr11351:sf31) |
|
40 |
SEL1L |
Protein sel-1 homolog 1 (pthr11102:sf70) |
Enzyme modulator |
41 |
SST |
Somatostatin (pthr10558:sf2) |
Peptid hormone |
42 |
USO1 |
General vesicular transport factor P115 (pthr10013:sf0) |
Membrane traffic protein |
43 |
CYCS |
Cytochrome c pthr11961:sf15) |
|
| Table 11: Table 10 continues | |||
No. |
Gene Symbol |
Panther family/subfamily |
PANTHER Protein Class |
44 |
GNAS |
Guanine nucleotide-binding protein G(s) subunit alpha isoforms xlas (pthr10218:sf36)
|
|
45 |
LEPROT |
Leptin receptor gene-related protein (pthr12050:sf3) |
Cytokine receptor |
46 |
TTR |
Transthyretin (pthr10395:sf12) |
Transporter; transfer/carrier protein |
47 |
ALDOB |
Fructose-bisphosphate aldolaseb (pthr11627:sf2) |
|
48 |
CAT |
Catalase (pthr11465:sf9) |
Peroxidase |
49 |
CPE |
Carboxypeptidase e (pthr11532:sf59) |
Metalloprotease |
50 |
CYB5R4 |
Cytochrome b5 reductase 4 (pthr19370:sf122) |
Reductase |
51 |
GCG |
Glucagon (pthr11418:sf0) |
Peptide hormone |
52 |
GFPT1 |
Glutamine–fructose-6-phosphate Aminotransferase [isomerizing] 1 (pthr10937:sf2) |
Transaminase |
53 |
LIPA |
Lysosomal acid lipase/cholesteryl es- Ter hydrolase (pthr11005:sf26) |
Lipase |
54 |
NAMPT |
Nicotinamide phosphoribosyltrans-Ferase (pthr11098:sf15) |
Cytokine |
55 |
PROS1 |
Vitamin k-dependent proteins (pthr24040:sf0) |
|
56 |
VDAC1 |
Voltage-dependent anion-selective channel protein 1 (pthr11743:sf13) |
Anion channel; voltage-gated ion channel |
57 |
ACP1 |
Low molecular weight phosphortyrosine protein phosphatase (pthr11717:sf7) |
Protein phosphatase; reductase |
58 |
CX3CL1 |
Fractalkine (pthr12015:sf92) |
Chemokine |
59 |
GAD2 |
Glutamate decarboxylase 2 (pthr11999:sf77) |
Decarboxylase |
60 |
GPX3 |
Glutathione peroxidase 3 (pthr11592:sf32) |
Peroxidase |
61 |
HSPA8 |
Heat shock cognate 71 kda protein (pthr19375:sf239) |
Hsp70 family chaperone |
62 |
PTPRN2 |
Receptor-type tyrosine-protein phos-
Phatase n2 (pthr19134:sf266) |
Receptor; protein phosphatase |
63 |
SDHB |
Succinate dehydrogenase [ubiquinone] iron-sulfur subunit, Mitochondrial (pthr11921:sf29) |
Dehydrogenase |
64 |
TFPI |
Tissue factor pathway inhibitor
(pthr10083:sf238) |
Serine protease inhibitor |
| Table 12: Table 10 continues | |||
No. |
Gene Symbol |
ID |
PVAL |
Gene Title |
1 |
ACP1 |
201630 _s_at |
4.06e-12 |
acid phosphatase 1, soluble |
2 |
ALDOB |
217238_s_at |
3.5e-07 |
aldolase B, fructose-bisphosphate |
3 |
ARG2 |
203946_s_at |
1.34e-11 |
arginase, type II |
4 |
CAT |
201432_at |
1.07e-08 |
catalase |
5 |
CPE |
201117_s_at |
3.35e-08 |
carboxypeptidase E |
6 |
CPE |
201116_s_at |
8.65e-14 |
carboxypeptidase E |
7 |
CXCL10 |
204533_at |
1.17e-11 |
chemokine (C-X-C motif) ligand 10 |
8 |
CYB5R4 |
219079_at |
2.3e-07 |
cytochrome b5 reductase 4 |
9 |
FTL |
213187_x_at |
3.83e-07 |
ferritin, light polypeptide |
10 |
FUCA1 |
202838_at |
4.38e-07 |
fucosidase, alpha-L- 1, tissue |
11 |
GAD2 |
206780_at |
2.96e-07 |
glutamate decarboxylase 2 (pancreatic islets and brain, 65kDa) |
12 |
GAPDH |
* |
1.92e-07 |
glyceraldehyde-3-phosphate dehydrogenase |
13 |
GAPDH |
** |
3.45e-11 |
glyceraldehyde-3-phosphate dehydrogenase |
14 |
GC |
204965_at |
7.04e-09 |
group-specific component (vitamin D binding protein) |
15 |
GCG |
206422_at |
5.33e-10 |
glucagon |
16 |
GNAI1 |
209576_at |
9.24e-09 |
guanine nucleotide binding protein (G protein), alpha inhibiting activity polypeptide 1 |
17 |
GNAS |
200981_x_at |
1.79e-08 |
GNAS complex locus |
18 |
GNAS |
214548_x_at |
6.95e-08 |
GNAS complex locus |
19 |
GNAS |
200780_x_at |
1.17e-07 |
GNAS complex locus |
20 |
GNAS |
212273_x_at |
1.21e-08 |
GNAS complex locus |
21 |
GNAS |
214157_at |
7.59e-13 |
GNAS complex locus |
22 |
GPX3 |
214091_s_at |
2.08e-08 |
glutathione peroxidase 3 (plasma) |
23 |
GREM1 |
218468_s_at |
7.55e-13 |
gremlin 1 |
24 |
GREM1 |
218469_at |
7.54e-11 |
gremlin 1 |
25 |
GYG1 |
201554_x_at |
1.72e-08 |
glycogenin 1 |
26 |
HMGCR |
202539_s_at |
6.44e-12 |
3-hydroxy-3-methylglutaryl-CoA reductase |
27 |
HPRT1 |
202854_at |
1.95e-08 |
hypoxanthine phosphoribosyltransferase 1 |
28 |
HSPA8 |
210338_s_at |
1.08e-12 |
heat shock 70kDa protein 8 |
29 |
IAPP |
207062_at |
1.95e-18 |
islet amyloid polypeptide |
30 |
IARS2 |
217900_at |
2.22e-08 |
isoleucyl-tRNA synthetase 2, mitochondrial |
31 |
LEPROT |
202377_at |
1.57e-07 |
leptin receptor overlapping transcript |
32 |
LIPA |
201847_at |
1.28e-08 |
lipase A, lysosomal acid, cholesterol esterase |
33 |
NAMPT |
217738_at |
1.13e-09 |
nicotinamide phosphoribosyltransferase |
34 |
NEUROD1 |
206282_at |
2.51e-07 |
neurogenic differentiation 1 |
35 |
PCSK1 |
205825_at |
8.42e-18 |
proprotein convertase subtilisin/kexin type 1 |
| Table 6: The significant genes of Type 2 Diabetes Mellitus at α = 0.01/22283 = 4.49 × 10⁻⁷ when genes are matched with GeneCards data base The second column shows the name of the genes from UniGene bank. The third column shows the Entrez Gene Database UID number. The fourth column shows the p-values adjusted by Bonferroni correction. The last column shows the title of the gene represented by the probe set. In column three, * and ** symbols are replaced for AFFX-HUMGAPDH/M33197_M_at and AFFX-HUMGAPDH/M33197_5_at, respectively.ene represented by the probe set. In column three, ? symbol is replaced for AFFX-HUMGAPDH/M33197_5_at respectively |
||||
No. |
Gene Symbol |
ID |
PVAL |
Gene Title |
36 |
PEX2 |
210296_s_at |
3.26e-12 |
peroxisomal biogenesis factor 2 |
37 |
PFKM |
210976_s_at |
8.3e-08 |
phosphofructokinase, muscle |
38 |
PLAGL1 |
209318_x_at |
3.36e-09 |
pleiomorphic adenoma gene-like 1 |
39 |
PSMC6 |
201699_at |
3.54e-08 |
proteasome (prosome, macropain) 26S subunit, AT-Pase, 6 |
40 |
PTGS2 |
204748_at |
4.32e-07 |
prostaglandin-endoperoxide synthase 2 (prostaglandin G/H synthase and cyclooxygenase) |
41 |
PTPRN2 |
203029_s_at |
1.82e-07 |
protein tyrosine phosphatase, receptor type, N polypeptide 2 |
42 |
PTS |
209694_at |
3.06e-07 |
6-pyruvoyltetrahydropterin synthase |
43 |
RBP4 |
219140_s_at |
5.06e-14 |
retinol binding protein 4, plasma |
44 |
SCD |
200832_s_at |
4.2e-08 |
stearoyl-CoA desaturase (delta-9-desaturase) |
45 |
SDHB |
202675_at |
2.37e-09 |
succinate dehydrogenase complex, subunit B, iron sul-fur (Ip) |
46 |
SEL1L |
202061_s_at |
8.62e-10 |
sel-1 suppressor of lin-12-like (C. elegans) |
47 |
SSBP1 |
202591_s_at |
1.64e-10 |
single-stranded DNA binding protein 1 |
48 |
TFPI |
210665_at |
1.64e-09 |
tissue factor pathway inhibitor (lipoprotein-associated coagulation inhibitor) |
49 |
TFRC |
207332_s_at |
1.28e-10 |
transferrin receptor (p90, CD71) |
50 |
TTR |
209660_at |
5.23e-08 |
transthyretin |
51 |
USO1 |
201832_s_at |
2.12e-08 |
USO1 vesicle docking protein homolog (yeast) |
52 |
VDAC1 |
212038_s_at |
3.59e-09 |
voltage-dependent anion channel 1 |
| Table 7: Table 6 continues | ||||
No. |
Gene Symbol |
ID |
PVAL |
Gene Title |
1 |
ACP1 |
201630_s_at |
4.06e-12 |
acid phosphatase 1, soluble |
2 |
ALDOB |
217238_s_at |
3.5e-07 |
aldolase B, fructose-bisphosphate |
3 |
APC |
203525_s_at |
4.7e-07 |
adenomatous polyposis coli |
4 |
ARG2 |
203946_s_at |
1.34e-11 |
arginase, type II |
5 |
ATP5B |
201322_at |
1.28e-06 |
ATP synthase, H+ transporting, mitochondrial F1 complex, beta polypeptide |
6 |
CAT |
201432_at |
1.07e-08 |
catalase |
7 |
CFTR |
215702_s_at |
1.06e-06 |
cystic fibrosis transmembrane conductance regulator (ATP-binding cassette sub-family C, member 7) |
8 |
CPE |
201116_s_at |
8.65e-14 |
carboxypeptidase E |
9 |
CPE |
201117_s_at |
3.35e-08 |
carboxypeptidase E |
10 |
CTGF |
209101_at |
8.4e-07 |
connective tissue growth factor |
11 |
CX3CL1 |
823_at |
9.49e-07 |
chemokine (C-X3-C motif) ligand 1 |
12 |
CXCL10 |
204533_at |
1.17e-11 |
chemokine (C-X-C motif) ligand 10 |
13 |
CYB5R4 |
219079_at |
2.3e-07 |
cytochrome b5 reductase 4 |
14 |
CYCS |
208905_at |
1.85e-06 |
cytochrome c, somatic |
15 |
FABP5 |
202345_s_at |
2.08e-06 |
fatty acid binding protein 5 (psoriasis-associated) |
16 |
FTL |
213187_x_at |
3.83e-07 |
ferritin, light polypeptide |
17 |
FUCA1 |
202838_at |
4.38e-07 |
fucosidase, alpha-L- 1, tissue |
18 |
GAD2 |
206780_at |
2.96e-07 |
glutamate decarboxylase 2 (pancreatic islets and brain, 65kDa) |
19 |
GAPDH |
* |
1.92e-07 |
glyceraldehyde-3-phosphate dehydrogenase |
20 |
GAPDH |
** |
3.45e-11 |
glyceraldehyde-3-phosphate dehydrogenase |
21 |
GC |
204965_at |
7.04e-09 |
group-specific component (vitamin D binding protein) |
22 |
GCG |
206422_at |
5.33e-10 |
glucagon |
23 |
GFPT1 |
202722_s_at |
5.72e-07 |
glutamine–fructose-6-phosphate transaminase 1 |
24 |
GLO1 |
200681_at |
7.17e-07 |
glyoxalase I |
25 |
GNAI1 |
209576_at |
9.24e-09 |
guanine nucleotide binding protein (G protein), alpha inhibiting activity polypeptide 1 |
26 |
GNAS |
200981_x_at |
1.79e-08 |
GNAS complex locus |
27 |
GNAS |
212273_x_at |
1.21e-08 |
hypoxanthine phosphoribosyltransferase 1 |
28 |
GNAS |
200780_x_at |
1.17e-07 |
GNAS complex locus |
29 |
GNAS |
214157_at |
7.59e-13 |
GNAS complex locus |
30 |
GNAS |
214548_x_at |
6.95e-08 |
GNAS complex locus |
31 |
GPX3 |
214091_s_at |
2.08e-08 |
glutathione peroxidase 3 (plasma) |
32 |
GREM1 |
218469_at |
7.54e-11 |
gremlin 1 |
33 |
GREM1 |
218468_s_at |
7.55e-13 |
gremlin 1 |
34 |
GYG1 |
201554_x_at |
1.72e-08 |
glycogenin 1 |
35 |
HMGCR |
202539_s_at |
6.44e-12 |
3-hydroxy-3-methylglutaryl-CoA reductase |
| Table 8: The significant genes of Type 2 Diabetes Mellitus at α = 0.05/22283 = 2.24 × 10⁻⁶ when genes are matched with GeneCards data base In column three, *and **symbols are replaced for AFFX-HUMGAPDH/M33197_M_at and AFFX-HUMGAPDH/M33197_5_at, respectively. |
||||
No. |
Gene Symbol |
ID |
PVAL |
Gene Title |
36 |
HPRT1 |
202854_at |
1.95e-08 |
hypoxanthine phosphoribosyltransferase 1 |
37 |
HSPA8 |
210338_s_at |
1.08e-12 |
heat shock 70kDa protein 8 |
38 |
HSPA8 |
208687_x_at |
1.58e-06 |
heat shock 70kDa protein 8 |
39 |
HSPD1 |
200806_s_at |
1.24e-06 |
heat shock 60kDa protein 1 (chaperonin) |
40 |
IAPP |
207062_at |
1.95e-18 |
islet amyloid polypeptide |
41 |
IARS2 |
217900_at |
2.22e-08 |
isoleucyl-tRNA synthetase 2, mitochondrial |
42 |
INS |
206598_at |
5.49e-07 |
insulin |
43 |
ISL1 |
206104_at |
1.75e-06 |
ISL LIM homeobox 1 |
44 |
LEPROT |
202377_at |
1.57e-07 |
leptin receptor overlapping transcript |
45 |
LIPA |
201847_at |
1.28e-08 |
lipase A, lysosomal acid, cholesterol esterase |
46 |
NAMPT |
217738_at |
1.13e-09 |
nicotinamide phosphoribosyltransferase |
47 |
NEUROD1 |
206282_at |
2.51e-07 |
neurogenic differentiation 1 |
48 |
NUCB2 |
203675_at |
1.8e-06 |
nucleobindin 2 |
49 |
OGT |
209240_at |
1.32e-06 |
O-linked N-acetylglucosamine (GlcNAc) transferase (UDP-N-acetylglucosamine:polypeptide-N-acetylglucosaminyl transferase) |
50 |
PCSK1 |
205825_at |
8.42e-18 |
proprotein convertase subtilisin/kexin type 1 |
51 |
PDHX |
203067_at |
1.11e-06 |
pyruvate dehydrogenase complex, component X |
52 |
PEX2 |
210296_s_at |
3.26e-12 |
peroxisomal biogenesis factor 2 |
53 |
PFKM |
210976_s_at |
8.3e-08 |
phosphofructokinase, muscle |
54 |
PLAGL1 |
209318_x_at |
3.36e-09 |
pleiomorphic adenoma gene-like 1 |
55 |
PON2 |
210830_s_at |
6.93e-07 |
paraoxonase 2 |
56 |
PROS1 |
207808_s_at |
1.88e-06 |
protein S (alpha) |
57 |
PSMC6 |
201699_at |
3.54e-08 |
proteasome (prosome, macropain) 26S subunit, AT-Pase, 6 |
58 |
PTGS2 |
204748_at |
4.32e-07 |
prostaglandin-endoperoxide synthase 2 (prostaglandin G/H synthase and cyclooxygenase) |
59 |
PTPN12 |
202006_at |
5.75e-07 |
protein tyrosine phosphatase, non-receptor type 12 |
60 |
PTPRN2 |
203029_s_at |
1.82e-07 |
protein tyrosine phosphatase, receptor type, N polypeptide 2 |
61 |
PTS |
209694_at |
3.06e-07 |
6-pyruvoyltetrahydropterin synthase |
62 |
RBP4 |
219140_s_at |
5.06e-14 |
retinol binding protein 4, plasma |
63 |
SCD |
200832_s_at |
4.2e-08 |
stearoyl-CoA desaturase (delta-9-desaturase) |
64 |
SDHB |
202675_at |
2.37e-09 |
succinate dehydrogenase complex, subunit B, iron sulfur (Ip) |
65 |
SEL1L |
202061_s_at |
8.62e-10 |
sel-1 suppressor of lin-12-like (C. elegans) |
66 |
SSBP1 |
202591_s_at |
1.64e-10 |
single-stranded DNA binding protein 1 |
67 |
SST |
213921_at |
8.11e-07 |
somatostatin |
68 |
TFPI |
210665_at |
1.64e-09 |
tissue factor pathway inhibitor (lipoprotein-associated coagulation inhibitor) |
69 |
TFPI |
210664_s_at |
6.24e-07 |
tissue factor pathway inhibitor (lipoprotein-associated coagulation inhibitor) |
70 |
TFRC |
207332_s_at |
1.28e-10 |
transferrin receptor (p90, CD71) |
71 |
TTR |
209660_at |
5.23e-08 |
transthyretin |
72 |
USO1 |
201832_s_at |
2.12e-08 |
USO1 vesicle docking protein homolog (yeast) |
73 |
VDAC1 |
212038_s_at |
3.59e-09 |
voltage-dependent anion channel 1 |
| Table 9: Table 8 continues | ||||
No. |
Gene Symbol |
Panther family/subfamily |
PANTHER Protein Class |
1 |
APC |
Adenomatous polyposis coli protein (pthr12607:sf11) |
|
2 |
FTL |
Ferritin light chain (pthr11431:sf47) |
storage protein |
3 |
HMGCR |
3-hydroxy-3-methylglutaryl-Coenzyme a reductase (pthr10572:sf2) |
|
4 |
PEX2 |
Peroxisome biogenesis factor2 PEX2 ortholog |
|
5 |
PLAGL1 |
Zinc finger protein plagl1 (pthr10032:sf227) |
KRAB box transcription factor |
6 |
PTGS2 |
Prostaglandin g/h synthase 2 (pthr11903:sf8) |
oxygenase |
7 |
ATP5B |
Atp synthase subunit beta, mito-channel;
Chondrial (pthr15184:sf44) |
ATP ligand-gated ion channel; DNA binding protein; hydrolase |
8 |
GC |
Vitamin d-binding protein (pthr11385:sf11) |
|
9 |
GNAI1 |
Guanine nucleotide-binding Protein g(i) subunit alpha-1 (pthr10218:sf227) |
heterotrimeric G-protein |
10 |
GYG1 |
Glycogenin-1 (pthr11183:sf18) |
glycosyltransferase |
11 |
INS |
Insulin-related (pthr11454:sf9) |
growth factor; peptide hormone |
12 |
PON2 |
Serum paraoxonase/arylesterase 2
(pthr11799:sf17) |
|
13 |
FABP5 |
Fatty acid-binding protein, Epidermal-related (pthr11955:sf58) |
|
14 |
GREM1 |
Gremlin-1 (pthr15283:sf3) |
|
15 |
HPRT1 |
Hypoxanthine-guanine phosphoribo-syltransferase (pthr22573:sf38) |
glycosyltransferase; mutase |
16 |
IAPP |
Islet amyloid polypeptide (pthr10505:sf4) |
peptide hormone |
17 |
IARS2 |
Isoleucine–trna ligase, mitochon-Drial (pthr11946:sf82) |
aminoacyl-tRNA synthetase |
18 |
PCSK1 |
Prosaas (pthr15531:sf0) |
|
19 |
PTS |
6-pyruvoyl tetrahydrobiopterin syn- Thase (pthr12589:sf1) |
|
20 |
ARG2 |
Arginase-2, mitochondrial (pthr11358:sf18) |
hydrolase |
21 |
CTGF |
Connective tissue growth factor (pthr11348:sf7) |
growth factor |
22 |
FUCA1 |
Tissue alpha-l-fucosidase (pthr10030:sf2) |
|
| Table 10: Functional classification of the genes in Tables 6-9 by PANTHER | |||
No. |
Gene Symbol |
Panther family/subfamily |
PANTHER Protein Class |
23 |
GAPDH |
Glyceraldehyde-3-phosphate dehy- Drogenase (pthr10836:sf51)
|
Dehydrogenase |
24 |
GLO1 |
Lactoylglutathione lyase (pthr10374:sf8) |
|
25 |
ISL1 |
Insulin gene enhancer protein isl-1 (pthr24204:sf3) |
Homeobox transcription factor; zinc finger transcription factor; nucleic acid binding |
26 |
OGT |
Udp-n-acetylglucosamine–peptide N-acetylglucosaminyltransferase 110 Kda subunit (pthr23083:sf364) |
Glycosyltransferase |
27 |
PCSK1 |
Neuroendocrine convertas 1 (pthr10795:sf407) |
Serine protease |
28 |
PSMC6 |
26s protease regulatory subunit 10b (pthr23073:sf31) |
Hydrolase |
29 |
PTPN12 |
Tyrosine-protein phosphatase non-receptor type 12 (pthr19134:sf283) |
Protein phosphatase |
30 |
SSBP1 |
Single-stranded dna-binding pro- Tein, mitochondrial (pthr10302:sf0) |
DNA binding protein |
31 |
TFRC |
Transferrin receptor protein 1 (pthr10404:sf26) |
Receptor |
32 |
CFTR |
Cystic fibrosis transmembrane conductance regulator (pthr24223:sf19) |
Anion channel |
33 |
CXCL10 |
C-x-c motif chemokine 10 (pthr10179:sf47) |
Chemokine |
34 |
NEUROD1 |
Neurogenic differentiation factor 1 (pthr19290:sf88) |
Basic helix-loop-helix transcription factor; nuclease |
35 |
NUCB2 |
Nucleobindin-2 (pthr19237:sf22) |
Nucleic acid binding; annexin; calmodulin |
36 |
PDHX |
Pyruvate dehydrogenase pro-Tein x component, mitochondrial (pthr23151:sf57) |
Acetyltransferase |
37 |
PFKM |
6-phosphofructokinase, muscle type (pthr13697:sf13) |
Carbohydrate kinase |
38 |
RBP4 |
Retinol-binding protein 4 (pthr11873:sf2) |
transfer/carrie protein |
39 |
SCD |
Acyl-coa desaturase (pthr11351:sf31) |
|
40 |
SEL1L |
Protein sel-1 homolog 1 (pthr11102:sf70) |
Enzyme modulator |
41 |
SST |
Somatostatin (pthr10558:sf2) |
Peptid hormone |
42 |
USO1 |
General vesicular transport factor P115 (pthr10013:sf0) |
Membrane traffic protein |
43 |
CYCS |
Cytochrome c pthr11961:sf15) |
|
| Table 11: Table 10 continues | |||
No. |
Gene Symbol |
Panther family/subfamily |
PANTHER Protein Class |
44 |
GNAS |
Guanine nucleotide-binding protein G(s) subunit alpha isoforms xlas (pthr10218:sf36)
|
|
45 |
LEPROT |
Leptin receptor gene-related protein (pthr12050:sf3) |
Cytokine receptor |
46 |
TTR |
Transthyretin (pthr10395:sf12) |
Transporter; transfer/carrier protein |
47 |
ALDOB |
Fructose-bisphosphate aldolaseb (pthr11627:sf2) |
|
48 |
CAT |
Catalase (pthr11465:sf9) |
Peroxidase |
49 |
CPE |
Carboxypeptidase e (pthr11532:sf59) |
Metalloprotease |
50 |
CYB5R4 |
Cytochrome b5 reductase 4 (pthr19370:sf122) |
Reductase |
51 |
GCG |
Glucagon (pthr11418:sf0) |
Peptide hormone |
52 |
GFPT1 |
Glutamine–fructose-6-phosphate Aminotransferase [isomerizing] 1 (pthr10937:sf2) |
Transaminase |
53 |
LIPA |
Lysosomal acid lipase/cholesteryl es- Ter hydrolase (pthr11005:sf26) |
Lipase |
54 |
NAMPT |
Nicotinamide phosphoribosyltrans-Ferase (pthr11098:sf15) |
Cytokine |
55 |
PROS1 |
Vitamin k-dependent proteins (pthr24040:sf0) |
|
56 |
VDAC1 |
Voltage-dependent anion-selective channel protein 1 (pthr11743:sf13) |
Anion channel; voltage-gated ion channel |
57 |
ACP1 |
Low molecular weight phosphortyrosine protein phosphatase (pthr11717:sf7) |
Protein phosphatase; reductase |
58 |
CX3CL1 |
Fractalkine (pthr12015:sf92) |
Chemokine |
59 |
GAD2 |
Glutamate decarboxylase 2 (pthr11999:sf77) |
Decarboxylase |
60 |
GPX3 |
Glutathione peroxidase 3 (pthr11592:sf32) |
Peroxidase |
61 |
HSPA8 |
Heat shock cognate 71 kda protein (pthr19375:sf239) |
Hsp70 family chaperone |
62 |
PTPRN2 |
Receptor-type tyrosine-protein phos-
Phatase n2 (pthr19134:sf266) |
Receptor; protein phosphatase |
63 |
SDHB |
Succinate dehydrogenase [ubiquinone] iron-sulfur subunit, Mitochondrial (pthr11921:sf29) |
Dehydrogenase |
64 |
TFPI |
Tissue factor pathway inhibitor
(pthr10083:sf238) |
Serine protease inhibitor |
| Table 12: Table 10 continues | |||


