Open Access
Research Article
Max Screen >>
ISSN: 2454-4981
Copyright: © 2015 Miyaki K. This is an open-access article distributed under the terms of the Creative Commons Attribution License, which permits unrestricted use, distribution, and reproduction in any medium, provided the original author and source are credited.
Related article at Pubmed, Google Scholar
Background: Polymorphisms in methylenetetrahydrofolate reductase (MTHFR) gene, that is considered to be the most important genetic determinant of blood homocysteine concentration, are associated with various diseases, including psychiatric disorders. However, the epigenetic factors influencing on the transcription and expression of this gene are unclear. The current study aims to detect the relationship between epigenetic factor-DNA methylation status, on the human MTHFR gene and depressive symptoms in Japanese workers.
Methods: 774 DNA samples were extracted from saliva samples collected from subjects recruited for a mental health study, and an Illumina Human Methylation 450K Microarray Assay was used to examine DNA methylation profile across the human MTHFR gene. Depressive symptoms were determined by K6 questionnaire. Four independent DNA pools were created based on K6 scores, and the methylation levels were compared among the pools.
Results: The DNA methylation level was lower in subjects with higher degrees of depression for both the entire gene (p=2.10×10⁻¹⁴) and the 5’-upstream region (p=0.014). In subjects with higher depressive scores (K6≥10), DNA methylation rates on the whole gene were significantly decreased compared to those in nondepressed individuals (19.1% versus 20.8%, p=1.76×10-40). A significant decrease was also observed for the 5’-upstream region alone (7.6% versus 8.2%, p=1.16×10⁻¹¹).
Conclusions: Our observations revealed a reverse association between DNA methylation of the human MTHFR gene and depressive symptoms in Japanese workers. Further studies are needed to confirm the involvement of this epigenetic factor in folate metabolism.
Keywords: MTHFR; Epigenetic; Depressive symptoms; K6 score; Human Methylation450K Microarray Assay
List of abbreviations: AP-2α: Activating protein 2 alpha; BMI: Body mass index; E2F-1: E2F transcription factor 1; EDTA: Ethylenediaminetetraacetic acid; GR-α: Glucocorticoid receptor alpha; MAZ: MYC-associated zinc finger protein; MTHFR: Methylenetetrahydrofolate reductase; OCM: One-carbon metabolism; PPAR-δ: Peroxisome proliferator-activated receptor delta; PPAR-γ: Peroxisome proliferator-activated receptor gama; Q1: first group; Q4: fourth group; SD: Standard deviation; SESs: Socioeconomic status factors; SNPs: single-nucleotide polymorphisms; TE: Tris-EDTA
Folate is a crucial cofactor nutrient involved in the one-carbon metabolism (OCM) cycle, and its metabolism is vital to nucleic acid synthesis, methionine regeneration, shuttling, and redox reactions of one-carbon units required for normal metabolism and regulation [1]. Folate metabolism involves reduction of carbon atoms at the formyl, methylene, and methyl oxidation levels and that are covalently linked to nitrogen at position 5 and/or 10 [2]. In the folate metabolism pathway, 5,10-methylenetetrahydrofolate reductase (5,10-MTHFR) irreversibly converts 5,10-methylenetetrahydrofolate to 5-methyltetrahydrofolate, the primary circulating form of folate [3] and the carbon donor for methionine synthesis from homocysteine [1]. Thus, MTHFR and OCM play major roles in physiological processes by modifying the channeling of one-carbon units between nucleotide synthesis and DNA methylation [4].
The human MTHFR gene, which encodes 5,10-MTHFR, is located at chromosomal region lp36.3 and contains 11 exons [5]. Homberger, et al. demonstrated that MTHFR includes three novel exonic sequences and can produce four different transcripts through alternative transcription in itiation sites and alternative splicing [6]. The structure of the MTHFR gene is described in Figure 1a.
In the past two decades, two single-nucleotide polymorphisms (SNPs), i.e., C677T and A1298C, have been identified and have been shown to be associated with multiple diseases [7,8]. The C677T polymorphism, located on exon 4, has been extensively studied and is thought to be associated with the activity of the 5,10-MTHFR enzyme; compared with normal CC homozygous variants, the CT heterozygous and TT homozygous variants have lower enzyme activity levels in vitro [9]. Moreover, in vivo assays have indicated that TT homozygotes have the lowest red cell folate levels [10] and exhibit increased homocysteine levels [11]. In addition, this polymorphism has been shown to influence the plasma level of homocysteine and the response to folic acid intake [12]. Cumulative evidence has suggested that C677T is associated with psychiatric disorders, including anxiety and depression [13], schizophrenia [14] and bipolar disorder [15].
A recent study using computational analysis has reported the existence of a CpG island with a length of 1,104 base pairs near one of the alternative transcription initiation sites, exon 0a [16]. A number of cis-regulatory elements were found in this region and may influence the expression patterns of the MTHFR gene depending on the DNA methylation status. Although many studies have investigated the genetic mechanisms through which the MTHFR gene contributes to folate metabolism, serum homocysteine concentrations, and mental health, little is known about the involvement of epigenetic factors in these processes. Several studies have suggested the possible involvement of MTHFR gene methylation in the pathogenesis or development of end-stage renal disease [17], neural tube defects [18], and male infertility [19,20]; however, few studies have examined associations between MTHFR gene methylation and psychiatric diseases (Figure 1).
Therefore, in this study, we examined the methylation profiles of the entire human MTHFR gene and promoter region in order to evaluate the potential associations between epigenetic factors and depressive symptoms. We also aimed to investigate whether the C677T polymorphism in the MTHFR gene affected the mental health of Japanese workers.
In this study, we used data from a baseline survey obtained from an occupational cohort study on social class and health, which was supported by a grant from the Ministry of Education, Culture, Sports, Science, and Technology of Japan. The details of the cohort study were described previously [21].
The study population consisted of employees from a major Japanese manufacturing company with offices located across the country. Approximately 2,500 workers were involved in the occupational cohort study and were asked to provide saliva samples. In total, 976 individuals agreed to participate, and we obtained 774 samples. All participants were healthy and did not have any medical history of psychiatric disorders. The protocol and explanatory documents for our study were approved by the ethics committees of the National Center for Global Health and Medicine and Tokyo University Graduate School of Medicine. Written informed consent was obtained from all participants.
The subjects of this study received general health checkups, which included measurement of height, weight, blood pressure, and fasting plasma glucose levels. Information on age, current smoking status, and alcohol consumption was obtained for all subjects via a self-reported questionnaire.
Each participant provided 2 mL of saliva. Genomic DNA was extracted from leukocytes using the Oragene®•DNA Self-Collection Kit, OG-500 Tube Format (DNA Genotek, Ontario, Canada) [22]. All DNA samples were then diluted to a working concentration of 20 ng/μL with TE buffer (10 mMTris, 1 mM EDTA).
The 774 subjects who provided saliva samples were divided into quartiles according to their depressive scores. Depressive symptoms were assessed using the Japanese version of the Kessler 6 (K6) scale [23]. K6 score, job demands, and job control were assessed using a self-administered questionnaire [24]. The job strain score was calculated as the ratio of job demand to job control multiplied by 2.
Four independent pools were constructed by mixing 90 DNA samples randomly selected from each K6 quartile group, with a volume of 1 μL per sample. The total volume of each pool was 90 μL, and the total amount of DNA was 1.8 μg. This pooling method was validated in a previous study, which demonstrated that a DNA pool containing 89 individual samples could provide an accurate and reliable quantitative estimate of the average group DNA methylation status [25]. The DNA methylation profile was evaluated using Illumina Infinium HumanMethylation450 BeadChip arrays and kits (Illumina, San Diego, CA, USA). Bisulfite-converted DNA (4 μL) was used for hybridization onto the HumanMethylation450 BeadChip, according to the Illumina Infinium HD Methylation protocol.
Images of the single arrays were created using an IlluminaiScan SQ scanner, and the intensities of the images were extracted using Genome Studio (v.2011.1) Methylation module (v.1.9.0) software. The methylation score was calculated by two methods: the first was represented as the ratio of methylated-to-methylated plus unmethylated signal intensity, and the second was represented as the β value, computed by the formula below:
β= (intensity of methylated signal)/ (intensity of methylated signal+ intensity of unmethylated signal+100)
The sequence of the entire MTHFR gene was identified using the Ensemble Genome Browser (https://asia.ensembl.org/index.html, chr1:11,845,780-11,866,977). The methylation levels of CpG sites covered by HumanMethylation450 BeadChip probes were measured, and the average methylation levels of all merged CpG sites (No. 1–24) on the MTHFR gene in every pool were calculated. Furthermore, the merged CpG loci within the 5’-upstream region (No. 6–24), as well as those on the CpG island reported recently (No. 8–22), were analyzed independently. Subsequently, the methylation levels of groups with the lowest (first) and highest (fourth) K6 scores were compared using Pearson’s chi-squared test. In addition, the subjects were divided into two subgroups according to K6 scores: individuals with a K6 score greater than the median value (K6 = 10) were defined as “Depressive,” which corresponds to the total of the third and fourth groups, whereas those with a score lower than the median value were classified as “Normal.” The average DNA methylation levels were compared between Depressive and Normal groups using Pearson’s chi-squared test. IBM SPSS for Windows version 19.0J (IBM, Armonk, NY, USA) was used for all statistical analyses. Differences with P values of less than 0.05 were considered significant.
In total, 360 subjects (including 32 women) were selected from the four K6 groups to form the DNA pools. The mean (±standard deviation [SD]) age, body mass index (BMI), and K6 score were 43.3±4.7 years, 23.2±3.1 kg/m2, and 4.7±4.8, respectively. The basic clinical characteristics, socioeconomic status factors (SESs, including education level, household income, and job position), and job strain scores for these subjects are shown in Table 1, and the mean (± SD) values of these indices were compared among K6 groups. Systolic blood pressure, diastolic blood pressure, and the proportion of habitual drinkers were found to be significantly different among the four groups (p-values for trend tests <0.05).
The C677T SNP in MTHFR was analyzed using 633 DNA samples. The allele frequency of MTHFR polymorphism was determined by direct counting. The results of this genotyping analysis were consistent with the Hardy-Weinberg equilibrium (P=0.711). No differences in the distributions of genotypes were found among the four K6 groups (data not shown).
In total, 24 CpG loci were found throughout the whole MTHFR gene (numbered 1–24). Nineteen (No. 6–24) were located within the 5’-upstream region of the gene, 15 (No. 8–22) were found within the previously reported CpG island, five (No. 1-5) were located within gene body, and four (No. 8, 12, 13, and 14) were located at the binding regions of cis-regulatory elements [16].
The DNA methylation status of each site was examined by calculating the methylated-to-total signal intensity in all pools, and data for the first (Q1) and fourth (Q4) groups are presented in Table 2. Compared to the Q1 group, 12CpG sites were found to be significantly hypomethylated in the Q4 group (P<0.05), and 6 sites were hypermethylated. With respect to the 5’-upstream region, methylation levels were increased at five sites and decreased at 10 sites in the Q4 group compared with the Q1 group. In the CpG island, methylation values were higher in the Q4 group at five sites and lower at seven sites. In the gene body, methylation values were higher in the Q4 group at one site and lower at two sites. With respect to the binding regions of cis-regulatory elements, methylation values were higher in the Q4 group at one site and lower at one site.
The average methylation level of the 24 loci in the Q4 group was 19.5%, which was significantly lower than that observed in the Q1 group (20.7%, P=2.10 × 10⁻¹⁴, chi-squared test; Table 2). For the 5’-upstream region, the average methylation level for CpGs 6–24 in the Q4 group was also lower than that of the Q1 group (8.1% versus 7.8%, respectively, P=0.014, chi-squared test). For the CpG island, the two values became closer, but were still significantly different (4.2% versus 4.0%, respectively, P=0.048, chi-squared test).
The subjects were then divided into the Depressive and Normal groups according to the median K6 score (K6=10 in a 24-point scoring system), and the average DNA methylation levels were compared between the two groups (Table 3). From this analysis, we found that the average methylation levels of the 24 sites in the Depressive and Normal groups were 19.1% and 20.8%, respectively (P<0.001, chi-squared test). In the 5’-upstream region and the CpG island, the differences remained significant (5’-upstream region, 7.6% versus 8.2%, respectively, P<0.001; CpG island, 3.9% versus 4.2%, respectively, P<0.001).
In the current study, we examined differences in DNA methylation profiles of the MTHFR gene in subjects with and without depressive symptoms. We found that there were significant differences in the DNA methylation profiles of the human MTHFR gene between normal individuals and individuals with relatively higher depressive scores in an occupational study cohort in Japan. The average methylation rate at 24 CpG sites throughout the entire MTHFR gene was significantly decreased by about 2% in subjects with depressive scores (K6) of more than 10 as compared to subjects without depressive symptoms (K6 scores less than 10). A significant decrease was also observed in the 5’-upstream region of this gene. Therefore, these data suggested that the DNA methylation status of the MTHFR gene may affect the development of depressive symptoms.
Since 5,10-MTHFR plays a central role in folate metabolism, innate or acquired changes in this gene could influence the enzyme activity, thereby affecting the levels of folate and homocysteine. Indeed, two functional polymorphisms in the human MTHFR gene, i.e., C677T and A1298C, have been shown to be associated with serum folate [10,26] and plasma homocysteine levels [11,26,27]. Interestingly, a meta-analysis showed that low serum folate levels are associated with depression [28]. Moreover, in a cross-sectional study, our research group also found an inverse, independent relationship between folate intake and the risk of depressive symptoms [21]. Although the heritable variants in the MTHFR gene are thought to be involved in psychiatric diseases [13-15], few association studies have investigated heritable gene alteration/epigenetic factors, such as DNA methylation and chromatin remodeling. To the best of our knowledge, this is the first study to investigate the influence of epigenetic factors, particularly variations in the MTHFR gene, on depressive symptoms.
Our observations suggested that there was a significant decrease in DNA methylation levels throughout the entire MTHFR gene, corresponding to an increase in depressive score (K6). While still significant, this association was weaker when the range was limited in the 5’-upstream region of the MTHFR gene. In addition, according to recent computational research, there is a 1,104-bp CpG island (from position 11865463 toposition11866566) near or at the alternative promoter site [16]. With this region, several cis-regulatory elements have been identified. In our study, four CpG sites (No. 8, 12, 13, and 14) appeared to be located at the binding regions of cis-regulatory elements, including glucocorticoid receptor alpha (GR-α), peroxisome proliferator-activated receptor delta (PPAR-δ), peroxisome proliferator-activated receptor gama (PPAR-γ), MYC-associated zinc finger protein (MAZ), activating protein 2 alpha (AP-2α), and E2F transcription factor 1 (E2F-1). The No. 14 CpG site exhibited a lowerer methylation level in subjects with higher K6 scores; however, the No. 12 CpG site exhibited the opposite trend. Methylation levels of CpG sites 8 and 13 did not differ between the two K6 groups (Table 2). Thus, our results did not confirm the importance of the promoter region on the transcription and expression of the gene, and the presumption that DNA methylation at potential functional transcription factor binding sites would affect the output at the molecular level was not supported by this study. The promoter region on the transcription and expression of the gene is important, yet its function is unknown. One possible explanation for this observation was the limited statistical power of the microarray (Illumina Human Methylation 450K Microarray), which only allowed us to detect 15 methylation sites. On the other hand, five CpG sites (No. 1 to 5) appeared to be located in the gene body. Gene body methylation is reported to be positively correlated with gene expression [29]. However, methylation values were higher in the subjects with higher K6 scores at one site (No. 2) and two sites (No. 3 and 4) exhibited the opposite trend.
Additionally, not total hypo- or hyper-methylation, but methylation status of single CpG can reflect binding of transcription factors, and thus can have functional importance.
DNA methylation is generally associated with gene silencing, and methylation in the promoter region is thought to repress gene expression [30]. However, this conventional view is being challenged [31]. High-resolution mapping of DNA methylation has revealed that CpG sites are abundant in the promoter region as well as in exonic nucleosomes and at intron-exon junctions. Thus, DNA methylation may be related to elongation and RNA splicing [32]. By contrast, hypomethylation can also lead to decreased gene expression, particularly when it is present in the gene body. Several reports have suggested that gene body DNA methylation may increase transcriptional activity [29]. The increased complexity of these processes makes it difficult to determine the functional sites at which transcription and expression are suppressed by methylation. In this study, hypomethylation was linked to depression, contradicting the general view that DNA methylation would inhibit the expression of MTHFR, resulting in reduction of serum folate concentrations and subsequent depression. However, because only one of the four loci identified at the binding sites of transcription regulatory elements showed significantly decreased methylation, while another locus showed elevated methylation, we could not determine the precise effects of the DNA methylation status on gene expression. Therefore, further functional studies are needed.
We also performed genotyping of the C677T polymorphism in the MTHFR gene to explore the association of this well-known variant with depressive symptoms, job stress, and other mental health factors. However, we failed to confirm the relationship between this polymorphism in the MTHFR gene and depression. Because of the cost of the DNA methylation analysis, we chose to measure the methylation rates using pooled DNA samples; therefore, the individual relationships between genotypes and epigenetic profiles were not investigated.
There are several limitations to our study. First, gene expression was not evaluated in our studies although methylation profiles were clarified. Second, there is no universally accepted theory that slight difference in methylation would lead to a significantly different expression. However, it is possible to affect the expression significantly via small changes of methylation biologically.
In summary, the present study provides new evidence for the association between DNA methylation status of the MTHFR gene (both the whole gene and the 5’-upstream region) and depressive symptoms. Further studies will be required to determine the precise role of DNA methylation in mediating the expression of the MTHFR gene.
This research is funded by a Grant-in-Aid for Scientific Research (B) (No. 24390160, Chief: Dr. Koichi Miyaki) and a Grant-in-Aid for Scientific Research on Innovative Areas (Research in a Proposed Research Area) (No. 21119001 Chief: Dr. Norito Kawakami) by the Ministry of Education, Culture, Sports, Science and Technology, Japan, and by JSPS KAKENHI Grant Number 26253042 (Chief: Dr. Akizumi Tsutsumi).

![]()

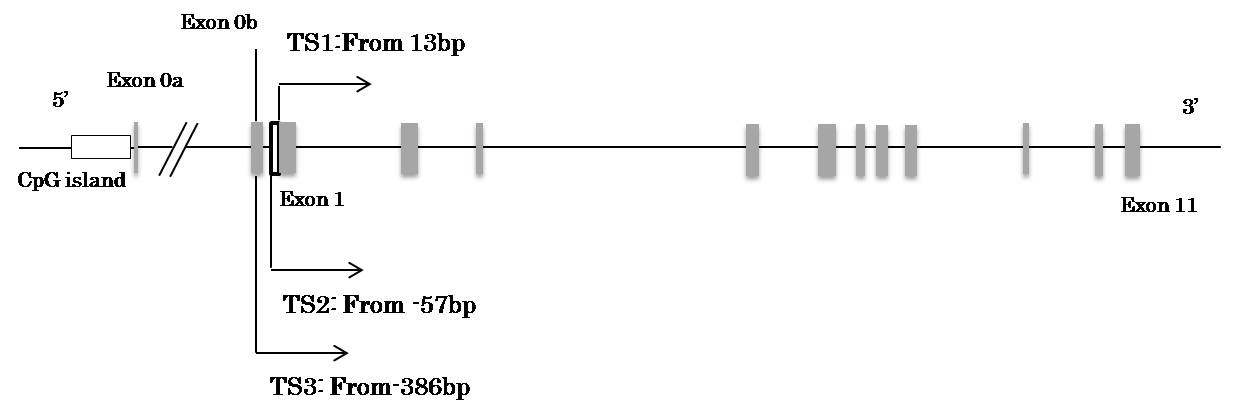 |
| Figure 1: The structure of human MTHFR gene and the DNA sequence of the CpG island (a) Gene structure. Eleven exons and two alterative translation intiation resulting in different transcripts (Exon 0a and 0b) are depicted by shaded boxes and the different translation start sites are indicated as TS 1-3. The CpG island on the 5’-upstream region is represented as a white box |
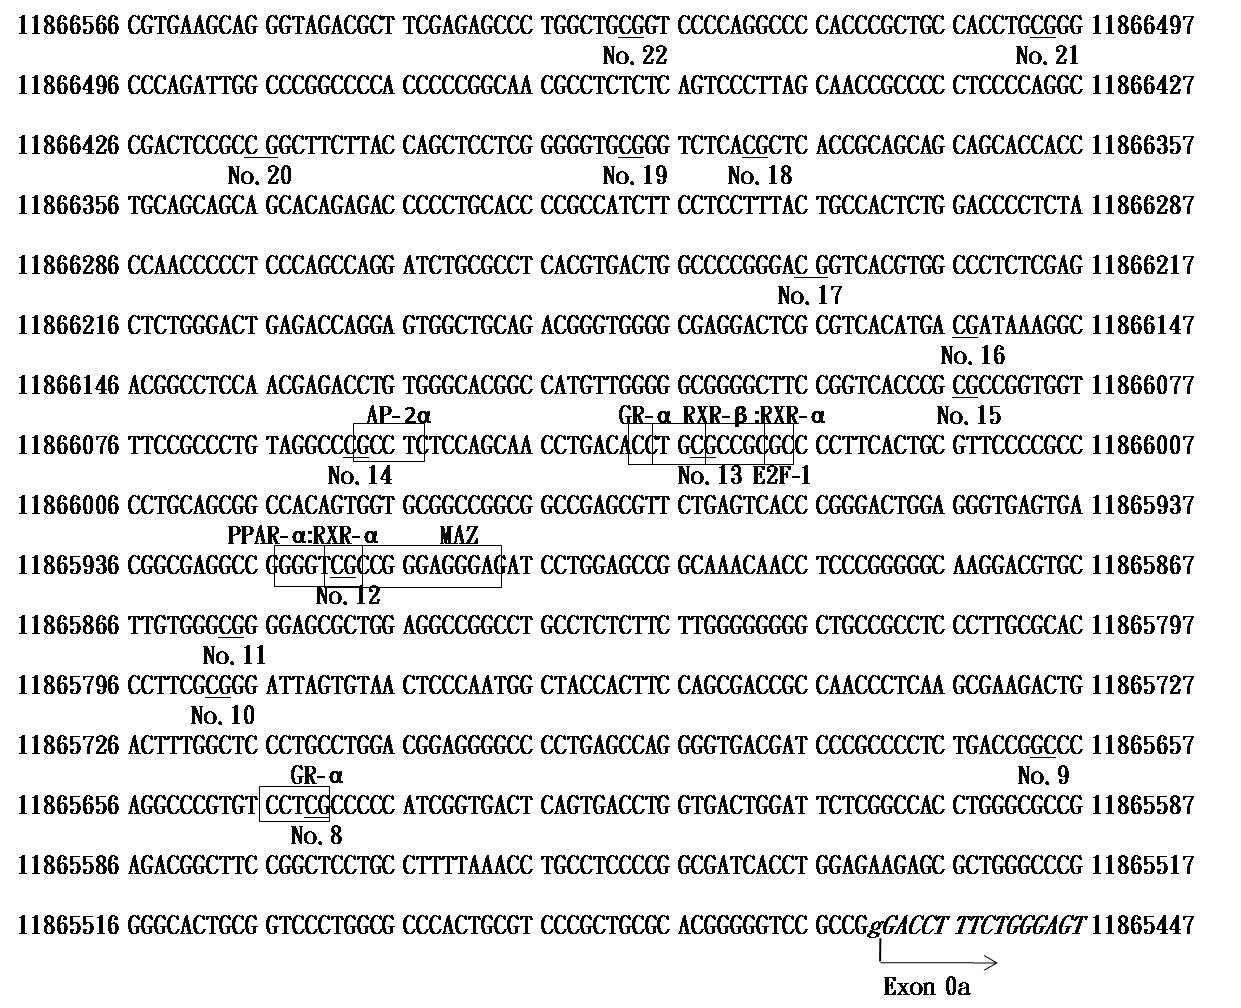 |
| Figure 1: (b) The sequence of the CpG island and some cis-regulatory elements within the 5' upsteam region The sequence was obtained from the UCSC Genome Browser (https://www.ensembl.org/index.html) and the location is consistent with Ref. 16. CpG sites which are covered by the Illumina Human Methylation 450K Microarray chip are underlined and labeled with their numbers. Cis-regulatatory elements with this region in which the CpG sites are located are depicted by transparent boxes GR-α: Glucocorticoid receptor alpha; PPAR-αRXR-α: peroxisome proliferator-activated receptor delta and peroxisome proliferator-activated receptor gamma; MAZ: MYC-associated zinc finger protein; AP-2α: activating protein 2 alpha; E2F-1: E2F transcription factor 1 |
Depressive score |
P for trend |
||||
1st quartile
(Lowest) |
2nd quartile |
3rd quartile |
4th quartile
(Highest) |
||
Age (year) |
42.4±9.9 |
43.5±10.4 |
44.7±10.1 |
42.6±9.4 |
0.716 |
Proportion of women (%) |
7.8 |
6.7 |
12.2 |
8.9 |
0.589 |
Body mass index (kg/m2) |
23.5±3.2 |
23.4±3.2 |
23.0±3.4 |
22.8±2.6 |
0.143 |
Systolic blood pressure (mmHg) |
127.1±14.0 |
122.5±15.6 |
122.5±17.9 |
120.2±14.8 |
0.012* |
Diastolic blood pressure (mmHg) |
79.8±12.0 |
76.9±11.5 |
76.8±14.0 |
75.5±10.4 |
0.042* |
Serum total cholesterol (mg/dL) |
205.1±28.4 |
201.3±70.1 |
201.7±37.4 |
202.9±36.3 |
0.813 |
Serum triglyceride (mg/dL) |
135.8±146.7 |
231.8±761.8 |
126.9±134.6 |
108.8±63.7 |
0.405 |
Serum high-density lipoprotein cholesterol (mg/dL) |
64.0±19.3 |
58.1±14.2 |
64.9±17.7 |
61.6±15.5 |
0.962 |
Fasting plasma glucose (mg/dL) |
96.6±18.0 |
95.9±25.7 |
94.8±12.3 |
93.4±12.5 |
0.302 |
Years of education (year) |
14.8±2.4 |
15.1±2.5 |
14.6±2.3 |
15.2±2.4 |
0.596 |
Annual household income (ten thousands yen/year) |
694.6±271.5 |
654.4±237.9 |
776.5±352.9 |
716.9±279.3 |
0.192 |
Proportion of individuals in a management position (%) |
23.8 |
21.3 |
27.2 |
30.0 |
0.603 |
Job strain score |
3.7±2.8 |
3.9±3.3 |
3.6±2.9 |
3.4±3.2 |
0.444 |
Proportion of current smokers (%) |
23.8 |
26.3 |
25.9 |
28.8 |
0.422 |
Proportion of subjects with habitual drinking (%) |
84.5 |
71.3 |
80.2 |
67.5 |
0.040* |
| The total subjects were stratified by K6 scores into 4 quartiles. 90 DNA samples each were randomly chosen from the four groups and used to form the DNA pools Values are shown as mean ± standard deviation or percentage. For continuous variables linear regression analysis was used, and for categorized variables Pearson's chi-square test was used to compare indices among the K6 groups. *: P < 0.05 Table 1: Comparisons of clinical characteristics, socioeconomic status, and job stress scales among four K6 groups |
|||||
No. |
CpG site ID |
Location of CpG site |
DNA Methylation |
P for Pearson’s chi-square test |
|
1st quartile (Least depressive, %) |
4th quartile (Most depressive, %) |
||||
1 |
cg22877851 |
Exon 11 |
84.9 |
84.3 |
0.375 |
2 |
cg21864959 |
Exon 11 |
68.0 |
70.2 |
5.94x10⁻³** |
3 |
cg23088157 |
Exon 10 |
85.7 |
81.8 |
1.10x10⁻⁹** |
4 |
cg18276943 |
Intron 8-9 |
94.5 |
89.8 |
1.66x10⁻¹²** |
5 |
cg17514528 |
Intron 1-2 |
27.9 |
28.7 |
0.557 |
6 |
cg17745097 |
5’ upstream |
7.4 |
5.4 |
1.89x10⁻⁴** |
7 |
cg05228408 |
5’ upstream |
29.3 |
28.7 |
0.353 |
8 |
cg01226883 |
5’ upstream |
3.7 |
4.2 |
0.108 |
9 |
cg08869383 |
5’ upstream |
3.1 |
2.5 |
0.031* |
10 |
cg01134491 |
5’ upstream |
2.8 |
4.3 |
1.58x10⁻⁵** |
11 |
cg05265975 |
5’ upstream |
3.3 |
5.6 |
2.31x10⁻¹⁴** |
12 |
cg27012203 |
5’ upstream |
2.7 |
3.7 |
3.19x10⁻³** |
13 |
cg12751404 |
5’ upstream |
2.8 |
2.7 |
0.711 |
14 |
cg23952195 |
5’ upstream |
2.0 |
1.3 |
3.03x10⁻³** |
15 |
cg02978542 |
5’ upstream |
6.5 |
5.2 |
1.10x10⁻³** |
16 |
cg08269394 |
5’ upstream |
2.3 |
1.1 |
3.33x10⁻¹²** |
17 |
cg23068701 |
5’ upstream |
2.9 |
3.1 |
0.424 |
18 |
cg14032528 |
5’ upstream |
7.2 |
4.9 |
4.60x10⁻⁴** |
19 |
cg23226134 |
5’ upstream |
17.1 |
9.4 |
2.36x10⁻⁸** |
20 |
cg10221637 |
5’ upstream |
8.2 |
11.0 |
3.95x10⁻⁴** |
21 |
cg25628740 |
5’ upstream |
4.7 |
5.7 |
0.019* |
22 |
cg11276438 |
5’ upstream |
9.9 |
6.2 |
2.22x10⁻¹⁵** |
23 |
cg18187189 |
5’ upstream |
11.7 |
10.4 |
0.033* |
24 |
cg14472778 |
5’ upstream |
88.3 |
85.4 |
5.21x10⁻³** |
The entire gene (No. 1-24) |
20.7 |
19.5 |
2.10x10⁻¹⁴** |
||
5’ upstream region (No. 6-24) |
8.1 |
7.8 |
0.014* |
||
CpG island on 5’ upstream region (No. 8-22) |
4.2 |
4.0 |
0.048* |
||
| The quantitative DNA methylation values for the CpG sites on human MTHFR gene between the pools of the first and fourth K6 quartiles are compared. P values show the significance for the Pearson’s chi-square test Table 2: Comparison of DNA methylation values for CpG sites on human MTHFR gene between K6 groups |
|||||
CpG sites included |
DNA Methylation |
P value |
||
The entire gene (No. 1-24) |
Depressive group |
Signal intensity (n) |
55744 |
1.76x10-40** |
(%) |
19∙1% |
|||
Normal group |
Signal intensity (n) |
54163 |
||
(%) |
20.8% |
|||
5’ upstream region (No. 6-24) |
Depressive group |
Signal intensity (n) |
18530 |
1.16x10⁻¹¹** |
(%) |
7.6% |
|||
Normal group |
Signal intensity (n) |
17373 |
||
(%) |
8.2% |
|||
CpG island on 5’ upstream region (No. 8-22) |
Depressive group |
Signal intensity (n) |
7704 |
1.03x10⁻⁶** |
(%) |
3.9% |
|||
Normal group |
Signal intensity (n) |
7331 |
||
(%) |
4.2% |
|||
| The χ2 test was used to compare the differences in the percentage of methylated signals between the pools of the normal and depressive groups. The participants were divided into two groups at the median point of the K6 score (K6 = 10), and the group with the higher K6 score was defined as the “Depressive group” ** P < 0.001 Table 3: Average DNA methylation rates for CpG sites on human MTHFR gene in two depression groups |
||||


