Open Access
Research Article
Max Screen >>
ISSN: 2348-9812
Copyright: © 2016 Gautam A. This is an open-access article distributed under the terms of the Creative Commons Attribution License, which permits unrestricted use, distribution, and reproduction in any medium, provided the original author and source are credited.
Related article at Pubmed, Google Scholar
A translucent UV protecting poly (methyl methacrylate) (PMMA)/TiO2 nanocomposite has been fabricated using anatase TiO2 nanoparticles by solution method. The myristic acid capped titania nanoparticles were synthesized via a simple sol-gel method, involving hydrolysis of titanium tetra isopropoxide (TTIP). So prepared nanoparticles were characterized by ultraviolet- visible (UV-Vis), photoluminescence (PL), fourier transform infrared (FTIR) and RAMAN spectroscopy. Morphology was studied with scanning electron microscope (SEM) and transmission electron microscope (TEM). Crystal phases were analyzed by X-Ray diffraction (XRD) measurements. The BET surface area was temperature dependant. % wt. loss was found to be about less than 6%. Similarly, the TiO2/PMMA nanocomposites were characterized by above tools. This nanocomposite film was tested for UV-shielding application via prevention of photo- chemical reaction between silver nitrate and Pyrrole under UVC irradiation. The films used for the shielding purpose were further analyzed by UV-Vis absorption and IR spectroscopy and by scanning electron microscope (SEM) to understand the effect of Pyrrole vapors on the film. The nanocomposite with ≤ 1.0 wt % of TiO2 showed improved thermal stability, high see through and optimum UV-shielding efficiency in the present case.
Keywords: Nanostructures, polymers, composite materials, UV shielding
List of Abbreviations: UV: Ultra violet; PMMA: Poly (methyl methacrylate); PNC: Polymer nanocomposite; NC: Nanocomposite; TTIP: Titanium Isopropoxide; RI: Refractive Index; BET: Brunauer-Emmett-Teller Analysis; TGA: Thermogravitimetric Analysis; CA: Contact Angle; PSD: Particle Size Distribution; AFM: Atomic Force Microscopy; NPs: Nanoparticles; Wt.: Weight; P: Pristine; Ag/PPy: Silver/Polypyrrole nanocomposite
Protection against ultraviolet radiation is an important issue in modern technological era [1,2]. The oxidation caused by the action of UV rays can form basis for acute mutilation to both living organisms and materials [3] e.g. action of photonic energy may produce undesired breakage of chemical structures in non-UV protecting materials [4] which can be detrimental to living organism. Additionally, skin photo-aging might take place under intense ultraviolet light [5]. UV-rays can also cause degradation of the organic molecules including polymers [6], bleaches [7], tinctures [8] and semiconductor photocatalysis [9]. UVC range (100-290 nm) light rays having energy of about 4.43-12.4 eV can cause more serious harm than that of UVB (290-320 nm) and UVA (320-400 nm) light rays possessing energies of about 3.94-4.43 eV and 3.10-3.94 eV respectively [10]. It is therefore intensely desired to develop a material which can block various ranges of ultra-violet rays particularly in the UVC range to minimize the possibility of damage. Such materials can be tailored by reinforcing inorganic fillers into a transparent polymer matrix, so that band gap in the desired region can be achieved which can further help in UV blocking.
In order to make practical use of such materials, it is appropriate to use them in the form of either solutions or polymeric films of fine powder [11]. The use of reinforced polymer matrix is advantageous over host material because such composites can be employed as UV protecting shields. The inorganic nano-particles having capability of cutting the UV absorption can be incorporated in polymer leading to the enhancement in their properties so that their utility in day to day life is dramatically enhanced. There are several reports emphasizing on reinforcement of a small amount of an inorganic material can boost up the functioning of the polymer matrix in thermo-mechanical, opto-electronic properties etc. [12-14]. This also leads to protection of polymer degradation thereby improving their shelf-life. Extended shelf-life is nowadays more desired than ever before due to applications of such UV blocking polymeric materials in food packaging too [15]. Thus, such nanocomposites have been marked as an apt candidate for UV blocking/ shielding applications. Wide band gap metal oxide semiconductors such as ZnO and TiO2 are environment friendly and posing tunable optical properties to be used as UV absorbers. It is well known that, amorphous TiO2 has a much higher band gap (~310 nm) when compared to the crystalline TiO2 phase (~400 nm), thus it is a promising candidate to shield harmful UV radiation, especially in the UV-C range [16,17].
Poly (methyl methacrylate) (PMMA) is one of the most versatile translucent polymer, with high transparency light transmission (>92%) [18] and therefore widely utilized to make windows, eye contact lenses, camera lenses for mobile phones, and other optical devices in the field of electro-optics [19]. However, low level of thermal stability coupled with inability to block UV rays limits high temperature application of PMMA. A number of researchers have studied the strategies to develop UV absorbing TiO2/PMMA or ZnO/PMMA nanocomposites [20-22]. Two general procedures have been documented [23]: in-situ process involves the polymerization of desired monomer and surface modified inorganic nanoparticles are generated simultaneously while in ex-situ method, the pre-prepared polymer and pre-synthesized inorganic nanoparticles are homogenized and dispersed. The in-situ polymerization has a challenge to maintain nanoparticles with good dispersibility and long term stability against agglomeration [23]. Whereas use of ex-situ generated inorganic nanoparticles for reinforcement is likely to result in extremely homogeneous nanocomposites with no phase separations [24].
Herein, we report a simple and effective method to prepare transparent PMMA/TiO2 nanocomposites by employing myristic acid modified TiO2 NPs. Based on the synthesis of soluble anatase titania nanoparticles with controlled size, TiO2/PMMA nanocomposite thin film was fabricated by solution casting method where the polymer was initially dissolved in toluene and was mixed with anatase titania nanoparticles dispersed in the same solution. The transparent TiO2/PMMA nanocomposite thin film showed promising thermal stability and high UV-C absorption efficiency at very low TiO2 concentrations (0.1 wt % and 1 wt%). This work describes fabrication of transparent organic/inorganic nanocomposite polymeric material possessing scope for UV shielding application by virtue of its optical properties.
Analytical grade titanium isopropoxide, myristic acid (tetradecanoic acid), absolute ethanol and sulphur free toluene were all purchased from Sigma-Aldrich India Ltd. Mumbai. PMMA– Poly (methyl methacrylate) granules PMMA IG 840 grade was purchased commercially. All chemicals and reagents were used as received. Deionized water was used during synthesis, for rinsing and cleaning purposes. X-ray diffraction (XRD) pattern was recorded using Cu Kα radiation (λ = 0.1546 nm) at a generated voltage of 40 kV and current of 120 mA at room temperature at scanning of 2°/min between 2θ 10-90º. Fourier transform infrared (FTIR) spectra were obtained using a Perkin Elmer Spectrum Two infrared spectrometer in the range of 4000 to 400 cm-1. Scanning electron microscope (SEM) measurement was carried out using Bruker Advanced operated at 300kV. Transmission electron microscopy (TEM) measurement was carried out on a Technai G2 electron microscope operated at 200 kV. Thermogravimetric analysis (TGA) was measured on a Perkin Elmer TGA7 under nitrogen from 25 oC to 850 oC at a constant heating rate of 10 oC/min. Ultraviolet absorption was recorded on a UV 210 UV/Vis spectrophotometer (Spec cord 210) in the wavelength range of 200 nm to 800 nm. Photoluminescence (PL) spectra were recorded on Agilent Technologies Instrument in the range of 250 nm - 800 nm with excitation wavelength of 320 nm. Raman analysis was done using EZ Raman spectrometer in the range 4000 to 400 cm-1. BET analysis was carried out using SSABETA-0405 Surface Area Analyzer under N2 gas. The thickness of the as-prepared films was measured using TINA digital micron thickness gauge tester instrument (model no. TG03-2013).
The anatase TiO2 NPs were synthesized via a modified sol-gel method, involving hydrolysis of TTIP in 2-propanol with myristic acid as a capping agent [25]. In a typical synthesis, 5 ml of TTIP was added into 30 ml of 2-propanol with a molar ratio of 1:6 with respect to myristic acid. After stirring for 3 hours on water bath, a milky white suspension (sol) was obtained. The gelation process was carried out by placing the sol solution in air at room temperature for 24 hours, and a white gel was obtained. The gel was centrifuged and washed with ethanol. White TiO2 NPs were dried at 50 oC in a vacuum oven for 8 hours.
The size of the TiO2 NPs could be controlled both by controlling the surfactant content and by controlling the temperature during synthesis. The titania nanoparticles synthesized at room temperatures are normally amorphous in nature. Therefore, systematic sintering was performed at 100 oC and 400 oC for 1 hr each at a prefixed heating rate of 50 oC per 10 minute under normal conditions. Subsequently, off white powders were collected and their analysis was carried out. The temperature less than 450 oC was considered favorable to disallow the conversion of anatase to rutile phase.
PMMA granules were used as received and weighed in the ratio of 1:25 (w/v) of PMMA: Solvent (Toulene). The granules were dispersed in the solvent in the 250ml beaker and kept for stirring at 60-80 oC. Gradually, the solution gets viscous enough to which pre-dispersed as- prepared and sintered TiO2 NPs were added and homogenized. The solution was stirred for another 2 hours at room temperature with occasional sonication in order to confirm the homogeneous dispersion of the nanoparticles. So-prepared viscous solution of TiO2/PMMA, was cast into films on a petri dish by drying for 24-48 hours at room temperature. TiO2/PMMA nanocomposite films with different concentrations of nanoparticles (0.1 wt % and 1.0 wt %) were prepared. The finally obtained film thickness was found to be about 0.8-1.0 mm in case of all samples.
Particle growth in nano-particle synthesis can be normally terminated and controlled by employing carboxylic acids, phosphines and amines as they are proven excellent surfactants. In the past, researchers had described use of various long chain carboxylic acids for their effective utilization in particle growth control [26-28]. The synthesis via sol-gel or modified sol-gel method, an intermediate state formation takes place which then gets transformed into a gel and finally to a powder. Such surface capped nano-particles are highly dispersible and their solubility depends on the nature of surfactants used e.g. hydrophobic or hydrophilic. The current method involves use of an organometallic precursor of titanium (TTIP) and tetradecanoic acid (acarboxylic acid) as surfactant. The overall typical schematic presentation involving different synthetic steps is shown in Scheme 1a. As-prepared powder was analyzed by optical spectroscopy and other modern tools for better understanding.
It has been reported by Parra et al [29] that, when TTIP reacts with acetic acid in presence of water, the probability of ester formation is minimized and a sort of dimer results from condensation of two octahedrons leading to formation of anatase TiO2. Authors further described that, the condensation process involves chemical reaction whereby labile water molecule decides the fate of final reaction and the product. The intermediate octahedral arrangement in TTIP during the chemical reaction leads to further condensation in such a way to favour formation anatase crystal structure in the end product. We opine that, myristic acid is also having similar functional group as that of acetic acid; therefore similar reaction can be expected in the present case as shown below in Scheme 1b.
XRD measurement revealed a broad pattern (indicative of small particles size) for the as- prepared and calcined at 100o, 400 oC nanoparticles. The diffractogram of all the samples showed relevant Bragg's reflection at 2θ value of about 25-75o corresponding to 101, 111, 004, 200, 211, 204, 220 tetragonal crystal planes of anatase phase of TiO2 (Figure 1A). Normally, calcination is performed at a certain temperature more than 450 oC to obtain such pure anatase phase nanoparticles but here in present case, pure anatase nanoparticles were obtained without calcinations above 450 oC. However, it was observed that, calcination at higher temperature leads to higher crystallinity and increased particle size without adversely affecting the diffraction peaks [23-25]. According to the literature reports, calcination at 400 oC of as synthesized 5 nm nanoparticle increases to 13.13 nm [30] which is resembling herein the present case also. The diameter of as-prepared powder (~4-6 nm) has been changed by about ~8 nm after calcination at 400 oC. While there are reports describing that, the anatase phase can change to rutile phase at calcination temperature higher than 450 °C however, according to some other reports [31], the fact is not accepted. However, from Figure 2 (ii) it can be observed that, with an increase in temperature, slight shift in 2θ value occur hinting towards phase change of TiO2 under high temperature.
Crystallite size was calculated using Scherrer equation i.e. D=kλ/ β cosθ. Where, D = crystallite size; λ = wavelength of X-rays; β = FWHM; θ = diffraction angle. The average particle size obtained for as synthesized nanoparticles by XRD data was found to be less than ~6 nm while it was around ~7 nm and ~14 nm for the calcined nanoparticles at 100° and 400 °C respectively (Table S1). Thus we report here, calcination only lead to increase in particle size while maintaining its phase. Therefore, the temperature used in this study is required to impart good crystallinity retaining anatase phase.
Similarly, X-ray diffraction studies were also employed to analyze myristic acid modified TiO2 nano-particles reinforced into the PMMA matrix (Figure 1B). The peaks identified within 100-200 can be related to PMMA while the peak within 220-480 are merged into a single broad diffraction peak for the PMMA reinforced TiO2 nanocomposites [32].
Figure 2 (i) & (ii) show effect of temperature on particle size and diffraction angle. It was observed that, with an increase in temperature, the particle size increases from 5.38 nm to 12.55 nm. Similarly, with an increase in particle size, there is a slight shift in 2θ values.
UV-Visible Spectroscopy: UV-Visible spectroscopy has been utilized to estimate the band-gap of TiO2 nanoparticles within the network polymer. It is known that anatase TiO2 has an absorbance wavelength of 385 nm. In the current measurement, the onset of absorption was observed at about 310-15 nm (full width at half of maximum is about 15-18 nm) resulting in a bandgap of >3.9 eV which is close to those reported for the anatase-TiO2 nanoparticles [Figure 3 (i) and (ii)] [25]. Such an increase in band gap is due to decrease in particle size with respect the bulk material with the blue shift of about 70-75 nm arising due to quantum confinement effect. There are reports revealing that, a blue shift of about 30-60 nm corresponds to a particle size of about 3-5 nm [33]. Thus in the present case size could be about ~4 nm when in solution. The same concept can also be employed for TiO2/PMMA nanocomposites where the absorption spectrum was blue shifted by about 40 nm. It can be stated that, the observations by some authors may be valid for our analysis too while the quantum confinement effect is observed to be limited to nanoparticle size as reported [34]. Slightly broadened absorption patterns hint towards inhomogeneous particle distribution within the nano regime in solution as well as in films. UV absorbance of TiO2/PMMA and bandgap for the same has been calculated which revealed an absorbance value of about 340 nm and the bandgap shift to nearly 3.24 eV [Figure 3 (iii) and (iv)] which when compared with the pure PMMA is very less and near to bulk TiO2 band gap and is in agreement with such reported relation [35]. From figure 3 (iii) it is very clear that, the UV-shielding capacity of the sample containing 1% TiO2 sintered at 400 °C will be more effective as compared to 0.1 (sintered at 400 °C) and 1% (sintered at 100 °C) respectively because it is showing good absorbance in the UV regime.
Illumination below this wavelength has adequate energy to stimulate the electrons present in the valence band and therefore, also absorbed by TiO2 particles. While, on the other hand, light with wavelength in excess of the band gap energy (towards the longer wavelength) will not get absorbed by TiO2 making it to an excellent UV absorber. Overall, it is observed that the band gap is affected by sintering in case of the TiO2 NPs. Considering above studies, it is observed that the relationship between band gap and particle size remains same in present study also (Figure 4).
Photoluminescence Studies: Light emitting properties in nano-titania may arise due to strong quantum confinement effect or due to presence of surface plasmons (because presence of Ti-OH). It is expected that, emission from the surface plasmon will obviously be of low energy however, the emission from quantum confinement phenomena will be of higher energy as the transition of core electrons require high energy excitation. The emission band in the present case is observed at about 385nm (~3.23 eV). Since, quantum confinement effect is more pronounced in spherical particles of size domain less than 10 nm therefore, it is possible to consider such high energy emission due to quantum confinement effect and not due to surface defects. Figure S1a shows photoluminescence spectrum of as-prepared TiO2 nano-particles with Stokes shift of 60-65 nm with reference to absorption band (λabs 316 nm and λem 385 with λex 320). This therefore rules out the emission in the visible light range due to absence of free Ti-OH states. In a similar fashion, the TiO2/PMMA films were also subjected to photoluminescence studies which showed emission range of 420-426 nm with the excitation at 340 nm with slight blue shift. The blue shift is attributed due to the higher wt. % of nanoparticles and sintered at 400 °C. In view of above, we presume that increasing temperature and concentration can result in blue shift (Figure S1b).
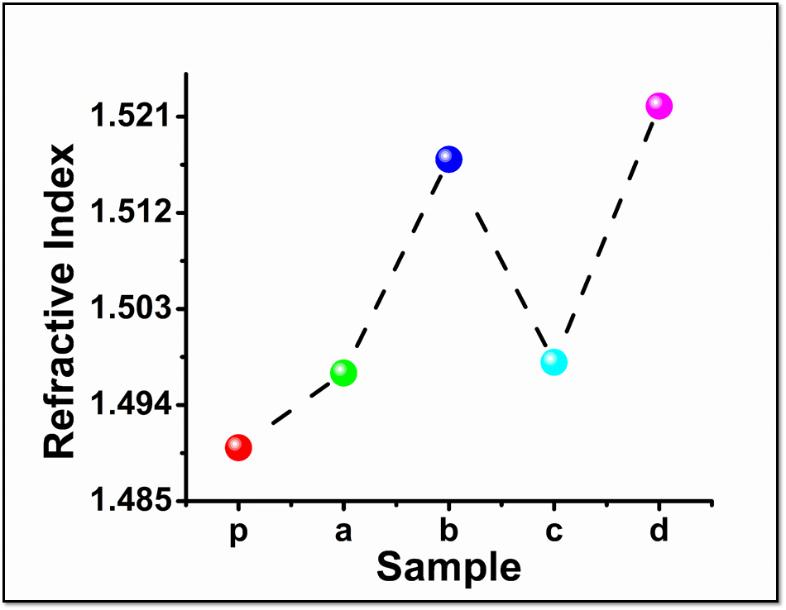
Refractive Index (RI): The RI value for pristine PMMA was observed to be 1.490 (p) which is in agreement with reported. The RI values increased linearly with the increasing TiO2 (0.1 to 1%) in PMMA matrix (Figure S2, Table S2). It was found that, composite having 0.1% of TiO2 (irrespective of variation in sintering temperature) retains nearly the same value (b, d) as observed for composite with 0.1% of as-prepared nano-particles (a). However, it was observed that, higher loading of 1% has resulted in slight increase in refractive index value of the composite whereas the fillers which were sintered at 100º and 400 ºC (c, e). It is possible to assume that, greater refraction of light will result from higher loading of nano-particles and will enhance UV- blocking efficiency of the film [36-38].
Infrared Spectroscopy Studies: The FTIR spectra of the titanium nanoparticles calcined at various temperatures is shown in figure S3. The peaks observed in between 500 and 900 cm-1C can be attributed to the characteristic vibrational modes of TiO2 [39]. The absorption peaks near 3342 and 1630 cm-1C are attributed to the presence of stretching and bending vibrations of due to C–H, C=O, and CH2. The peak near 1100 cm-1C is attributed to the C-O stretching frequency. These peaks observed can be termed as razor-sharp while the transmittance remains quite good up-to sample sintered at temperature of 100 °C. However, when the nanoparticles sintered at 400 °C, intensity of all peaks have reduced due to decomposition of the capping agent/ surfactant and loss of carboxylate group resulting in the formation of gaseous CO2. However, presence of capping was still evident from the broad patterns between 1500 -1700 cm-1C [40]. In the present case formation of Ti-OH was not evident from IR spectroscopy with no broad peak in 2400-3400 cm-1C thus confirming the complete transformation of the precursor into phase pure TiO2. Thus FTIR of these nanoparticles in PMMA matrix also showed some peaks relevant to capping and host polymer matrix. The broad peak at about 490 cm-1C found in the myristic acid modified samples encapsulated in PMMA indicates the Ti-O stretching vibrations. The other peak observed at 950-1100 cm-1C corresponds to the interaction between the Ti-O network and the C=O in the myristic acid.
Raman Studies: C-H stretching and N-H bending observed in the range of 500-750 cm-1, where active peaks near 138-142, 305, 510, 624 cm-1 are prominent for the anatase phase TiO2 NPs because of Eg, B1g, A1g and Eg vibrational changes respectively. Neither signal characteristics of brookite nor rutile phases of TiO2 having Raman shifts in the range of 249- 826 cm-1 respectively, appear in the spectra. C-H and N-H bending mode of vibrations are observed between 500-800 cm-1 in the TiO2 NPs as well as in PMMA-TiO2 films. According by Ohsaka et al, anatase TiO2 has six Raman active modes (A1g+ 2B1g + 3Eg). They reported six Raman peaks at centered 144 cm-1 (Eg), 197 cm-1 (Eg), 399 cm-1 (B1g), 513 cm-1 (A1g), 519 cm-1 (B1g), and 639 cm-1 (Eg). It is further reported that, with decrease in particle size, Raman bands shift towards higher wavenumber and their intensities may marginally decrease. Indeed, in our findings too, the intensities are weak thereby implying that the particle size is much small which in fact correlate well with the data obtained from other analyses. In the present study only four clear peaks were obtained, in addition to signature of other small peaks however, their overlapping cannot be ruled out [41]. It is also observed that, with sintering temperature 100 °C the intensity is not affected irrespective of % loading which in case of enhanced sintering temperature to 400 °C has increased significantly in powder as well as in nano-composites (Figure S4).
Electron Microscopy: Scanning electron microscope (SEM) images show spherical particles irrespective of sintering temperature (Figure 5). As-prepared sample shows fluffier appearance when the sample sintered at 100 °C and 400 °C appear to be denser with unaffected shape and the increase in diameter of particle.
The average diameter of the particles was found to be 7 nm for as prepared NPs while those calcined at 100 °C and 400 °C observed to be 8-15 nm particles range with retention of non-agglomerated spherical shape which will be more useful as far as the UV-shielding studies are concerned. The EDAX analysis of 400 °C calcined TiO2 nanoparticle sample confirmed composition as 1:2, as expected for TiO2. Similar observations have been reported by Huang and Asta et al [42a,b].
In case of TiO2/PMMA nano-composites, the situation is much different. As shown in Figure 6, the films indicate the obvious clustering of the NPs with respect to increasing percentage in the polymer matrix. It was observed that 0.1% loading has resulted in nearly uniform distribution than 1% than the sample which was sintered at 400 °C in polymer matrix showed clustering. The pristine sample itself shows sort of layer formation during the film formation which continue even after loading of nano-particles.
TEM is proven and powerful tool for studying the particle size, shape and crystal properties including lattice spacing in a given nanostructure material [43-45]. In (Figure 7a,b and c) shows TEM images of as-prepared, sintered at 100 °C and 400 °C TiO2 NPs. Indeed, it was observed that, the TEM shows spherical particle with lattice fringes, characteristics of crystalline nature. The X-ray diffraction pattern also signifies the crystalline nature of the so synthesized nanoparticles. The particle size was observed to be less than ~8 nm. The lattice spacing was calculated using the line plot as shown in figure below. The d-spacing was calculated to be about 0.35 nm which is in agreement with the value that is obtained from XRD diffraction. The BET measurement was also carried out which revealed that the nanoparticles have high surface area of 204.059m2/g, 109.302m2/g and 84.627 m2/g for as-prepared powder, (sintered samples)100 °C and 400 °C respectively [presented in ESI as Table S2, Figure S5] [46,47].
Thermogravimetric Analysis (TGA): Thermal analysis (TGA) studies resulted in observation of the thermal stability of as prepared nanoparticles enhanced after sintering at 400 °C (Figure S6). Analysis of TiO2 mediated nanoparticles with myristic acid showed three-stage decomposition profile. The three main zones were identified, which corresponds to evaporation of trapped moisture which might have been physically adsorbed and elimination of alcohol in the range 70°-180 °C and the other zone identified between range 260°-340 °C signifies burning of the residual organic capping material while the last zone lies in the range 360°-800 °C due to the conversion of the amorphous carbon formed by the decomposition of the organic moieties, to gaseous molecules leading to a 90-95% wt. loss. It was also observed that, sintering of samples obtained at the higher temperatures (100° and 400 °C showed the minimum weight losses) when compared to unsintered sample. Analysis of TiO2 in PMMA showed a three-stage decomposition profile [48]. The data is shown in Table S4.
Contact Angle (CA): Wettability is an important parameter, and porous films usually display a hydrophilic character due to the presence of nanoparticles likely to be entrapped inside the pores resulting in surface roughness [49]. The pure TiO2 exhibits contact angle at about 23-25° as per reports [49]. Figure 8 exhibits the preceding water contact angles of the as-prepared polymer films from PMMA solutions with different % loading of TiO2 NPs and pure PMMA film. The CA data demonstrate that all of the films fabricated by solution cast method are hydrophilic, and the CA increases with increasing the loading concentrations. The CA of porous films was larger than that of the smooth pure PMMA film fabricated. For example, composite with 1% TiO2 loading is slightly porous in nature and is less hydrophilic (CA = 73.24° ± 1°) in comparison to pristine PMMA film (CA = 66.88° ± 1°). The data on CA measurements are presented in Table 1. Based on the CA, it is possible to comment that the TiO2 reinforced films of PMMA has good wet ability [50].
Particle Size Distribution: The dispersibility of the nano TiO2 in DMF has been assessed using the clear solution of nanoparticles in the solvent. In agreement with the Tyndall scattering, [51] a laser beam passing through the solution of nanoparticles (Figure S7) can substantiate that the nanoparticles have homogeneously and narrowly dispersed in a given solvent system, (in present case DMF). TiO2 nanoparticles in DMF indicate high dispersity due to coordinating nature of the solvent through nitrogen atom. The average size distribution of the TiO2 nano-crystallites is found to be about 1-7 nm and the distribution size increased with increasing sintering temperature. Such observations related well with finding of XRD and SEM analysis. Figure S7 shows the size distribution of all the three samples and the changes in particle distribution and relative peak width. It is observed from the figure that despite average size of 400 °C sintered samples from XRD being 15 nm, their distribution remains within a narrow range. Indeed, due to such narrow particle distribution, excellent optical properties could be obtained as shown in Figure 1A.
Atomic Force Microscopy: The evolution of the topography of the PMMA surfaces as observed by AFM. The native PMMA surface is homogeneous with a mean roughness value equal to 2.0 nm. But after reinforcing the NPs in it, a characteristic hill–valley structure of surface appears (with Ra being equal to 33 nm). This hill–valley structure can be explained by the agglomeration effect of the NPs on the surface. Such surfaces of the composite materials will be more effective for the UV- shielding and therefore present article focuses on this application in particular.
The pitted surface is due to incorporation of TiO2 in the film. The values of root-mean- square (rms) roughness are 1.468 nm for PMMA alone and between 3.67 nm - 7.36 nm for NPs loaded PMMA (Figure 9 and ESI 8). It is observed that TiO2 particles have spherical topology and adhered uniformly to the roughened PMMA surface which increases with increase in %TiO2 particle loading [52].
UV Shielding ability was studied by undertaking a specific reaction of silver nitrate and excess pyrrole in presence of artificial illumination. As per reported method silver nitrate in presence of excess pyrrole can be converted to Ag/PPy via photocatalytic process between silver nitrate and pyrrole molecule. It is known that, Ag/PPy composite can be synthesized in normal day light at room temperature, thermally and sonochemically driven reaction [53a]. Through the present work it is shown that the formation of Ag/PPy can be suppressed due to blocking of photonic energy for the reaction of silver nitrate and pyrrole. Indeed, it is observed that, in the presence of UV light source (254 nm wavelength) the reaction proceeds towards polymerization of pyrrole and eventually completes with the formation of polypyrrole composite with silver nano-particles as shown in scheme 2 and figure 10. However, the same does not take place in presence of TiO2/PMMA thin film acting as UV-blocking shield thus inhibiting the formation of polypyrrole as can be seen from the absorption spectra. UV-Visible spectrum of the reaction mixture where no composite film was used as a shield shows peaks related to polypyrrole at 435 and 465 nm along with surface plasmon resonance peak of silver nano-particles which is merged with polypyrrole peaks. However, no such band or peak development was observed during the same period of time when the experiment vessel was covered with TiO2/PMMA for blocking UV-C source light at 254 nm. This shows that effectively, the UV light shielding can be achieved in the range of 300 nm range. Initially there was no difference in both reactions for up-to about 24 hours however, the photo-polymerization happening and suppression was monitored in a 48 hours reactions. It can be presumed, that the sheet so prepared can efficiently block UV rays up- to 300 nm. The TiO2/PMMA film can be considered for longevity, a successful shielding against the UV-C light even after a month period. The overall UV shielding process is shown in Scheme 2. The film was able to shield the photochemical reaction for over a month and subsequently the optical and other properties of the films were studied to understand possible long term applications. It is further assumed that, film thickness could also play decisive role in the UV shielding and therefore, film thickness measurements were also carried out. According to the measurement results thickness of samples used for UV-shielding application were found to be about 0.8 mm. The thickness of film was maintained at 0.8 mm so that, transparency of the TiO2/PMMA film will remain intact. The increase in the film thickness will adversely affect transparency and thus on the shielding ability. The TiO2/PMMA sheet used for blocking UV-C rays to suppress the formation of polypyrrole and Ag/PPy, was further studied to understand the hydrophilic/ hydrophobic behavior by measuring contact angle and by comparing the same with the original film. Contact angle analysis was carried out using water spreading method on the sheet which was used to suppress the reaction, surprisingly showed excellent hydrophilic character.
Present findings were compared with the results reported in the literature and it was found that, present results are satisfactory when compared with the following examples; Okuyama et al [53b] adopted the ball milling method for the synthesis of the titania nanoparticles and polymerization from MMA monomer for in-situ growth of TiO2/PMMA composite. TiO2/ PMMA NCs were initially tested for their UV blocking ability by UV-Visible light transmission.
When compared with pristine PMMA reveals good transmission in the visible region whereas negligible in UV region. Similar tests were conducted by Qi et al [53c] for the in situ synthesized TiO2/ PMMA NCs; where they had observed the decline in the UV region as the concentration of titania nanoparticles was increased. The transparency of the TiO2/PMMA nanocomposite films was tested with help of the UV-Vis spectrometry which revealed the high transparency in the visible region and low transparency in the UV region as reported by Meng et al [53d]. The Woong et al described method of SPF for the testing of so prepared TiO2/PMMA nanocomposite films [53e]. Their study concludes that the scattering occurs due to TiO2 NPs reinforcing which acts as UV absorber imparting its properties to the polymer membrane.
The contact angle was measured to be 36.92° for the sheet which was exposed to vapors of pyrrole during the photo-polymerization process for suppression of formation of Ag/PPy and 59.29° for the sheet which was exposed to direct UV-C illumination (Figure S9). By this test, we can presume that the film got super-hydrophilic with deposition of some Ag/Ppy content onto its surface and also due to illumination of UV-C.
Refractive Index value was found to be more than the pristine and 1% TiO2/PMMA sheet. Also the color of the film was changed to off white. The change in color was observed due to the penetration of pyrrole vapors into the films, as the film was slightly porous in character. Owing to color change, the refraction of light is adversely affection thereby giving rise to higher refractive index in comparison to pure composite. RI values of PMMA and 1% composite with TiO2 is compared in graph as shown in figure S10. The index found to be more than the TiO2/PMMA sheets which were not surface treated. This sudden change in RI values may also because of the activation of the TiO2 nanoparticles with exposure to UV-C and the deposition of Ag/Ppy onto the surface which modified the surface of the polymer nanocomposite.
TiO2/PMMA sheets used for shielding of UV-C rays were also analyzed using SEM to understand the changes on the surface of the PMMA. Nanoparticles are presumed to be activated due to the exposure to UV-C rays and could be emitting some kind of light due to exposure/ absorption to high energy rays which could be seen in the images while the sheet which was exposed to Ag/PPy have some amount of vapors deposited thus causing the chemical etching on the surface thereby affecting the morphology of the particle embedded in the film as well as brittleness leading to loss of homogeneity and film smoothness (Figure S11).
It is well known that TiO2 nano-particles show antibacterial properties thereby offering excellent scope for their application in variety of areas [54]. Commercial viability of any material multiplies by having more user friendly properties. Antibacterial quality coupled with UV shielding ability of TiO2/PMMA can be considered much closer to application in photo and bacterial resistant coatings and other materials for human utility. It is therefore logical to study the bacterial resistant ability of such composite as used in the present work. Indeed, inhibition of bacterial colony growth was observed from one such sample having 1% loading of titanium dioxide. The zone inhibition process pictured for Pseudomonas Aeruginosa is shown in figure S12, indicate about three times effective inhibition in comparison to reference film of PMMA (irrespective of thickness). Overall film containing nano-particles showed that higher TiO2 concentration can be more effective for bacterial growth inhibition. The mechanism of growth inhibition due to TiO2 nanoparticle can be expressed in terms of deficiency of oxygen on the surface of the pathogens. In other words, when TiO2 nanoparticles are kept under the UV or visible light irradiation they will go through changes in physical properties thereby causing electronic transitions [54]. Alternatively, pre-adsorbed oxygen present on the surface of film due to porous nature may prevent free oxygen supply to bacteria, and viruses thus causing deactivation.
TiO2/PMMA nanocomposites with chemical bonding between nanofiller and polymer matrix were synthesized using the myristic acid capping. The coordination of myristic acid onto the TiO2 nanoparticle was confirmed by IR spectroscopy. An excellent distribution of the nanofiller within the polymer matrix was observed by the using SEM micrographs. Electron microscopy results showed smaller sizes of so-synthesized nanoparticles while thermal analysis showed enhanced thermal stability of the particles. AFM images revealed rough surface topology which was found to be hydrophilic in nature by Contact angle analysis. The Photocatalytic studies proved that the nanocomposite so fabricated possess the UV shielding efficiency which was justified by suppression of photochemical transformation in a reaction between silver nitrate with pyrrole. The so fabricated TiO2/PMMA nanocomposites were also examined for its antibacterial properties which has positive results. Anatase phase TiO2 nanoparticles act as an UV absorber.
The authors are grateful to the Vice Chancellor, DIAT for providing facility for the fulfillment of this research. Funding received from CARS Project from Naval Materials Research Laboratory (NMRL), DRDO, India is gratefully acknowledged.

![]()

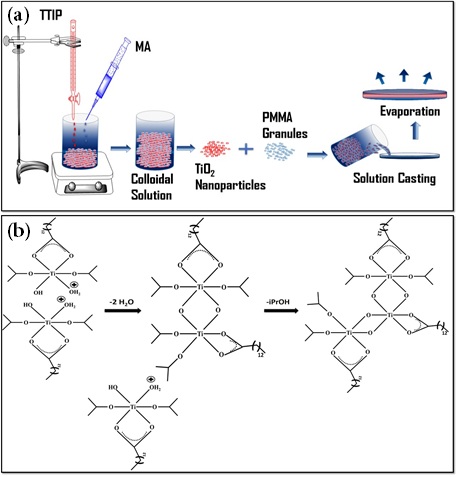 |
| Scheme 1: a) Steps involved in synthesis of anatase TiO2 nano-particles and their composite with PMMA b) Synthesis of anatase TiO2 nano-particles: the reaction hypothesis [29] |
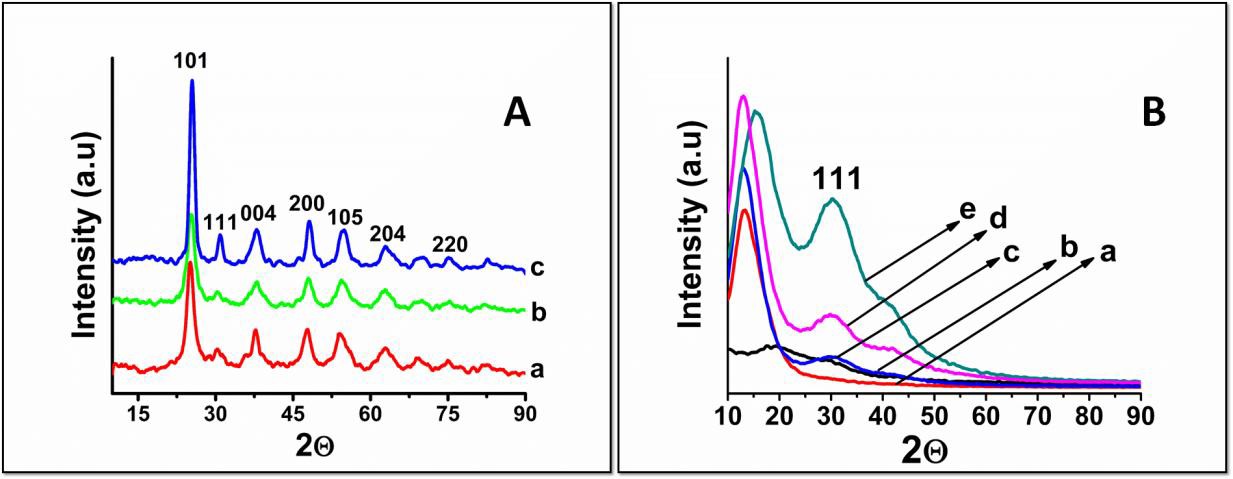 |
| Figure 1: XRD pattern shows [A] (a) as prepared NPs (b) NPs 1000 calcined (c) NPs 4000 calcined ; [B] patterns of the films so prepared in comparison with pristine PMMA a) pristine PMMA b) 0.1% 100 oC calcined c) 1% 100 oC calcined d) 0.1% 400 oC calcined e) 1% 400 oC calcined |
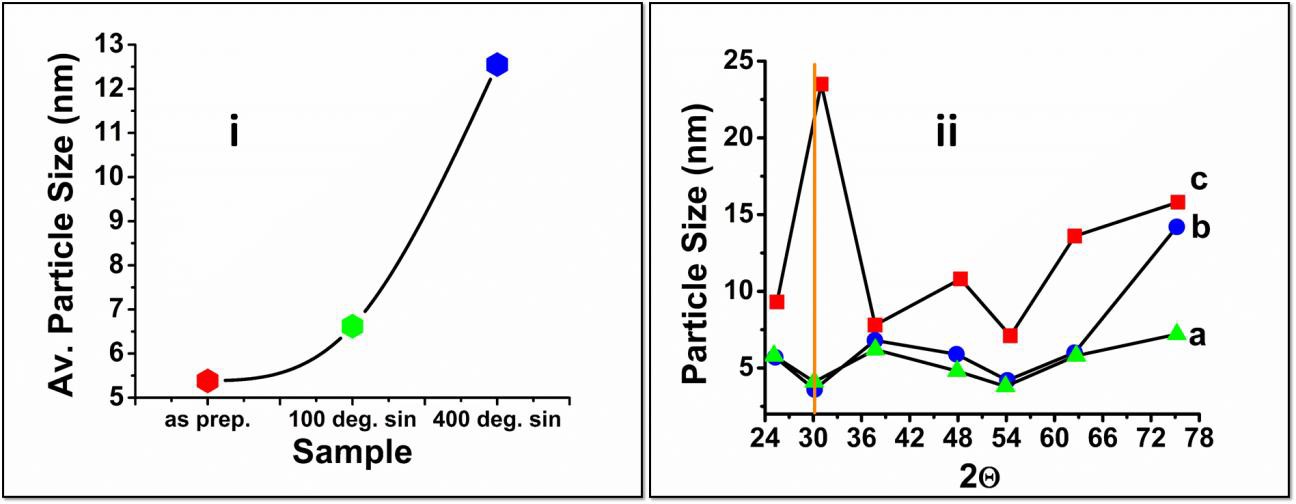 |
| Figure 2: Effect of temperature on i) Particle Size and ii) Average Particle size & diffraction angle [(a) as prepared NPs (b) NPs 100 oC calcined (c) NPs 400 oC calcined] |
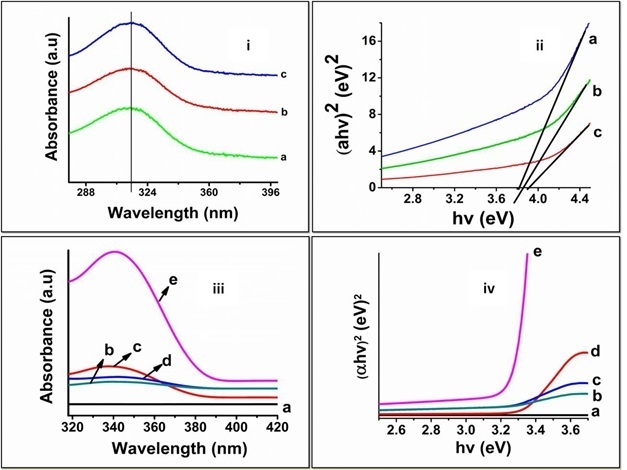 |
| Figure 3: (i) UV-Visible absorption spectra of TiO2 NPs a) as-prepared b) 100 °C sintered c) 400 °C sintered (ii) bandgap of TiO2 NPs a) as-prepared b) 100 °C sintered c) 400 °C sintered (iii) UV- Visible absorbance spectra of films prepared a) pristine b) 0.1% 100 °C calcined c) 1% 100 °C calcined d) 0.1% 400 °C calcined e) 1% 400 °C calcined (iv) bandgap of respective TiO2/PMMA composites |
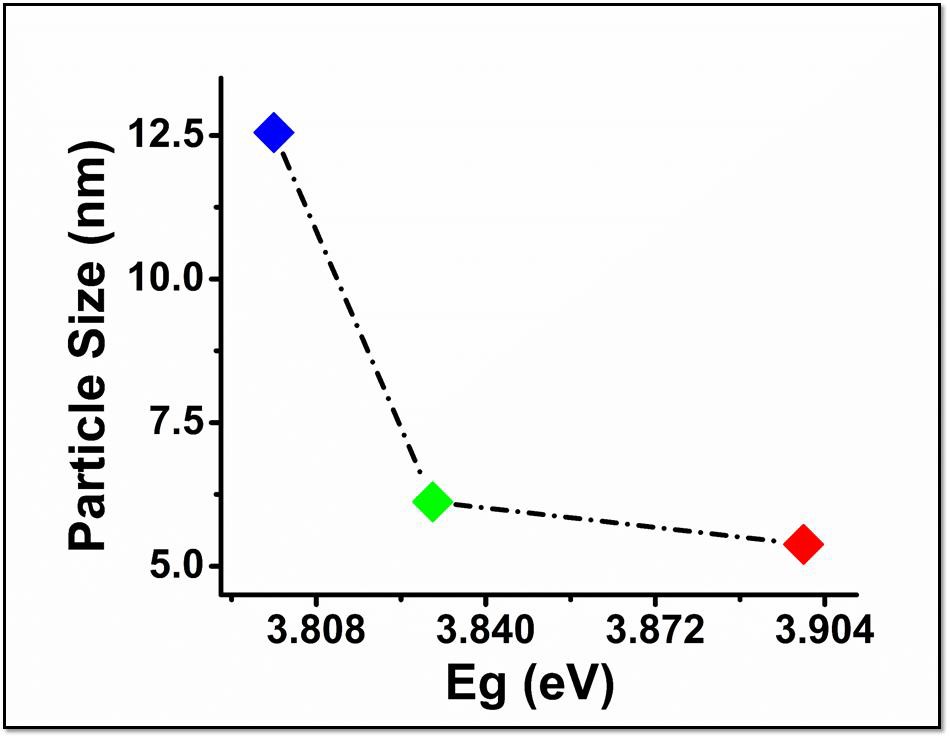 |
| Figure 4: Relationship between Particle Size and band gap |
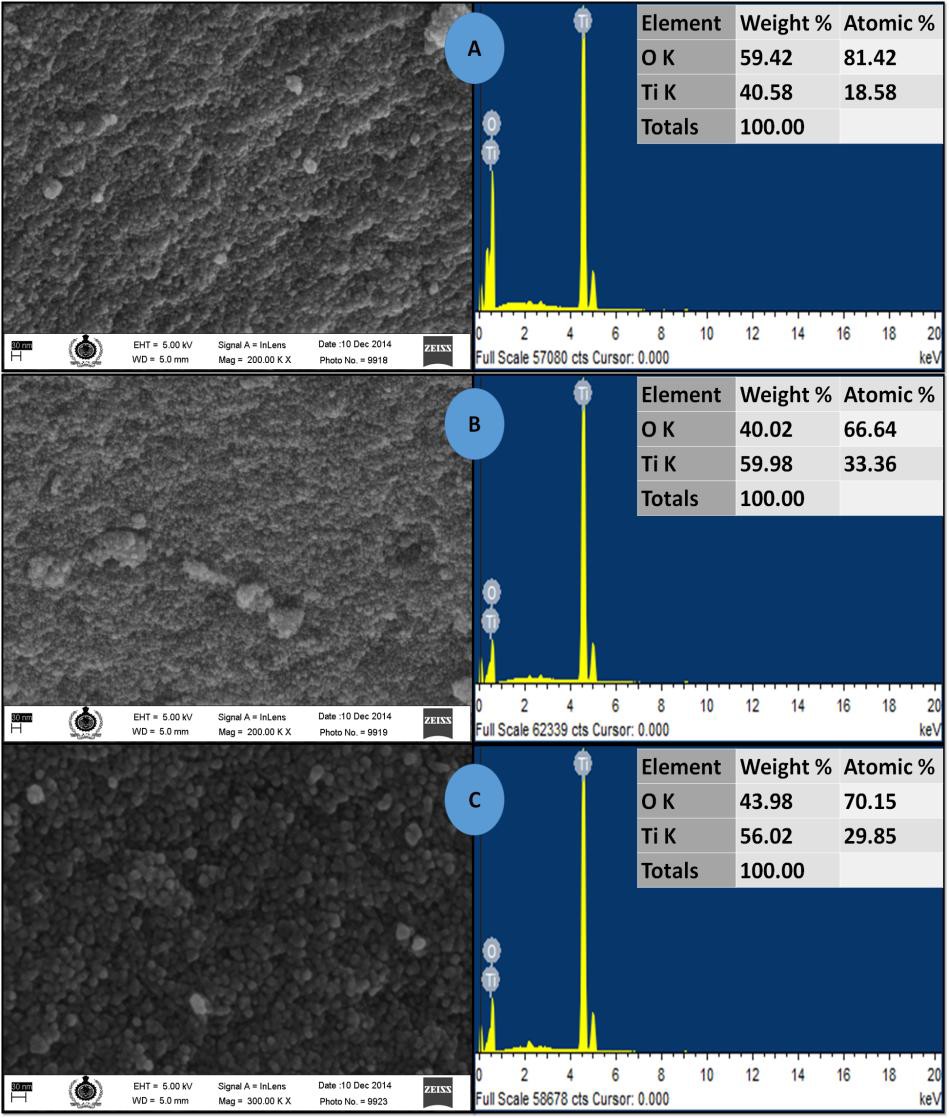 |
| Figure 5: SEM images of (A) as prepared NPs (B) NPs 100 °C calcined (C) NPs 400 °C calcined TiO2 NPs |
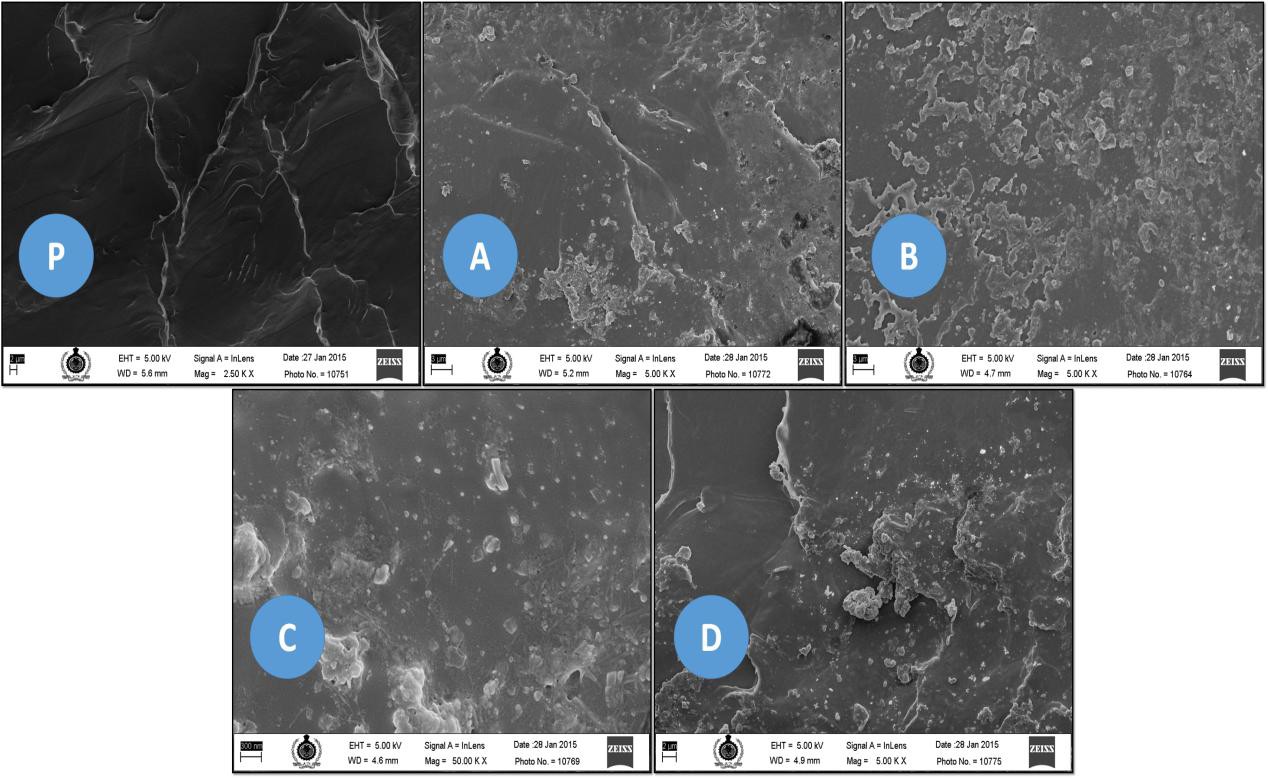 |
| Figure 6: SEM images showing the variation in incorporation of nanoparticles in membranes with concentration (a) pristine b) 0.1% TiO2 100 °C calcined c) 1% TiO2 100 °C calcined d) 0.1% TiO2 400 °C calcined e) 1% TiO2 400 °C calcined |
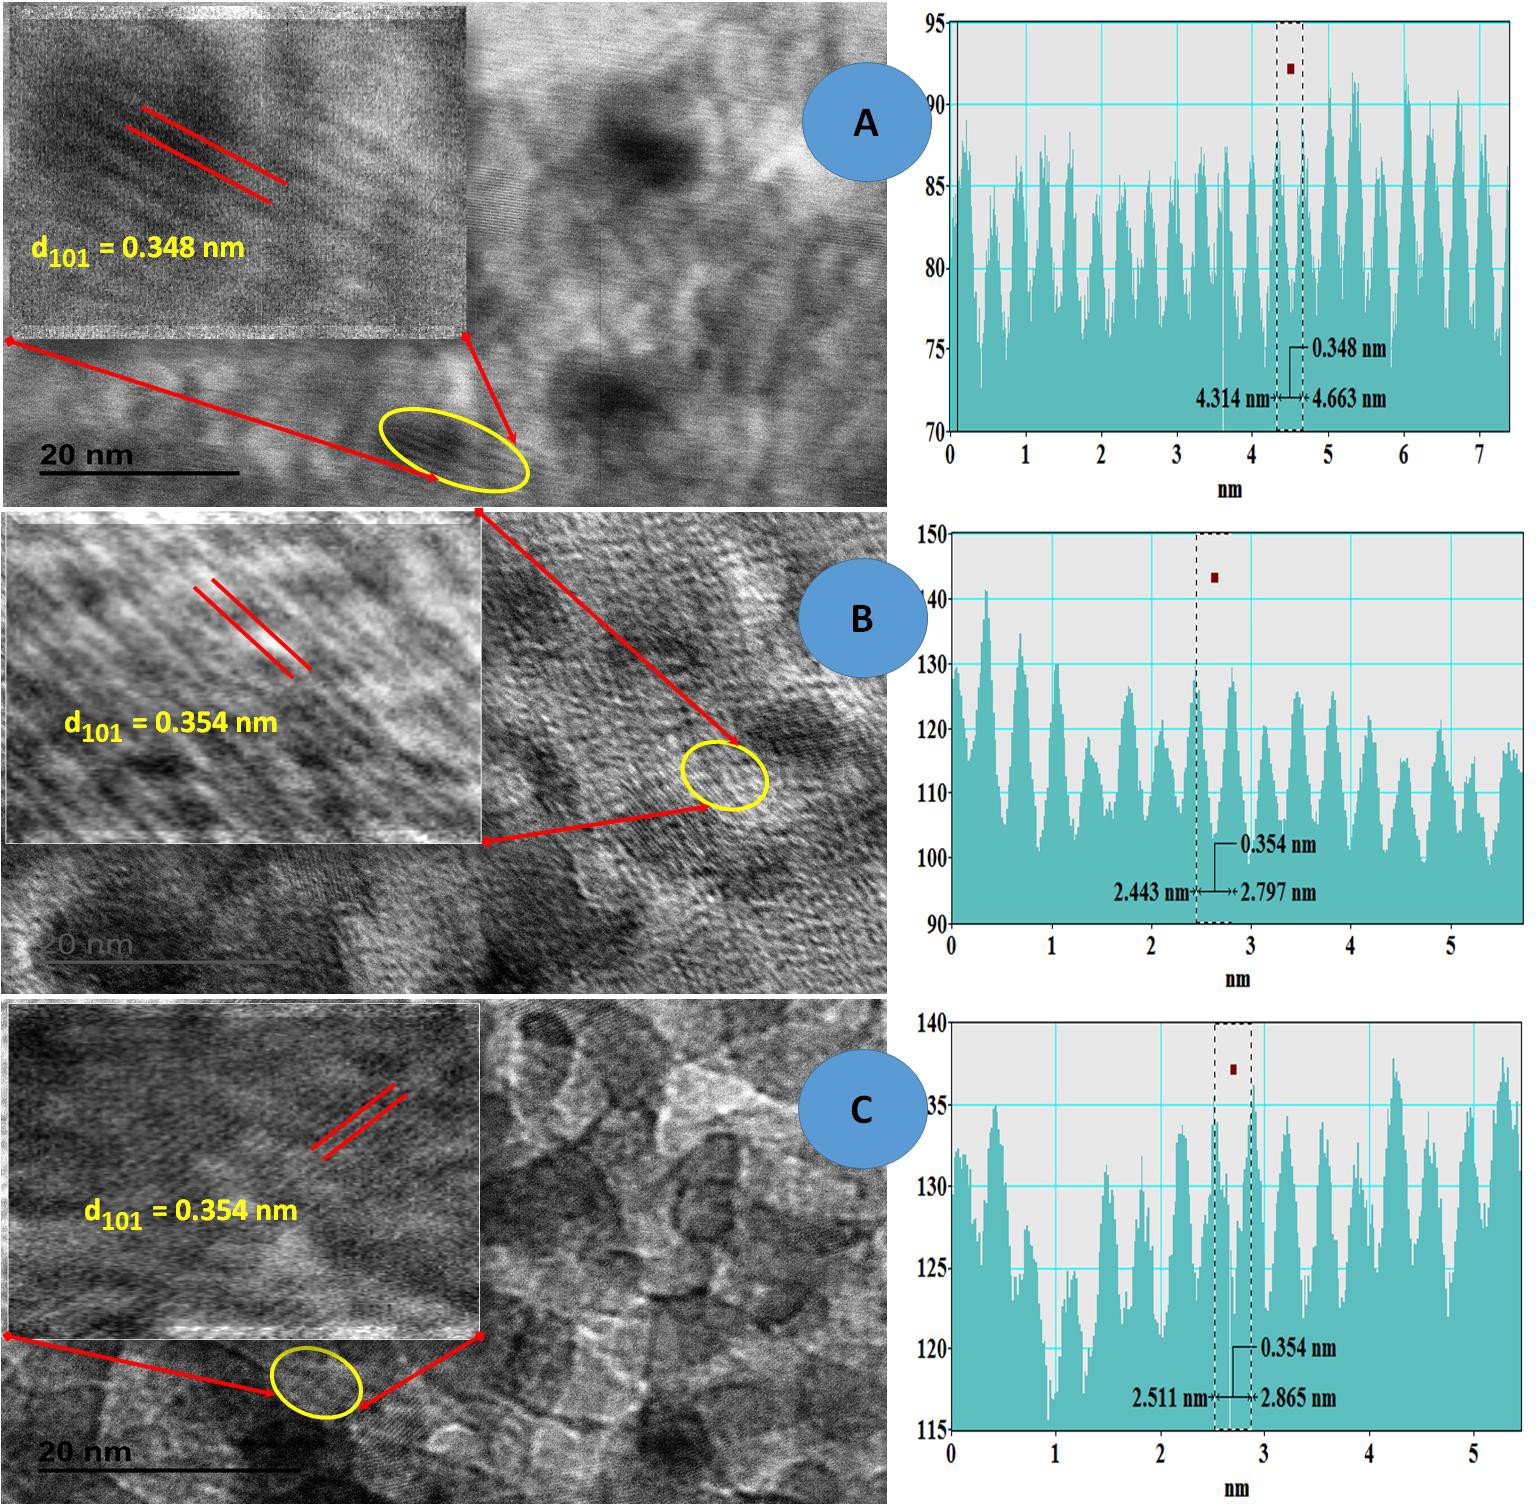 |
| Figure 7: TEM images of as-prepared (a) 100 ° and 400 °C sintered (b,c) NPs with the d-spacing and line plot (L to R) |
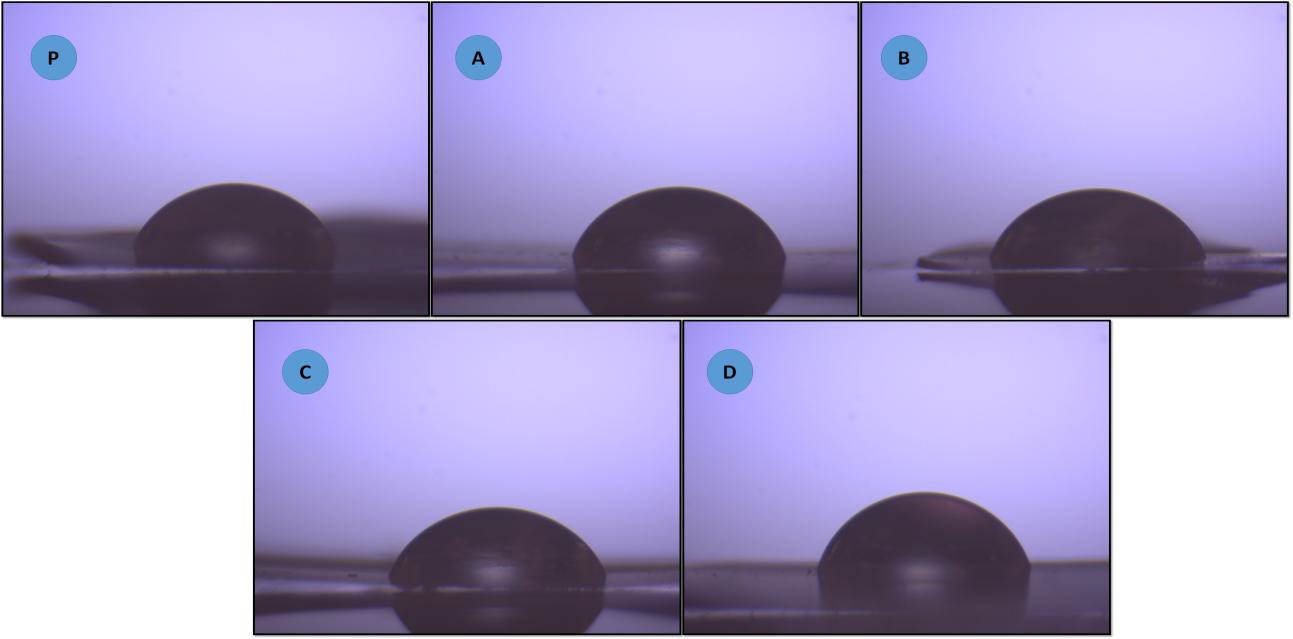 |
| Figure 8: Optical images of water drops on PMMA modified TiO2 porous structures of different porosity (P) pristine (A) 0.1% 100 °C calcined (B) 1% 100 °C calcined (C) 0.1% 400 °C calcined (D) 1% 400 °C calcined |
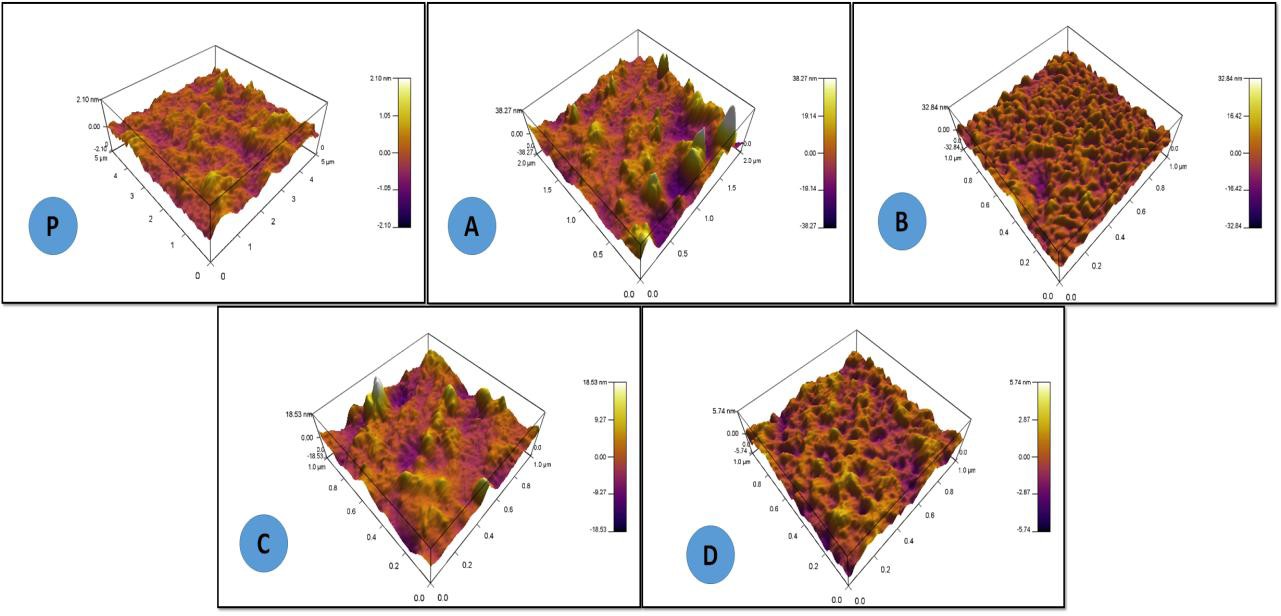 |
| Figure 9: The surface roughness of the membranes calculated using AFM P) Pristine, A) 0.1% TiO2 100 °C calcined, B) 1% TiO2 100 °C calcined, C) 0.1% TiO2 400 °C calcined, D) 1% TiO2 400 °C calcined |
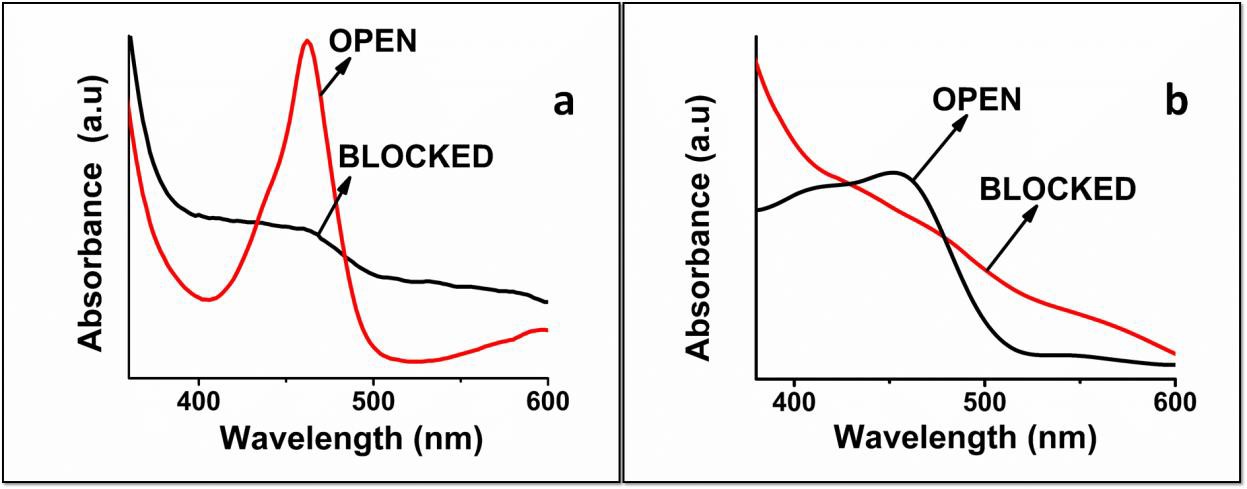 |
| Figure 10: UV spectra of reaction mixture of Ag/PPy recorded (a) after 48h and (b) after 4 weeks |
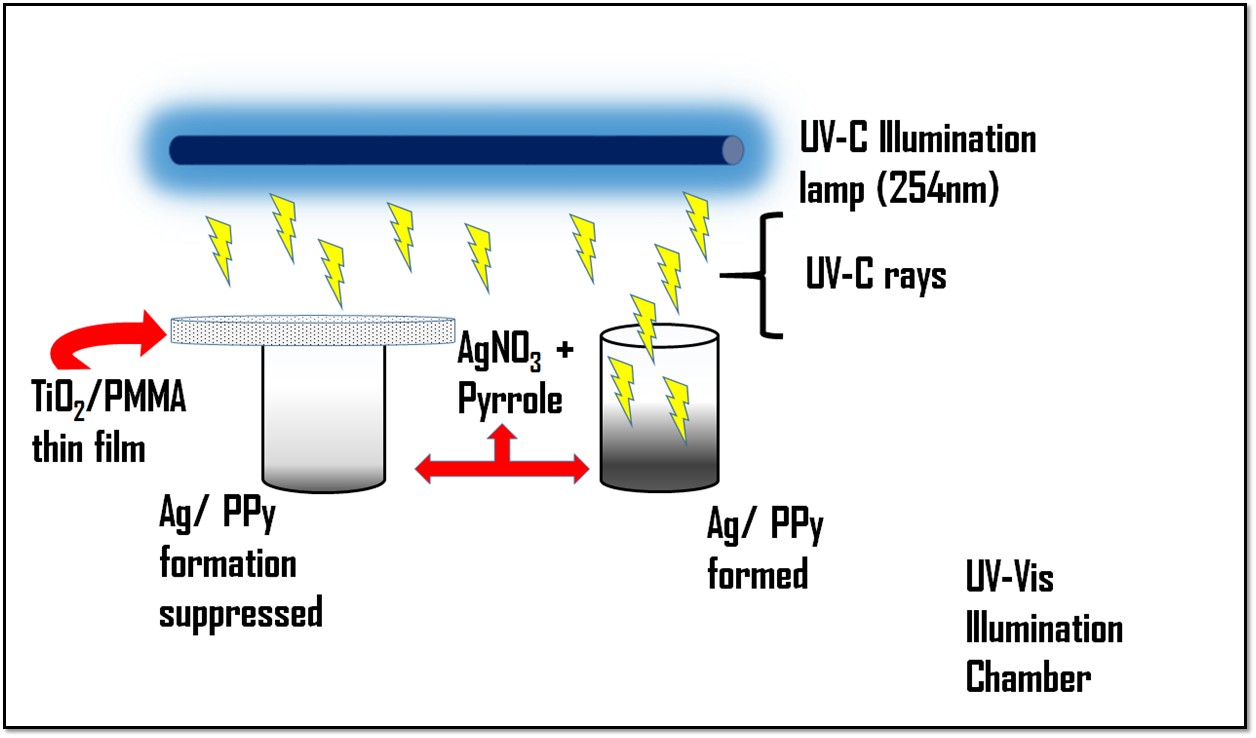 |
| Scheme 2: Schematic representation of photo-polymerization reaction with and without shielding by TiO2/PMMA |
Sample code |
Sample |
Contact Angle (°) |
P |
Pristine PMMA |
66.88 ± 1 |
A |
NC with 0.1% TiO2 calcined @100° |
67.76 ± 1 |
B |
NC with 1% TiO2 calcined @100° |
69.03 ± 1 |
C |
NC with 0.1% TiO2 calcined @400° |
70.57 ± 1 |
D |
NC with 1% TiO2 calcined @400° |
73.24 ± 1 |
| Table 1: Contact angle analysis of TiO2-PMMA | ||
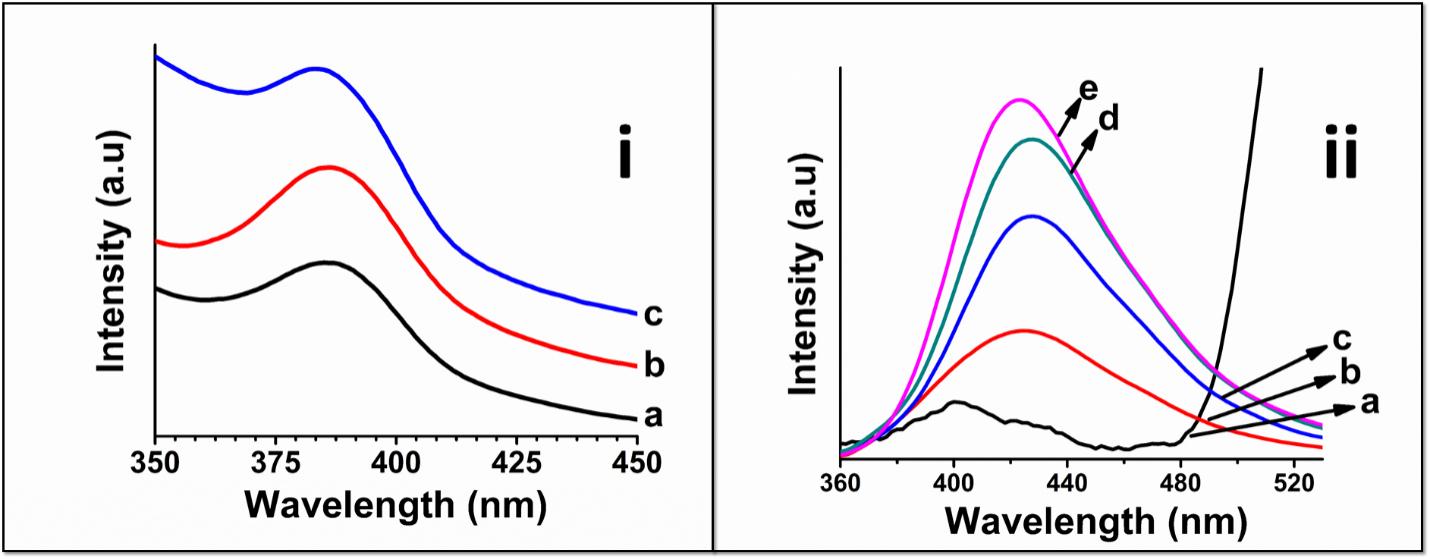 |
| Figure S1, Supplementary Data: [i] Shows the Photoluminescence of TiO2 NPs excited at 340 nm, the as prepared and calcined nanoparticles showing increased intensity with increased particle size; [ii] Photoluminescence spectra of films prepared a) pristine b) 0.1% TiO2 100 oC calcined c) 1% TiO2 100 oC calcined d) 0.1% TiO2 400 oC calcined e) 1% TiO2 400 oC calcined |
 |
| Figure S2, Supplementary Data: Correlation of M2 proteomics with TMT-labeling vs. M2 proteomics with super SILAC-labeling. |
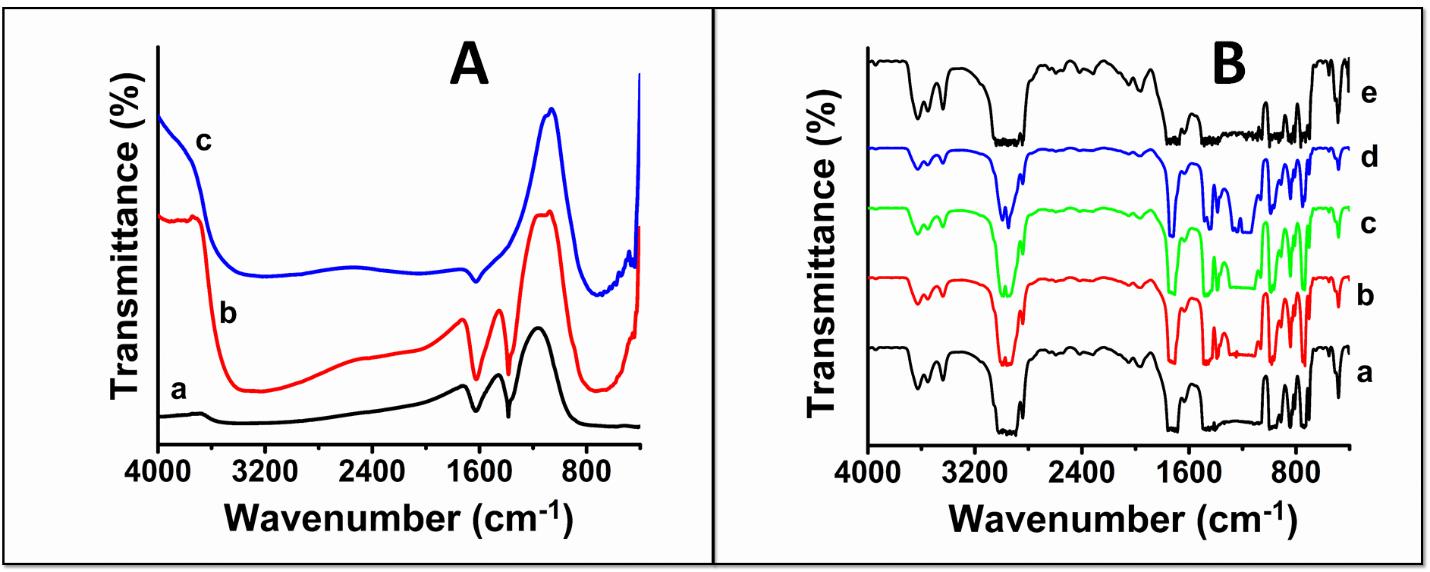 |
| Figure S3, Supplementary Data: FT-IR images of [A] (a) as prepared NPs (b) NPs 100 o calcined (c) NPs 400 o calcined; [B] the films so prepared in comparison with pristine PMMA a) pristine b) 0.1% 100 calcined c) 0.1% 100 oC calcined d) 0.1% 400 oC calcined e) 0.1% 400 oC calcined |
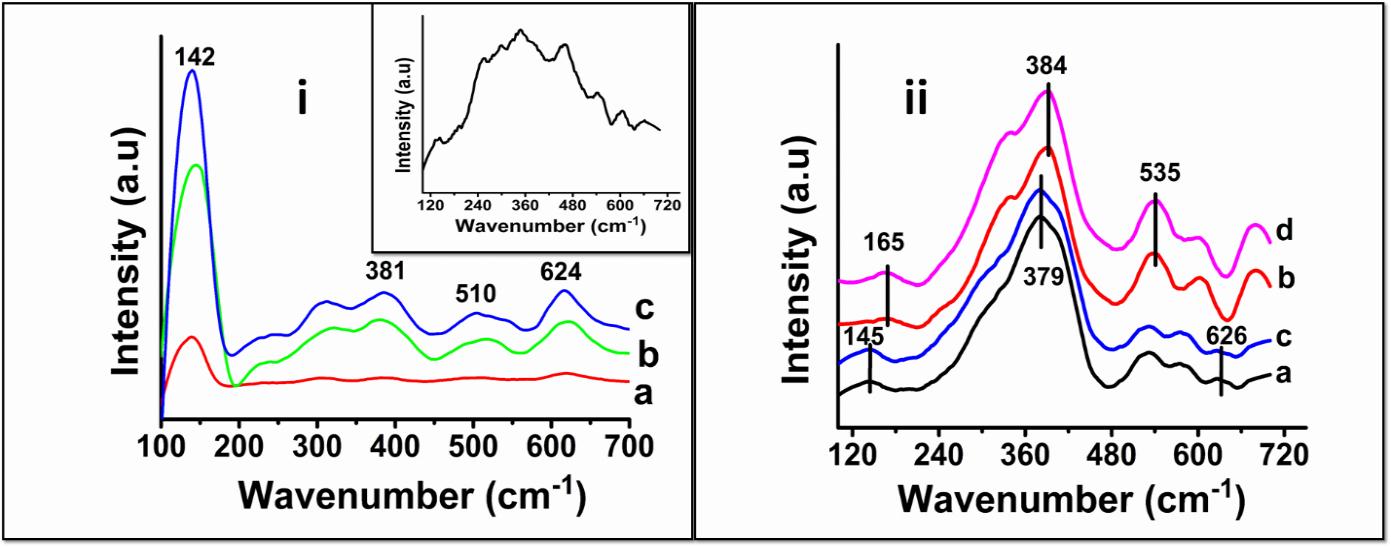 |
| Figure S4, Supplementary Data: Supplementary data: (i) RAMAN spectra of (a) as prepared NPs (138 cm-1) (b) NPs 100 oC calcined (138 cm-1) (c) NPs 400 oC calcined (142 cm-1); (ii) RAMAN graphs of the films so prepared in comparison with pristine PMMA (inset) a) 0.1% 100 oC calcined b) 1% 100 oC calcined c) 0.1% 400 oC calcined d) 1% 400 oC calcined |
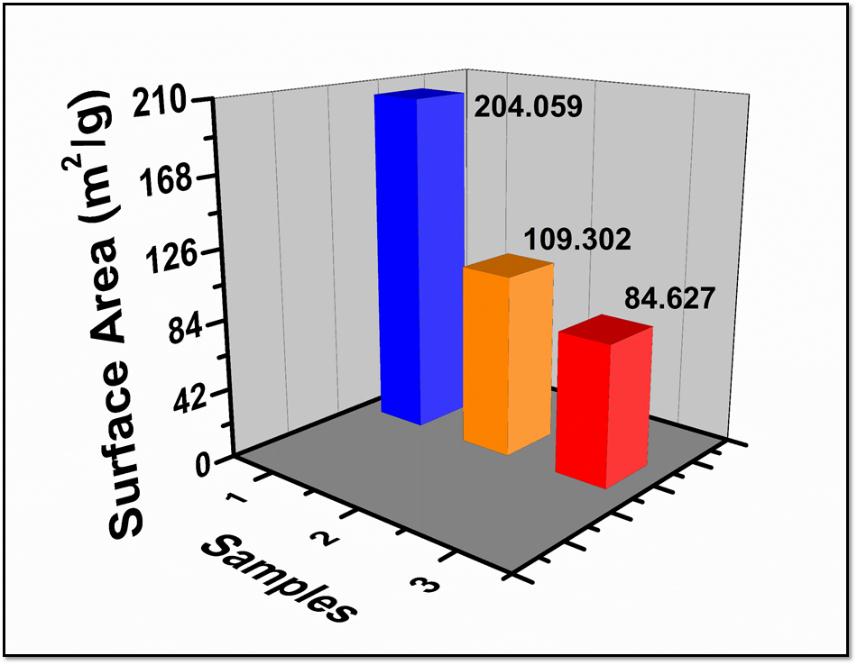 |
| Figure S5, Supplementary Data:
Surface Area with variation in particle size The surface area of the as prepared particles was determined using BET surface area analysis. The measurement revealed that the powder has high surface area of 204.059m2/g for as-prepared powder while the surface area of sintered sample at 100 oC and 400 oC was decreased to 109.302m2/g and 84.627 m2/g respectively. Thus, it can be said that BET surface area decreased with increasing temperature and particle size (Table S3, Figure S5) |
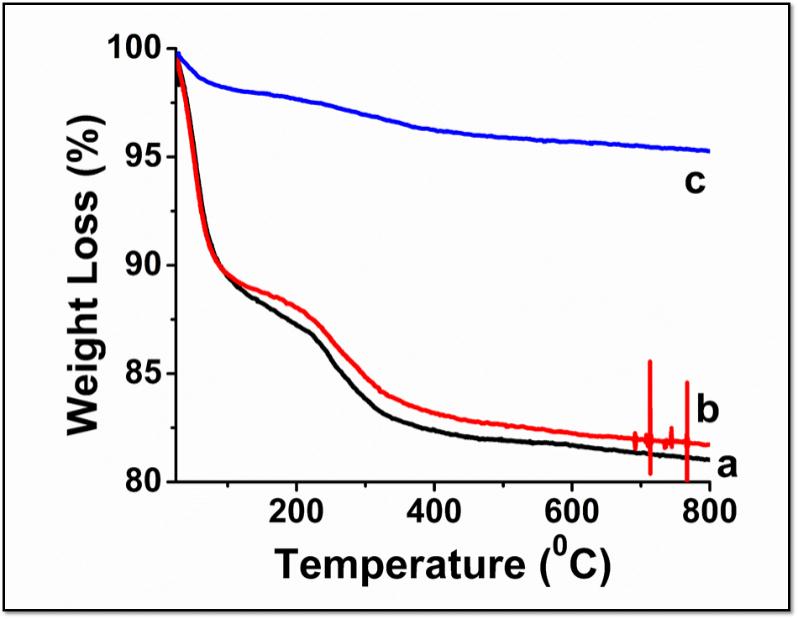 |
| Figure S6, Supplementary Data: TGA graph of (a) as prepared NPs (b) NPs 100 oC calcined (c) NPs 400 oC calcined |
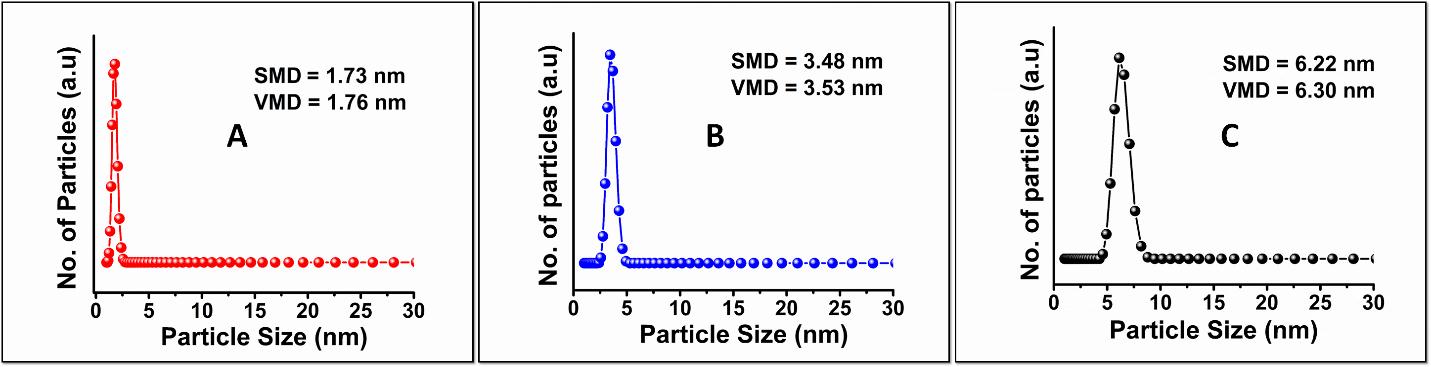 |
| Figure S7, Supplementary Data: Particle Size distribution of as prepared and (A) sintered nanoparticles; [(B) 100 oC; (C) 400 oC] |
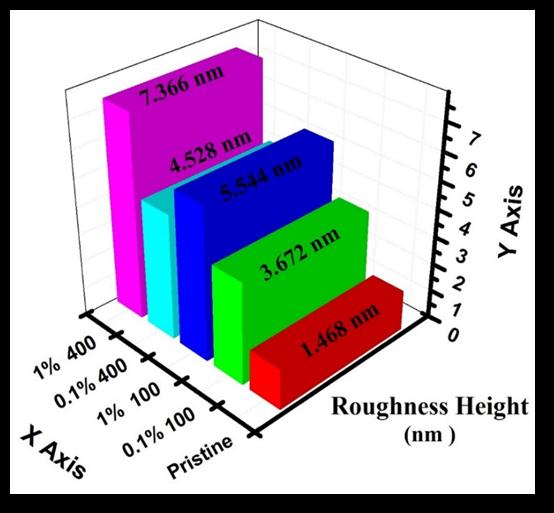 |
| Figure S8, Supplementary Data: Surface roughness with effect to pure polymer surface and doped with titania nanoparticles |
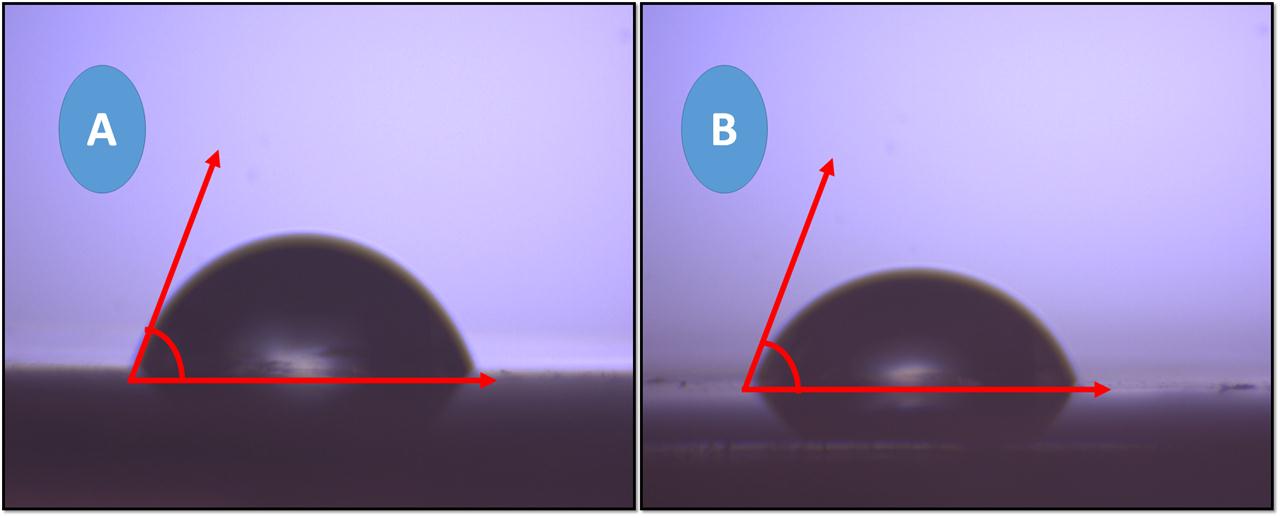 |
| Figure S9, Supplementary Data: Contact angle of the PMMA-TiO2 sheets directly exposed to (A) UVC illumination and (B) Ag/Ppy reaction mixture formation |
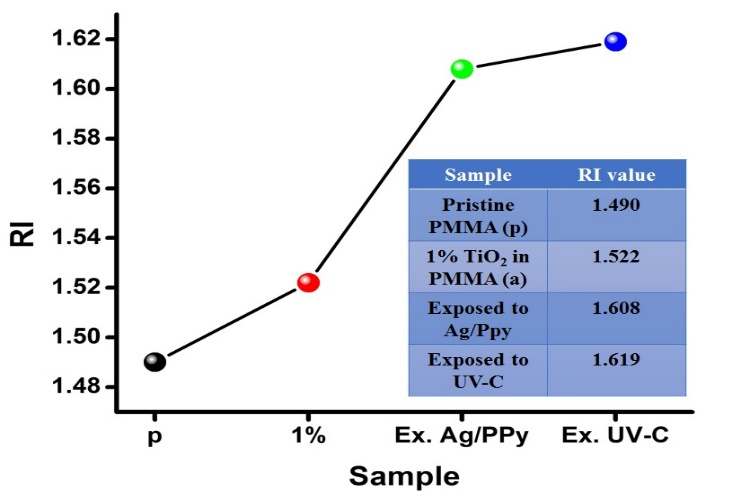 |
| Figure S10, Supplementary Data: Refractive index of the sheets exposed to Ag/Ppy reaction formation and UV-C |
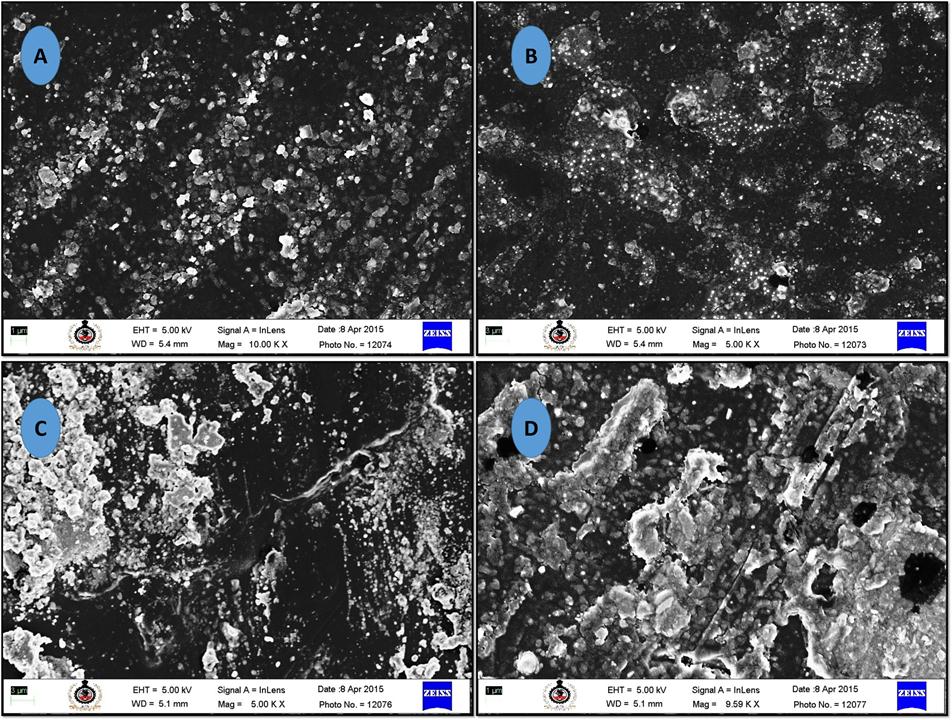 |
| Figure S11, Supplementary Data: (A,B) Sheets exposed to UVC and (C,D) Ag/Ppy |
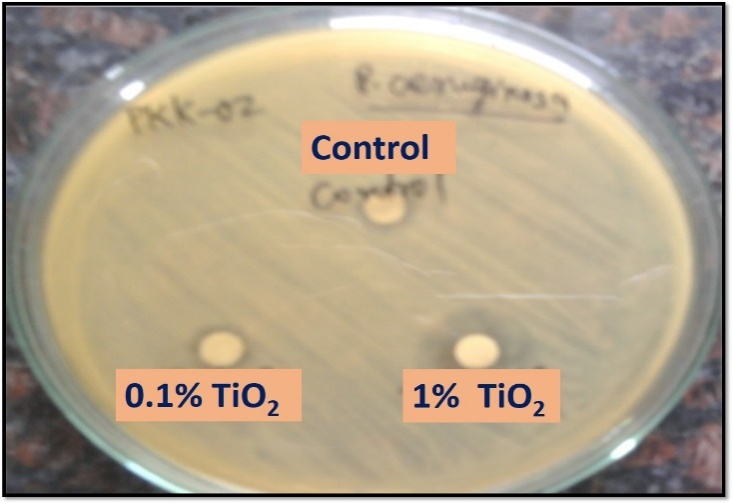 |
| Figure S12, Supplementary Data: Antibacterial activity of TiO2/PMMA nanocomposites |
Sample |
Crystal Planes and Diffraction angle (2Ө o) |
d- spacing
(101) |
Average
Particle Size (nm) |
||||||
101 |
111 |
004 |
200 |
211 |
204 |
220 |
|||
TiO2 (a) |
25.11 |
30.13 |
37.71 |
47.89 |
53.90 |
62.70 |
75.22 |
0.3543 |
5.38 |
TiO2@100 oC (b) |
25.27 |
30.17 |
37.67 |
47.80 |
54.14 |
62.50 |
75.20 |
0.3521 |
6.62 |
TiO2@ 400 oC (c) |
25.49 |
31.00 |
37.69 |
48.32 |
54.51 |
62.52 |
75.35 |
0.3491 |
12.55 |
| Table S1, Supplementary data: XRD peaks (a) as prepared NPs, (b), (c) NPs calcined at 100 oC and 400 oC respectively | |||||||||
Sample |
RI |
PristinePMMA (p) |
1.490 |
Unsintered 0.1% TiO2/PMMA (a) |
1.494 |
0.1% TiO2 100o calcined (b) |
1.497 |
1% TiO2 100o calcined (c) |
1.517 |
0.1% TiO2 400o calcined (d) |
1.498 |
1% TiO2 400o calcined (e) |
1.522 |
| Table S2, Supplementary data: Refractive Index of TiO2/PMMA films | |
Sample |
Specific Surface Area(m2/g) |
Particle Size (nm) |
As prepared |
204.059 |
5.38 |
100o calcined |
109.302 |
6.62 |
400o calcined |
84.627 |
12.55 |
| Table S3, Supplementary data: BET Surface area data | ||
Sample |
Mass Loss (%) |
Particle Size (nm) |
As prepared |
5.45 |
5.38 |
100o calcined |
4.72 |
6.62 |
400o calcined |
2.37 |
12.55 |
| Table S4, Supplementary data: TGA analysis | ||
|
| Figure S1, Supplementary Data: [i] Shows the Photoluminescence of TiO2 NPs excited at 340 nm, the as prepared and calcined nanoparticles showing increased intensity with increased particle size; [ii] Photoluminescence spectra of films prepared a) pristine b) 0.1% TiO2 100 oC calcined c) 1% TiO2 100 oC calcined d) 0.1% TiO2 400 oC calcined e) 1% TiO2 400 oC calcined |
Sample |
Crystal Planes and Diffraction angle (2Ө o) |
d- spacing
(101) |
Average
Particle Size (nm) |
||||||
101 |
111 |
004 |
200 |
211 |
204 |
220 |
|||
TiO2 (a) |
25.11 |
30.13 |
37.71 |
47.89 |
53.90 |
62.70 |
75.22 |
0.3543 |
5.38 |
TiO2@100 oC (b) |
25.27 |
30.17 |
37.67 |
47.80 |
54.14 |
62.50 |
75.20 |
0.3521 |
6.62 |
TiO2@ 400 oC (c) |
25.49 |
31.00 |
37.69 |
48.32 |
54.51 |
62.52 |
75.35 |
0.3491 |
12.55 |
| Table S1, Supplementary data: XRD peaks (a) as prepared NPs, (b), (c) NPs calcined at 100 oC and 400 oC respectively | |||||||||
Sample |
RI |
PristinePMMA (p) |
1.490 |
Unsintered 0.1% TiO2/PMMA (a) |
1.494 |
0.1% TiO2 100o calcined (b) |
1.497 |
1% TiO2 100o calcined (c) |
1.517 |
0.1% TiO2 400o calcined (d) |
1.498 |
1% TiO2 400o calcined (e) |
1.522 |
| Table S2, Supplementary data: Refractive Index of TiO2/PMMA films | |
|
| Figure S2, Supplementary Data: Correlation of M2 proteomics with TMT-labeling vs. M2 proteomics with super SILAC-labeling. |
|
| Figure S3, Supplementary Data: FT-IR images of [A] (a) as prepared NPs (b) NPs 100 o calcined (c) NPs 400 o calcined; [B] the films so prepared in comparison with pristine PMMA a) pristine b) 0.1% 100 calcined c) 0.1% 100 oC calcined d) 0.1% 400 oC calcined e) 0.1% 400 oC calcined |
|
| Figure S4, Supplementary Data: Supplementary data: (i) RAMAN spectra of (a) as prepared NPs (138 cm-1) (b) NPs 100 oC calcined (138 cm-1) (c) NPs 400 oC calcined (142 cm-1); (ii) RAMAN graphs of the films so prepared in comparison with pristine PMMA (inset) a) 0.1% 100 oC calcined b) 1% 100 oC calcined c) 0.1% 400 oC calcined d) 1% 400 oC calcined |
Sample |
Specific Surface Area(m2/g) |
Particle Size (nm) |
As prepared |
204.059 |
5.38 |
100o calcined |
109.302 |
6.62 |
400o calcined |
84.627 |
12.55 |
| Table S3, Supplementary data: BET Surface area data | ||
|
| Figure S5, Supplementary Data:
Surface Area with variation in particle size The surface area of the as prepared particles was determined using BET surface area analysis. The measurement revealed that the powder has high surface area of 204.059m2/g for as-prepared powder while the surface area of sintered sample at 100 oC and 400 oC was decreased to 109.302m2/g and 84.627 m2/g respectively. Thus, it can be said that BET surface area decreased with increasing temperature and particle size (Table S3, Figure S5) |
|
| Figure S6, Supplementary Data: TGA graph of (a) as prepared NPs (b) NPs 100 oC calcined (c) NPs 400 oC calcined |
Sample |
Mass Loss (%) |
Particle Size (nm) |
As prepared |
5.45 |
5.38 |
100o calcined |
4.72 |
6.62 |
400o calcined |
2.37 |
12.55 |
| Table S4, Supplementary data: TGA analysis | ||
|
| Figure S7, Supplementary Data: Particle Size distribution of as prepared and (A) sintered nanoparticles; [(B) 100 oC; (C) 400 oC] |
|
| Figure S8, Supplementary Data: Surface roughness with effect to pure polymer surface and doped with titania nanoparticles |
|
| Figure S9, Supplementary Data: Contact angle of the PMMA-TiO2 sheets directly exposed to (A) UVC illumination and (B) Ag/Ppy reaction mixture formation |
|
| Figure S10, Supplementary Data: Refractive index of the sheets exposed to Ag/Ppy reaction formation and UV-C |
|
| Figure S11, Supplementary Data: (A,B) Sheets exposed to UVC and (C,D) Ag/Ppy |
|
| Figure S12, Supplementary Data: Antibacterial activity of TiO2/PMMA nanocomposites |


