Open Access
Research Article
Max Screen >>
ISSN: 2575-5501
Copyright: © 2016 Torres-Martinez A. This is an open-access article distributed under the terms of the Creative Commons Attribution License, which permits unrestricted use, distribution, and reproduction in any medium, provided the original author and source are credited.
Related article at Pubmed, Google Scholar
Objective and Design: The aim of this project was to evaluate the influence of inflammatory cytokines IL-1β and IL-8 on gastric epithelial-mesenchymal transition in gastric epithelial cells.
Material: Gastric epithelial adenocarcinoma cell line AGS and recombinant IL-1β or IL-8.
Treatment: Confluent AGS cells were stimulated with r rIL-1β or rIL-8 for various periods of time.
Methods: The expression of claudin-4, -5, -6, -7, Cdx2, SNAIL, TWIST, α-catenin, β-catenin, and ERK was analyzed by western blot and immunohistochemistry. ELISA was used to evaluate IL-1 and IL-8 concentration in culture supernatants of treated AGS cells.
Results: AGS cells exposed for 1 or 48 h to 500 pg/ml of rIL-1β secreted dissimilar maximal concentrations of IL-8 (2651 vs 6518 pg/ml, respectively). AGS cells exposed to high rIL-8 concentrations (5800 pg/ml) developed epithelial-mesenchymal transition features such as the hummingbird phenotype and unremitting claudin-4 expression that were associated to increased Cdx2, TWIST, Snail and β-catenin expression, all mediated by the phosphorylation of ERK1/2. EMT features were initially observed in AGS cells treated with 2500 pg/ml of rIL-8; lower rIL-8 concentrations did not induce EMT changes in AGS cells.
Conclusion: Chronic IL-8 mediated inflammation favors epithelial-mesenchymal transition in AGS cells.
Keywords: Claudins; IL-8; Cdx2; Carcinogenesis; ERK
The epithelial-mesenchymal transition is a process in which epithelial cells suffer plasticity changes that confer them an invasive mesenchymal phenotype and metastatic behavior [1]. EMT has been associated with hypoxia inducible factor, transcription factors such as Snail, Slug or TWIST, pro-inflammatory cytokines, transforming growth factor β3, and claudin overexpression or downregulation [2-8].
Chronic inflammation in the stomach due to H. pylori infection or other causes involve the up-regulation of pro-inflammatory cytokine IL-1β [9]. Stomach-specific expression of IL-1β in mice induces gastric inflammation and gastric carcinogenesis [1]. Gastric adenocarcinoma, the second most common cause of death by cancer, exhibit changes in claudin expression during progression to metastatic adenocarcinoma [10]. Altered expression of claudins 4, 6, 7 and 9 in human gastric cancer cells has been associated with higher cancer mortality, invasiveness and poor survival [8,11-13]. Claudin expression is modulated by several transcription factors, including members of the Cdx gene family [14].
Importantly Cdx2 has been associated with gastric carcinogenesis and modified claudin expression [15-17]. Nevertheless, the precise influence of the pro-inflammatory cytokines on claudin expression in gastric carcinogenesis has not been properly assessed. The aim of our work was to evaluate the effect of IL-1β on the cellular mechanism involved on claudin expression on the AGS gastric epithelial cell line. Our results showed that IL-1β induce the secretion of the highly pro-inflammatory cytokine IL-8 by AGS cells and that AGS cells exposed to high IL-8 concentrations activate the ERK1/2 signaling pathway that in turn induces the overexpression of claudin 4 and the epithelial-mesenchymal transcription factors Cdx2, TWIST, SNAIL and β-catenin as well as the transition to the hummingbird phenotype.
Dulbecco’s modified Eagle’s medium (DMEM), Fetal bovine serum (FBS), L-glutamine, sodium pyruvate, insulin, Dulbecco´s Phosphate-Buffered Saline (PBS), streptomycin-penicillin, bovine albumin and rabbit anti claudin-5 and -7 were from Invitrogen (Life Technologies Corp, USA). Mouse anti claudin-4 (GTX-15104) and -6 (GTX-115183) were from GeneTex (Irvine, CA, USA). PD98059 a selective inhibitor of MAPK/ERK kinase was from Enzo Life Sciences (Farmingdale, NY, USA). Rabbit monoclonal anti-human phosphorylated ERK1/2 (Phospho-p44/42 MAPK [Thr202/Tyr204], Cat No 9101) was from Cell Signaling Techn. (Danvers, MA, USA). Goat, rabbit or mouse IgG HRP- conjugated antibodies were from Zymed-Life Technologies (Grand Island, NY, USA). Alexa 488 conjugated goat anti-mouse IgG or donkey anti-rabbit IgG antibodies were from Abcam (Cambridge, MA, USA). Mouse monoclonal anti Cdx-2 (AM392-5M) was from BioGenex (Fremont, CA, USA). Mouse monoclonal anti TWIST (SC-81417) and anti β-catenin (E-5)(SC-7963) as well as rabbit anti α-catenin (H-297)(SC-7894) and rabbit anti Snail (SC-28199) were from Santa Cruz Biotechnology (Santa Cruz, CA, USA). Tween-20, Triton X-100, phosphatase inhibitor cocktail 1 and 2, trypsin inhibitor, leupeptin, aprotinin and beta-actin antibody were from Sigma-Aldrich (St. Louis, MO, USA). Anti-actin antibody was a kind gift of Dr. José Manuel Hernández, CINVESTAV-México. Protein assay kit was from Bio-Rad Laboratories (Hercules, CA, USA). Goat anti mouse/sheep IgG-FITC conjugated (#515-095-003) was from Jackson Immuno Research Lab. (West Grovw, PA, USA). SuperSignal West Dura Chemiluminescent Substrate was from Thermo Fisher Scientific Inc. (Waltham, MA, USA). Recombinant human IL-1β and IL-8, as well as IL-1β and IL-8 ELISA MAX Deluxe sets were purchased from Biolegend Inc. (San Diego, CA, USA).
1x10⁶ human gastric adenocarcinoma cell line AGS cells (CRL-1739, ATCC, USA) were cultured in sterile P-100 Petri dishes with DMEM supplemented with 5% FBS, 1% streptomycin-penicillin solution, 1mmol/L L-glutamine, insulin and sodium pyruvate solution at 37 °C in a humid environment containing 5% CO2, until reaching >90% confluence. Afterwards 8x10105 cells/well were seeded in 6 well Tissue Culture Plates (Biocompare, San Francisco, CA, USA) for 48 h until they reached 95% confluence, that represent 2x10⁶ cells/well. All the experiments were immediately performed with this confluent AGS cell cultures in their third passage. Western blot analysis was performed using 9x10⁶ confluent AGS cells. Human recombinant IL-1β or IL-8 was used to stimulate the AGS cultures. The supernatants of these experiments were collected and kept at -70 ºC until use. All the experiments were performed with AGS cells grown from 2nd passage frozen vials maintained in liquid nitrogen. Results are expressed as the mean of three different experiments.
IL-1β and IL-8 concentration was determined by ELISA in supernatants of 1x10⁶ AGS cell cultures in sterile P-100 Petri dishes that had reached a 95% confluence. The ELISA MAX kits were from Biolegend´s (San Diego, CA, USA) and the detection procedure was performed following the manufacturer´s instructions. The plates were read in a BioTek ELx808 (BioTek U.S., Winooski, VT, USA).
Confluent AGS cells were incubated in non-supplemented FBS DMEM for 12 h and then incubated with the ERK 1/2 inhibitor PD98059 (100 uM) for 1 h before adding different recombinant human IL-8 (100-3800 pg/ml) for selected time periods (1, 2, 4, 6, 8, 12 h). Cells treated for 3 h with human recombinant epithelial growth factor (hEGF; 100ng/mL, Life Technol Corp, USA) were used as pERK1/2 activation control.
Cells were scrapped from the plates with lysis buffer (50mM Tris-HCl, 150mM NaCl, 0.1% SDS, 1% sodium deoxycholate, pH 7.6) supplemented with 0.5% of phosphatase inhibitor cocktail 1 and 2, 1mg/ml trypsin inhibitor, 2μg/ml leupeptin and 2μg/ml aprotinin (Sigma-Aldrich, USA). Cells were sonicated for 1 min before protein concentration was determined. For Western blot analysis 20 μg of protein was resolved on 12% SDS/PAGE and transferred to nitrocellulose membranes in a Bio-Rad semi-dry blotting system for 1 h at 120 mA. Membranes were blocked with 5% non-fat dry milk in Tris-buffered saline (TBS) for 1 h, washed twice with TBS and incubated with primary anti- claudin, -Cdx-2, -Snail, -TWIST, -β-catenin or –α-catenin (1:500) antibody diluted in Tween 20/TBS (TTBS) overnight at 4 °C. Membranes were washed with TTBS, and incubated with horseradish peroxidase labelled secondary antibodies diluted 1:500 in TBS for 2 h at room temperature. To evaluate pERK1/2 the primary antibody was used at a 1:500 dilution. PD98059 was used at 100uM. After these processes membranes were washed thrice with TTBS and once with TBS before antibody binding was detected by chemiluminiscence. Equal protein loading was confirmed in all the experiments by determining β-actin as loading control. All experiments were run in triplicate.
The differences in claudin or Cdx-2 expression in the cell membrane were determined with images obtained from the chemiluminiscence sheets using the MiniBis Pro (DNR Bio-Imaging Systems, Jerusalem, Israel) and analysed using DNR GelQuant software that calculates the intensity of the gel band measuring the amount of pixels/sq.in. The values for the basal and post-treatment results were determined for each band. The results are expressed as mean intensity.
1x10⁶ AGS cells were seeded in 2x2 cm sterile glass covers, placed in 6 well culture plates (one cover per well) and cultured with DMEM supplemented with 5% FBS, 1% streptomycin-penicillin solution, 1mmol/L L-glutamine, insulin and sodium pyruvate solution at 37 °C in a humid environment containing 5% CO2 until confluence. Cells were collected, washed three times in PBS and incubated with 3,800 pg/ml of human rIL-8 in DMEM for 1, 2, 4, 6, 8 and 12 h periods. Cells were then washed thrice with cold PBS before adding 4% paraformaldehyde for 2 h at 4 ºC. Afterwards, cells were washed and permeabilized with 500 ul of 0.1% Triton X-100 in PBS for 10 m at room temperature. After extensive washing, cells were incubated with 2% albumin in PBS for 30 m before extensive washing with PBS/0.05% Tween 20. Cells were then incubated overnight at 4 ºC, with anti Cdx2 monoclonal antibody 1:500 in PBS/1% albumin, washed with PBS/0.05% Tween-20, incubated 1 h with the FITC-conjugated secondary antibody (1:500 in PBS/1% albumin), washed with PBS/0.05% Tween-20, and counterstained with 25 μl of Vectashield/DAPI, before being analysed and photographed with a Leica System model TCSSP5 confocal microscope.
All experimental results are expressed as the mean ± standard deviation of the mean. Student’s t-test analysis was used to evaluate differences between groups using Sigma Plot v.11 software. Differences were considered to be significant for p < 0.05 values.
Culture supernatants of AGS cell cultures pre-incubated for 1 h with 500 pg/ml of rIL-1β showed an initial increase in IL-8 concentration (296 pg/ml) after 30 min that reached its peak after 6 h (2651 pg/ml) (Figure 1). Culture supernatants of AGS cells pre-incubated for 48 h with 500 pg/ml of rIL-1β showed a very strong basal concentration of IL-8 (6518 pg/ml) that exhibited a slow but continuous time-related decrease as demonstrated by the values determined after 6 h (4813 pg/ml). Control supernatants of non IL-1β-stimulated AGS cells showed a maximal IL-8 value of 58 pg/ml after 4 h of culture, the remaining values in all time lapses were below 50 pg/ml. The difference in IL-8 concentration in all time intervals and in both experimental settings was statistically significant (p < 0.01).
To analyze the possible effect of IL-8 on claudin expression, AGS cells were first incubated with 50 pg/ml of rIL-8 for various periods of time. Figure 2 summarizes the results. Claudin-4 expression decreased by 18,7% after 4 h exposure in comparison with the basal value (p < 0.05) but there was a slow return to basal levels after 12 h. The expression of claudin-5 and -6 was not modified. Claudin-7 expression showed a transitory increase in the first hour of exposure (p < 0.05) but returned to basal values after 2 h.
As expected as rIL-8 concentration was increased (from 50-pg/ml to 3800-pg/ml) there was a significant increase (p < 0.05) in claudin-4 expression that began to be noticeable from the 200-pg/ml concentrations. The differences in the expression of claudin-5, -6, and -7 were not statistically significant throughout the evaluation period (Figure 3).
Claudin-4 expression is known to be regulated by the transcription factor Cdx2, therefore we investigated the effect of IL-8 on Cdx2 expression [16]. Our results showed that low IL-8 concentration (50 pg/ml of rIL-8) did not induce an increase in the expression of Cdx2 in AGS cells, whereas high IL-8 concentration (3800 pg/ml) increased Cdx2 protein expression by 120% in contrast to the constitutive level. The increased expression of Cdx2 was nearly abolished in the presence of the MEK inhibitor PD98059 (Figure 4A) at the same concentrations that induced a complete abolishment of ERK1/2 expression (Figure 4B). Confocal microscopy corroborated the differences observed in AGS cells incubated with low and high rIL-8 concentrations (Figure 5A and B, respectively). The inhibition upstream of the ERK1/2 signaling pathway was accompanied by a significant decrease (87%) in Cdx2 expression. Interestingly, AGS cells incubated with 500 pg/ml rIL-1b did not express Cdx2 at any time (Figure 5C).
Activation of Cdx2 enhanced claudin-4 expression through the ERK1/2 signaling pathway. High human rIL-8 concentration induces an increase in claudin 4. Although Western blot analysis demonstrated the persistence of claudin-4 throughout the 12 h period (Figure 6A), confocal microscopy (Figure 6B) showed that claudin-4 expression started to diminish after 8 h. Interestingly, claudin-4 is not over-expressed after co-stimulation of IL-8 and inhibitor; the expression of claudin-4 in the presence of the MEK inhibitor PD98059 decreased, by a mean 70% value, after 12 h.
High (3800 pg/ml) rIL-8 concentrations induced the overexpression of other important EMT-associated transcription factors (Figure 7). TWIST increased its expression in AGS cells after 1 h and remained elevated for other 4 h. The overexpression of Snail was evident after 1 h and lasted for 8 h, similarly to b-catenin. The expression of Snail was completely abolished by the MEK inhibitor PD98059 whereas that of TWIST and b-catenin decreased by 70% and 86%, respectively. As expected, interleukin 8 had no effect on a-catenin expression whereas PD98059 increased significantly its expression. Confocal microscopy corroborated the increased expression of TWIST, Snail, b-catenin and a-catenin (Figure 8).
Compatible with the phenotypic modification associated with the EMT process, we observed that an important number of AGS cells exposed to high (3800 pg/ml) rIL-8 concentrations acquired the hummingbird phenotype (Figure 9A-D) after 4 h of continuous exposure to the cytokine. Interestingly, the inhibition of the MAPK/ERK pathway in AGS cells exposed to high rIL-8 concentrations and maintained in culture for 4 h, obliterated the formation of the hummingbird phenotype (Figure 9E-F), although the normal cell phenotype was not retained. These results endorse the importance of this kinase pathway in cellular transformation.
Epithelial barrier function requires normal expression of tight junction (TJ) proteins, when the TJ structure looses cohesion there can be invasiveness by transformed cells [18]. Claudins are the major membrane TJ proteins and exhibit tissue-specific expression. In order to establish a possible link between inflammatory cytokines and claudin-related cancer development, we evaluated the effect that high concentrations of recombinant IL-1β and IL-8 could have on claudin expression in AGS cells. IL-1β induces synovial cells, macrophages and human breast cancer cells to secrete IL-8 [19,20]. The continuous and long-lasting presence of IL-1β in the gastric adenocarcinoma AGS cells culture induced a substantial secretion of IL-8 by AGS cells. The relevance of this result is highlighted by the fact that in IL-1β-expressing transgenic mice, gastritis progresses to gastric cancer and that IL-1β alter TJ barrier in diverse and non-gastric related epithelial cells [21-23]. In the particular case of gastric cancer, where H. pylori is recognized as a serious risk factor, several H. pylori virulence factors are involved in a complex pro-inflammatory signaling cascade that includes the activation of the ERK/MAPK pathway strongly involved in the regulation of claudin expression and in IL-1β and -8 production [24].
The results showed that only claudin-4 was overexpressed as a result of the exposure to IL-8 concentrations that resemble those of a chronic inflammatory response. There was a qualitatively different effect of high versus low IL-8 concentrations on claudin-4 expression. The differences we observed in relation to the concentration of IL-8 response by AGS cells are in complete agreement with Mustapha, et al. results which describe that freshly obtained gastric epithelial cells versus AGS cells show qualitatively differences in cytokine and chemokine expression [especially CXCL8] [25]. Interestingly, IL-8 amplifies the NF-kB and MAPKs signaling pathways and it has been clearly associated with cancer development [26,27].
Claudin-4 overexpression is associated with epithelial-mesenchymal transition, a process associated with the Snail transcription factor that contributes to malignancy and regulates interleukin-8 expression [28,29]. Our results demonstrated that high IL-8 concentration also induced the expression of Snail and Twist, potent repressors of E-cadherin expression and other clearly associated epithelial-mesenchymal transition transcription factors such as β-catenin, and that their increase was associated to the ERK/MAPK pathway [3,30]. α-catenin expression traduces the activation of the cancer associated Wnt signaling pathway whereas TWIST is also known to induce rapid dissemination of cytokeratin-positive epithelial cells [31,32]. The transitory increase of expression of TWIST expression only 1 h of stimulation with IL-8 has been observed in breast cancer cell lines exposed to TGFβ [33]. The increase in α-catenin expression when the ERK pathway was inhibited is in accordance with the mechanisms known to favor the ensemble of cell junctions. The qualitative differences that we observed in claudin expression in AGS cells exposed to high IL-8 concentrations might be the consequence of “inflammatory stress” that affects transcriptional activation and protein folding, specially in chronic inflammatory processes [34,35]. Certainly this possibility requires further analysis.
Cell differentiation, especially that of the epithelium, is a highly dynamic system that involves cell generation. p38 MAPKs has emerged as key modulator of cell differentiation processes; this kinase regulates the homeobox transcription factor Cdx2, and in mammals it is inducible by inflammatory cytokines and stress [36-38]. Cdx2 is a gastrointestinal-specific transcription factor highly expressed in multistage tissues of dysplasia and cancer [39]. It has always been assumed that Cdx2 expression was only regulated by the inflammatory cytokine interleukin-6 via an ERK-dependent manner but it has recently emerged that H. pylori CagL that regulates IL-1b production via TLR2 also induce Cdx2 expression in the gastric mucosa [40-42]. Our results showed that interleukin-8, another pro-inflammatory cytokine also regulate Cdx2 but, contrary to IL-6 that regulates claudin-2 expression, interleukin-8 regulated claudin-4 expression. The overexpression of claudin-4 is associated to endometrial tumorigenesis, epigenetic de-repression in gastric carcinoma, and ovarian and renal cancer progression [43-46]. Despite the controversy, the role of interleukin 8 in EMT remains the subject of speculation; we believe that our results fit into the current concept of EMT as a process that can be broken in several functional modules, independently regulated and directly affecting cell phenotype [47,48].
Our results also showed that AGS cells exposed to high concentrations of interleukin-1 and -8 diminished claudin-7 expression. Claudin-7 inhibits cell migration through inhibition of the ERK/MAPK pathway so the diminished expression we observed could be associated with enhanced migration ability [49].
A change in AGS cells morphology corroborated TJ modifications induced by IL-8. As it has already been shown, we also observed the hummingbird phenotype in AGS exposed to high IL-8 concentrations [50]. Our results also showed that the induction of the IL-8-induced hummingbird phenotype of the AGS cells was partially abolished when the MAPK/ERK kinase mediated pathway was inhibited with a specific inhibitor. The activation of the ERK pathway in epithelial cells induce phenotypic changes characterized by loss of apical-basal polarity and cell scattering that requires remodeling of actin cytoskeleton [51,52]. Similarly it has been reported that H. pylori pathogenicity island CagA induces the production of IL-8 and disrupts scaffolding proteins and cell polarity, compromising cell architecture and giving rise to the so-called “scattering/hummingbird” phenotype associated to epithelial-mesenchymal transition [1,50,53]. Our results strongly suggest that actin reorganization and loss of epithelial characteristics associated to invasive pseudopodia resembling those seen in epithelial-to-mesenchymal transition is mediated by IL-8 via the MAPK/ERK pathway [54,55]. ERK1/2 activation induces the expression of genes encoding cell cycle regulatory proteins associated to cell proliferation [56].
Our results demonstrate that a AGS cells exposed to high concentrations of the proinflammatory cytokine IL-8 activates the expression of the Cdx2 transcription factor via the ERK1/2 signaling pathway, and consequently claudin-4, SNAIL, TWIST and β-catenin expressions, all of which play a significant role in the initiation of the epithelial-mesenchyme neoplasm transition. Our results underline the notion that carcinogenesis is the consequence of the uninterrupted micro environmental presence of inflammatory cytokines.
All authors participated in the design, interpretation of the studies and analysis of the data and review of the manuscript; TMA, CC, GVF and MRF conducted the experiments, RHE and MLF wrote the manuscript. Supported by grants 177678-Conacyt, IN-210813 and IN-211113-PAPIIT-UNAM. The authors thank Mrs. Maria José Gómara Herrera for technical assistance. This paper constitutes a partial fulfillment of the Graduate Program in Biomedical and Biological Sciences of the National Autonomous University of Mexico (UNAM) for Ms. Ana Torres-Martinez and Mr. Christian Chavarria both of which acknowledge the scholarship and financial support provided by the National Council of Science and Technology (CONACyT), and UNAM, Mexico. Buffington´s S.A. de C.V., México, supports Mr. Francisco Gallardo-Vera.

![]()

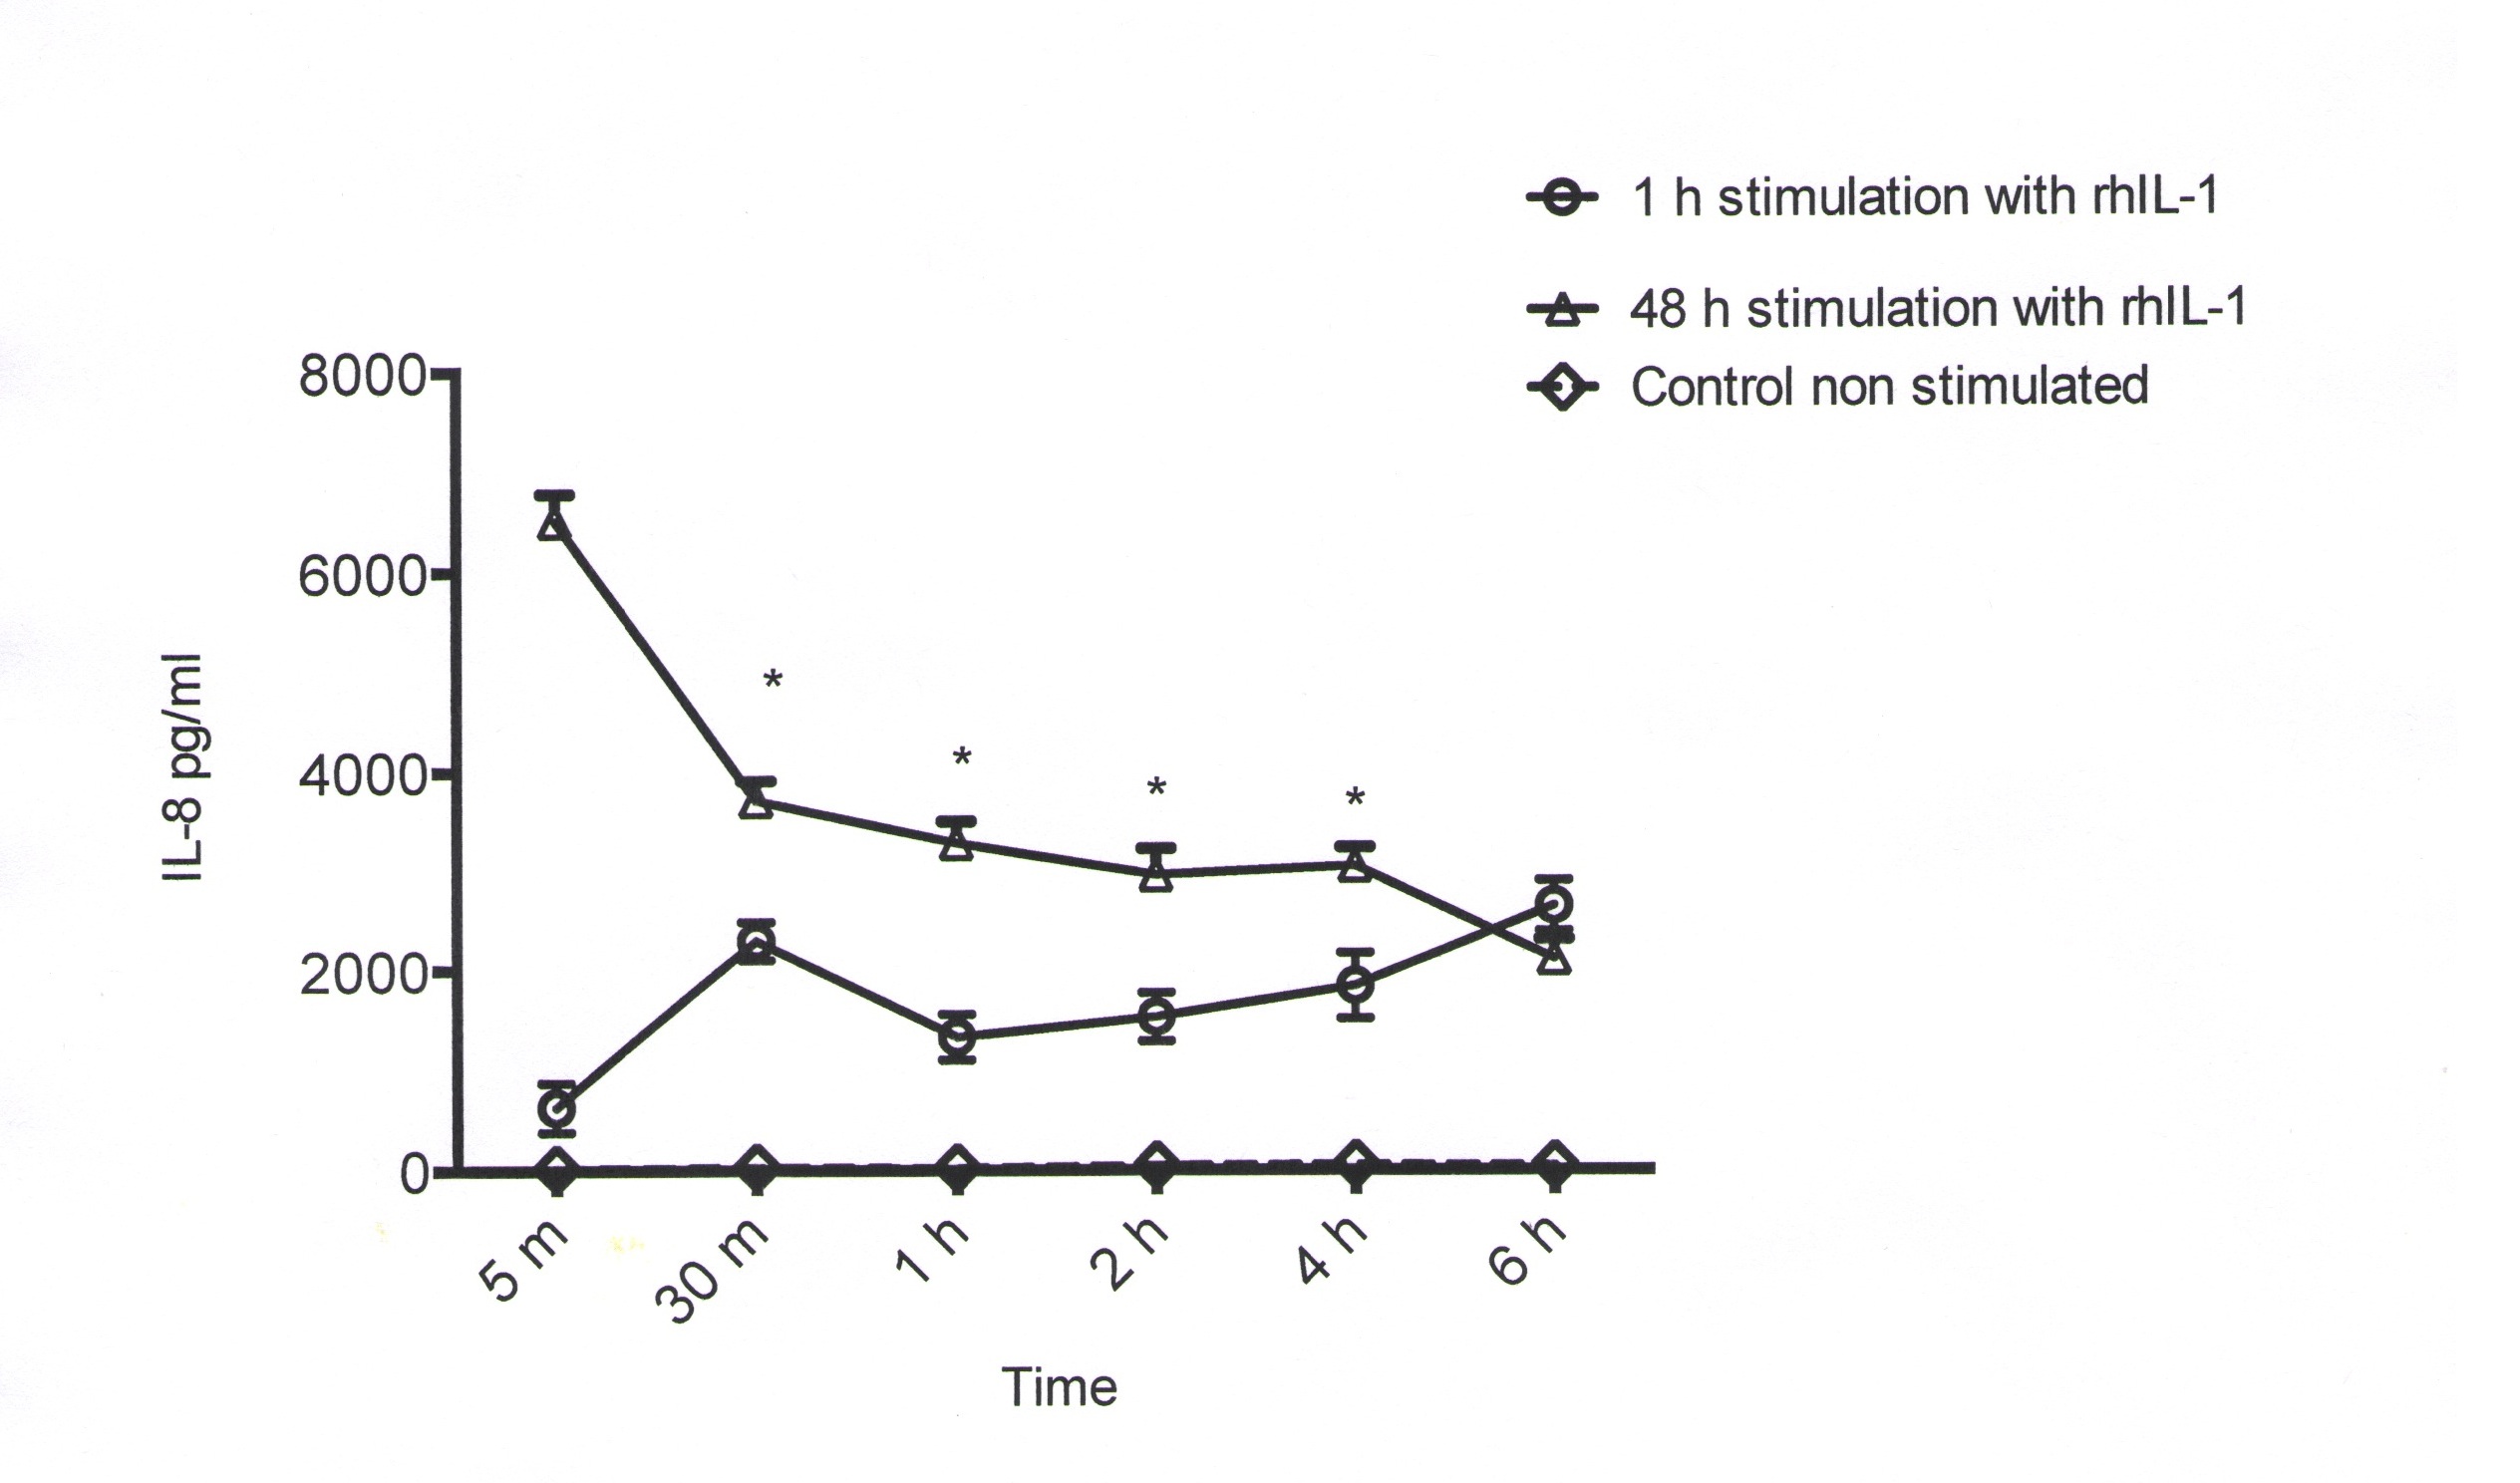 |
Figure 1: Interleukin-8 secretion by AGS cells pre-incubated with rIL-1β for 1 and 48 h. Histogram represents the mean value ±SD of the triplicate experiments at the different experimental times. The difference in IL-8 concentration in all the time lapses and in both experimental settings was statistically significant (p < 0.01) |
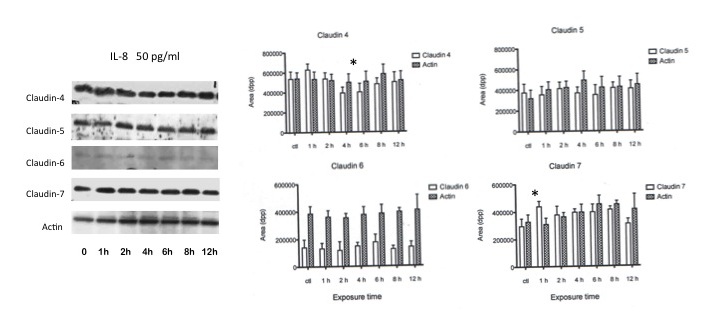 |
Figure 2: Effect of low dose recombinant IL-8 stimulation on AGS cells claudin expression. Representative image of the Western blot expression of the claudins evaluated in AGS cells. The image´s right hand histograms represent the mean intensity values ±SD of the densitometry analysis performed in triplicate experiments at the different experimental times. Actin was used as control. * p < 0.05 |
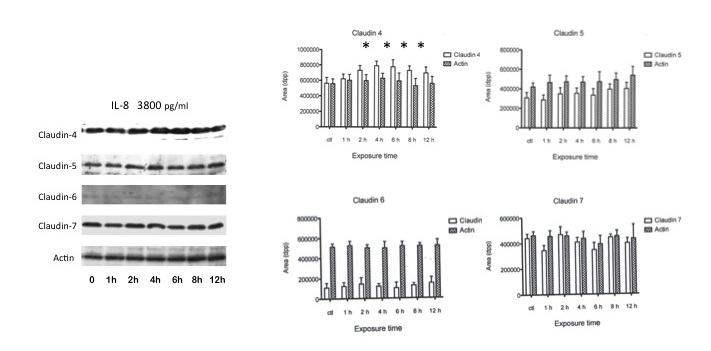 |
Figure 3: Effect of high dose recombinant IL-8 stimulation on AGS cells claudin expression. Representative image of the Western blot expression of the claudins evaluated in AGS cells. The image´s right hand histograms represent the mean intensity values ±SD of the densitometry analysis performed in triplicate experiments at the different experimental times. Actin was used as control. * p < 0.05 |
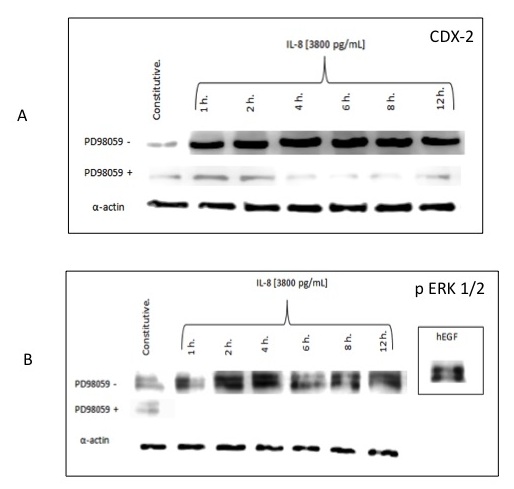 |
Figure 4: A) Western blot analysis showing the expression of Cdx2 in AGS cells treated with high dose recombinant IL-8 concentration, in the presence or not of the MEK inhibitor PD98095. B) Western blot analysis showing the expression of pERK 1/2 in AGS cells treated with high dose recombinant IL-8 concentration, in the presence or not of the MEK inhibitor PD98095; the image in the right hand side of the figure – positive control- shows that the expression of pERK 1/2 in AGS cells treated with hEGF was not abolished by the presence of the MEK inhibitor. Results represent the mean of three different experiments |
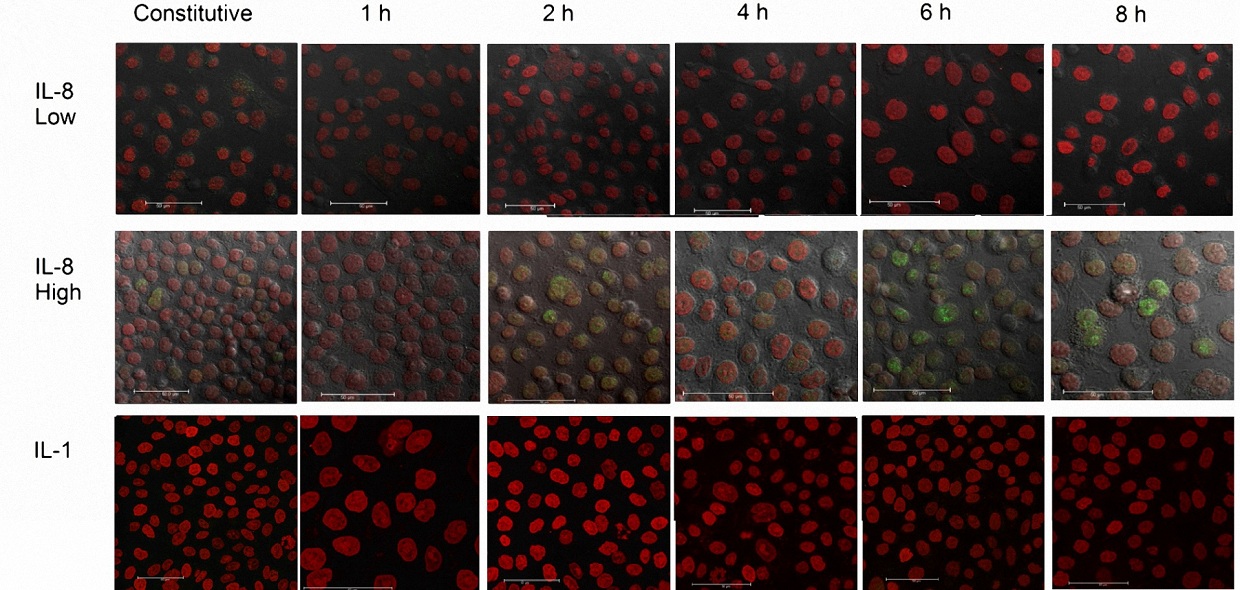 |
Figure 5: Microphotographs that show the effect of different human recombinant IL-8 and IL-1b concentrations, on Cdx2 expression, by AGS cells. A) low-dose recombinant IL-8 (50 pg/ml) concentration, B) high-dose recombinant IL-8 (3,800 pg/ml) concentration, and C) recombinant IL-1b (500 pg/ml) concentration. The images represent the phenomena observed at different time intervals. The red color represents the cell´s nuclear staining with PI (propide iodide) whereas the green color represents the fluorescence of the Alexa-488 or FITC-labeled second antibody. The confocal microscopy images were taken with a 60x lens and the white bar represents 50 mm |
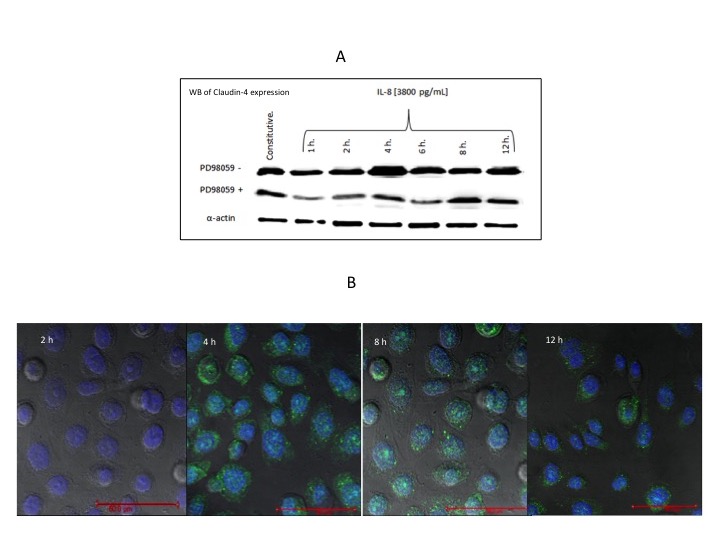 |
Figure 6: A) Expression of claudin 4 in AGS cells treated with high dose recombinant IL-8 in the presence of the MEK inhibitor PD98095. B) Microphotographs showing the effect on claudin-4 expression, at different time intervals, of AGS cells exposed to high dose recombinant IL-8. The blue color represents the cell´s nuclear staining with DAPI (4´,6-diamidino-2-phenylindole,dihydrochloride) and the green color represents the fluorescence of the Alexa-488 or FITC-labeled second antibody. The confocal microscopy images were taken with a 60x lens and the red bar represents 50 mm |
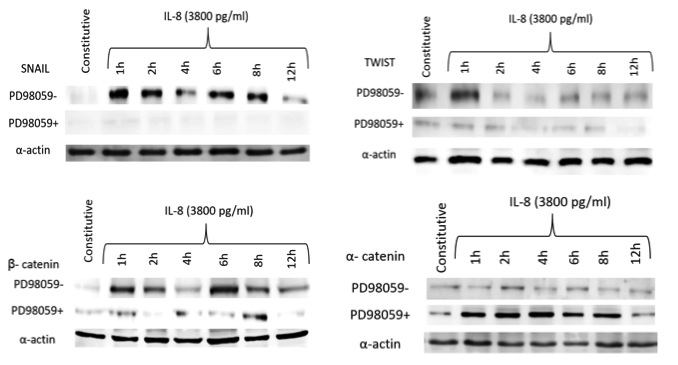 |
Figure 7: Western blot analysis showing the expression of Snail, TWIST, b- and a-catenin transcription factors in AGS cells treated with high dose recombinant IL-8 concentration, at different time intervals, in the presence or not of the MEK inhibitor PD98095. Results represent the mean of three different experiments |
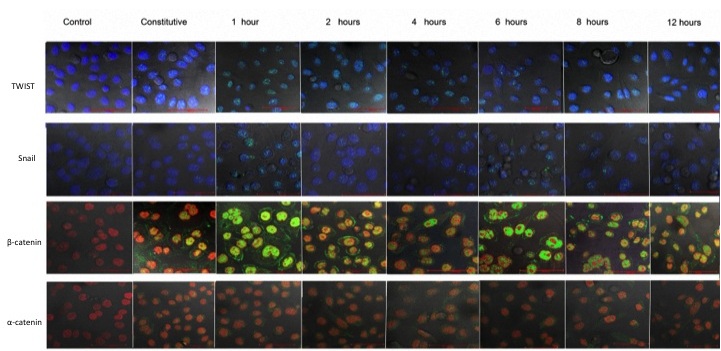 |
Figure 8: Micrographs demonstrating the expression of TWIST, SNAIL, b-catenin and a-catenin epithelial-mesenchymal transition proteins on AGS cells exposed to high human recombinant IL-8 (3,800 pg/ml) concentrations, at different time intervals. The red color represents the cell´s nuclear staining with PI (propide iodide) and the blue color represents the cell´s nuclear staining with DAPI (4´,6-diamidino-2-phenylindole,dihydrochloride); the green color represents the fluorescence of the Alexa-488 or FITC-labeled second antibody. The confocal microscopy images were taken with a 60x lens and the red bar represents 50 mm |
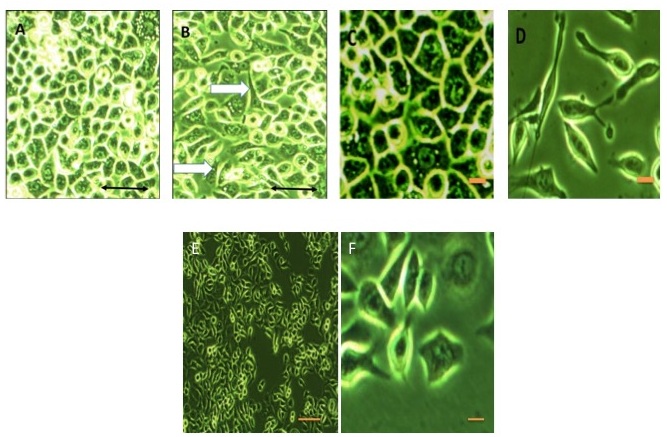 |
Figure 9: Phenotype modification of AGS cells stimulated with IL-8. A) non-stimulated cells, B) cells stimulated with high dose human recombinant IL-8 (3800 pg/ml) concentrations for 12 h, C) close-up of non-stimulated cells, D) close-up of stimulated cells demonstrating the “hummingbird” phenotype, E) cells stimulated with high dose human recombinant IL-8 in the presence of MEK inhibitor PD98095, F) close-up of cells shown in E where an abnormal cell but not a hummingbird phenotype can be distinguished. Scale bars in A, B and E represent 50 mm. Scale bars in C, D and F represent 10 mm. White arrows in B indicate the characteristic shape change to the “hummingbird” phenotype |


