Open Access
research article
Max Screen >>
ISSN: 2394-6504
Copyright: © 2015 William Toppen BA. This is an open-access article distributed under the terms of the Creative Commons Attribution License, which permits unrestricted use, distribution, and reproduction in any medium, provided the original author and source are credited.
Related article at Pubmed, Google Scholar
Background: Postoperative atrial fibrillation (POAF) is a common and dangerous complication following cardiac surgery. Therefore, a method to predict POAF could potentially reduce the costs and morbidity associated with cardiac surgery. The aim of this study was to identify electrocardiographic signatures prior to POAF.
Methods: Patients were grouped into a POAF group (N=6) and non-POAF group (nPOAF, N=7). Continuous ECG data was segmented and analyzed for each patient. Short two-minutes segments in the minutes preceding AF were analyzed for POAF patients. Additionally, two-minute segments from preoperative day 1, and postoperative days 1 and 2 were compared between POAF and nPOAF groups. A custom computer program was built for analysis and segments were analyzed for activation-recovery interval (ARI) and heart rate variability (HRV).
Results: On postoperative day 1, POAF patients had a 21% shortened average ARI from preoperative baseline while nPOAF patients had a 5% longer ARI (P=0.027). There was a reduction in short-term HRV four minutes prior to AF (P=0.004). Additionally, there was a reduction in the ratio of short to long-term HRV at six (P<0.03) and two minutes (P<0.01) preceding AF.
Conclusion: Our results demonstrate recognizable changes in electrocardiographic markers preceding the onset of AF following cardiac surgery. This may provide an avenue for real-time surveillance and targeted intervention. The utility of these markers should be investigated in a larger cohort moving forward.
Keywords: Postoperative atrial fibrillation; Postoperative complications; Activation-recovery interval; Cardiac surgery; Heart rate variability; Atrial fibrillation detection; Cardiothoracic; Cardiac arrhythmiaPostoperative atrial fibrillation (POAF) is the most common complication following cardiac surgical operations, occurring in up to 40% of patients, depending on type of surgery and method of surveillance [1,2]. POAF has been associated with increased morbidity including neurologic events, congestive heart failure, renal insufficiency, infection, extended ICU stay, and increased overall hospital stay [3]. Some studies have shown increased mortality from POAF, primarily due to thromboembolic events [4]. The increased cost of healthcare in the presence of all types of atrial fibrillation (AF) has also garnered recent attention [5]. As a result, great efforts have gone into prevention and treatment of POAF. Rate-control alone in the postoperative period leads to increased risk of thromboembolism, and is not ideal from a hemodynamic standpoint. Preoperative prophylaxis with amiodarone reduces the risk of POAF by 50% in cardiac surgery patients while beta-blockers have shown a less profound impact [3,6,7]. However, the cost and adverse effects of antiarrhythmic agents have limited their widespread use for POAF prevention. Currently, a reliable system to predict POAF for targeted therapy does not exist.
Atrial fibrillation (AF) after surgery has been attributed in part to the increased inflammation and changes to the autonomic nervous system in the postoperative period [8]. In ambulatory paroxysmal atrial fibrillation, both sympathetic and parasympathetic mechanisms for atrial fibrillation have been identified using heart-rate variability (HRV) analysis [9]. Additionally, the reported efficacy of beta-blockers in reducing POAF supports the concept that sympathetic activity drives POAF.
Due to difficulties in direct measurement, surrogate markers of sympathetic outflow to the heart have been developed and validated. Lux and coworkers demonstrated that the activation-recovery interval (ARI) of cardiac electrograms from the surface of the heart correlates with local action potential duration. ARI shortening has been noted in the presence of sympathomimetic agents [10] and more recently by direct sympathetic stimulation [11]. Additionally, autonomic input to the heart has been shown to influence short-term (parasympathetic) and long-term (sympathetic) HRV [12]. Finally, RT-interval variability has been shown to correlate with changes in the autonomic environment of the heart [13,14]. In this study we tested whether ARI, HRV, and RT markers recorded through surface ECG could be used to predict POAF in cardiac surgery patients.
Patients undergoing cardiac surgery in a one-year period (2012) were selected at random from a prospectively maintained database and divided into two groups depending on the development of POAF (POAF and nPOAF groups). In order to study de novo POAF, patients with a history of arrhythmias were excluded. Patients with a history of arrhythmia, undergoing arrhythmia surgery, heart transplantation, and those being placed on long-term extracorporeal support were excluded. Finally, patients were excluded for incomplete or noisy telemetry data. The entire telemetry dataset was collected at a sampling rate of 200Hz from the time of admission until discharge. Central precordial V lead was used for analysis.
AF was defined as >30 seconds of irregularly irregular QRS complexes without discernable P waves [15]. Episodes of AF were verified independently by a second investigator. Raw heart monitor data was reviewed using LabChart (AD Instruments, New South Whales) and the last sinus beat preceding development of AF was identified. Two-minute segments of clean data were extracted at 60, 10, 8, 6, 4, and 2 minutes prior to the onset of POAF (Pre-AF segments). Additionally, we isolated two 2-minute segments of continuous telemetry data from preoperative day 1(PreOD1), and postoperative day 1 (POD1) for 4 POAF and 8 nPOAF patients (Pre/postoperative segments).
This study was approved by the Institutional Review Board at the University of California, Los Angeles.
A custom LabVIEW program (National Instruments, Austin, TX) was built for ECG analysis. Briefly, imported data was filtered using a 50-60 HZ bandstop filter. Baseline detrending was applied and R-waves were identified by an automatic adaptive thresholding algorithm. Visual verification of all automated steps was performed. RR intervals and HRV parameters were then derived using available subroutines. ARI’s were determined by peak detection of the voltage derivative plot as previously described [16]. ARI was defined as the interval between the maximum negative QRS voltage slope (dV/dt min) to the maximum positive T-wave slope (dV/dt max). RT-interval (RT) was defined as the interval between the QRS peak and the T peak.
To track HRV, a Poincaré plot was used by plotting each RR interval against the preceding RR interval. The short and long-axis standard deviations, SD1 and SD2, as well as SD1/SD2 ratios were then calculated.
SD1 represents short-term HRV and was calculated as dispersion perpendicular to the line of identity (x=y).
SD2 represents long-term HRV and was calculated as dispersion along the line of identity [12,17].
Both the ARI and RT values were also normalized by the individual’s instantaneous heart rate (Bazett’s correction) to yield normalized ARI (nARI) and RT (nRT). All values were standardized for percent difference from distant baseline to analyze trends (60 minutes before AF for pre-AF analysis, PreOD1 values for pre/postoperative analysis).
Statistical analysis was done using Microsoft Excel (ver. 2010; Microsoft Corporation, Redmond, WA). Pre-AF intervals were compared to baseline values of each patient using a paired two-tailed, Student t-test. Pre/postoperative variables of POAF and non-POAF were compared using an unpaired two-tailed, student T-test. P-values <0.05 were considered statistically significant.
Of more than 400 patients who underwent cardiac surgery at our institution during 2012, 16% developed postoperative atrial fibrillation. Given the sheer size of each patient’s individual telemetry file, our study requested data for 30 patients with POAF, and 30 without, amassing over 300 GBs. Patients were chosen at random by a database manager unfamiliar with the study design and provided only inclusion and exclusion criteria. Of the requested data, six POAF patients and seven nPOAF had complete, sufficiently clean telemetry records. Patients in the POAF group were found to be older on average than those in the nPOAF group (P<0.05), no other significant differences were noted between the two groups (Table 1).
There was a statistically significant difference between the ARI trends from preoperative baseline of POAF and nPOAF patients on POD1. On POD1, POAF patients experienced a shortening of their ARI’s by 21% while nPOAF patients had a 5% longer ARI on average (P= 0.02) (Figure 1). All other variables analyzed did not show significant differences.
For the period preceding the onset of POAF, ARI, RT, and HRV values were analyzed for 120-second intervals as above for four of the six POAF patients, two being excluded for excessive signal noise leading up to the development of AF. The results are as follows:
ARI- No statistical differences in ARI or nARI were seen at any time interval leading up to AF in any of the seven POAF patients.
RT- No statistical differences in RT or nRT were seen at any time interval leading up to AF in any of the six POAF patients.
HRV- Analysis of long-term and short-term HRV revealed a statistically significant decrease in the short-term variability of RR interval at four minutes prior to the onset of AF (P= 0.004) (Table 2, Figure 2). Additionally, a statistically significant decrease in the ratio of short-term to long-term RR variability was seen at six minutes (P<0.03) and two minutes (P<0.01) preceding AF (Table 3).
Postoperative AF remains a challenging problem in modern cardiac surgery as it results in increased costs and morbidity. As of yet, a reliable predictor of AF has not been identified. Our study identified a shortening of postoperative ARI’s (surrogate marker for increased sympathetic tone to the heart) in patients who developed POAF on POD1. Additionally, there was a decrease in both short-term HRV and the short to long-term HRV ratio in the minutes preceding AF.
Preventing AF in the postoperative period may lead to improved outcomes and decreased resource utilization. Characterization of clinical markers preceding AF may allow for targeted therapy, similar to other clinical scenarios such as hypotension. The aim of this study was to identify potential clinical signatures of autonomic activity prior to the onset of POAF. We were able to build and validate a novel computer program to calculate ARI and HRV parameters on telemetry recordings. Our results demonstrate several postoperative markers of autonomic tone that correlate with POAF. The decrease in both short-term HRV and the ratio of short-term to long-term variability (sympathetic balance) preceding POAF implicated a shift towards more sympathetic influence on the heart preceding AF [12,18]. Similarly, the shortening of the cardiac surface ARI seen amongst POAF patients postoperatively, indicates increased sympathetic tone. These autonomic footprints offer a potential method of monitoring sympathetic activity in real-time, allowing the possibility of targeted, prophylactic intervention for at-risk patients. However, due to individual variability, surface ECG markers may not be sufficiently accurate to serve as the sole warning system.
There were several limitations to this study. The major limitation to the study was the difficulty in retrospectively analyzing large amounts of patient telemetry. Each patient record amounted to over 5gb’s of data that had to be manually read to find postoperative atrial fibrillation. Additionally, poor signal quality in the majority of the recordings precluded their use, resulting in few patients suitable for analysis. Together, these issues prevented us from analyzing larger number of patients. In the future, this problem can be addressed by appropriate engineering measures such as better electrode contact on the patients. Additionally, due to noise, segments generally longer than 120 seconds could not be analyzed automatically. Longer segments should be considered in future studies with appropriate filtering, though it is unlikely that longer segments would yield significantly different results. Although heart rate variability parameters have generally been based on long-term Holter monitoring, they have also been applied to short segment electrograms. Bilchick and colleagues have validated the comparison of HRV values between segments of the same length [19].
We have demonstrated measurable differences in electrocardiographic markers of sympathetic input to the heart between cardiac surgery patients who develop POAF and those who do not. Due to the simplicity of our methods, utility of autonomic markers in predicting POAF should be prospectively examined in larger cohorts. Once validated, tailored interventions to prevent AF should be administered to the group with a high chance of AF. Other methods of monitoring changes in autonomic influence to the heart, such as recording from temporary epicardial pacing wires, warrant further investigation.
We would like to thank Peter Hsiue, Laith Mukdad, Mackenzie Postel, and Christina Hershey for their contribution to the project.

![]()

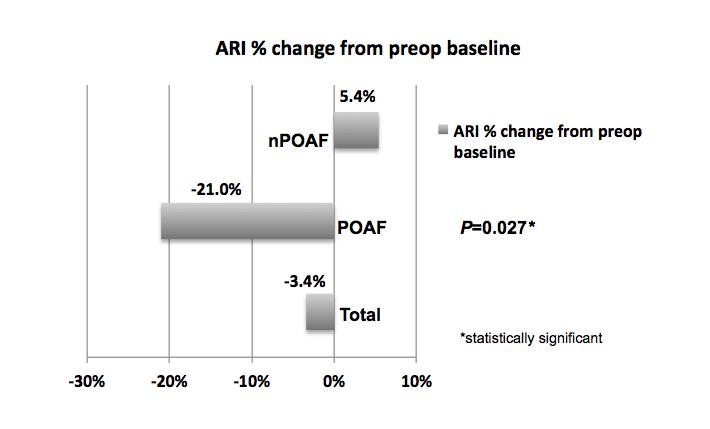 |
| Figure 1: ARI- activation-recovery interval; nPOAF- non-postoperative atrial fibrillation; POAF-postoperative atrial fibrillation |
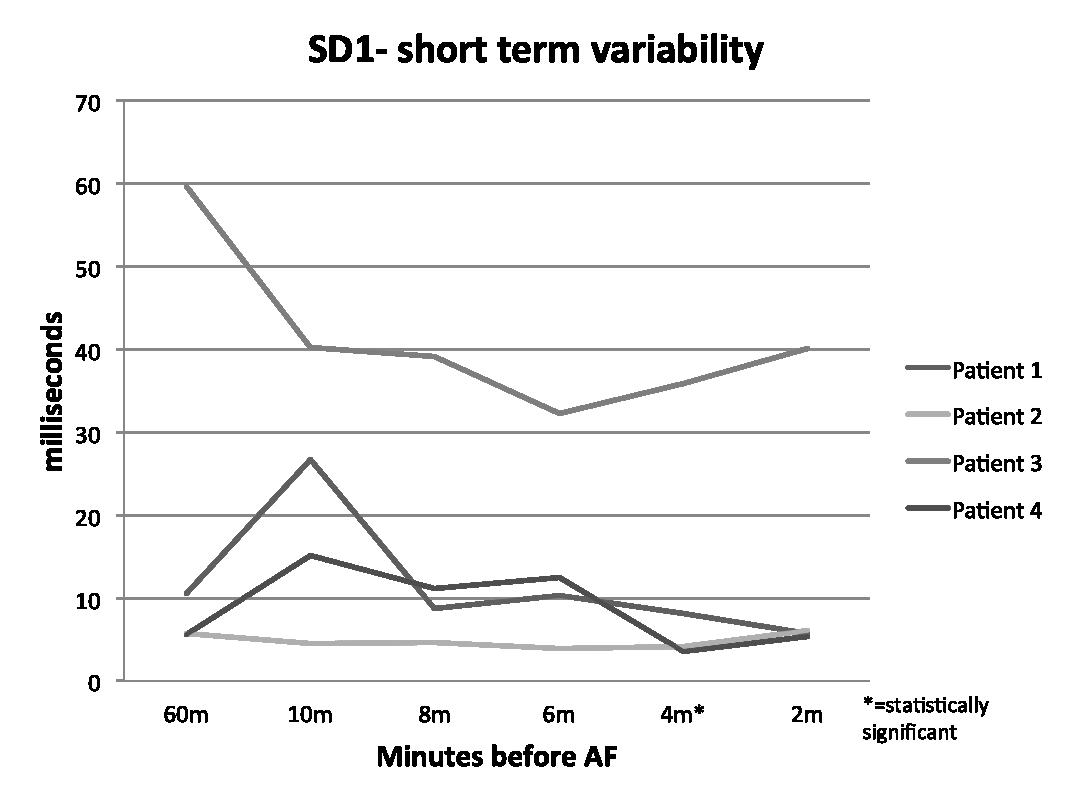 |
| Figure 2: SD- standard deviation; AF- atrial fibrillation |
Baseline Demographics |
||||
Total (N=13) |
POAF (N=6) |
nPOAF (N=7) |
P-Value |
|
Preoperative Characteristics |
||||
Male |
9 (69%) |
4 (67%) |
5 (71%) |
0.87 |
Age at Surgery (years ± SD) |
63.6 ± 16 |
72.8 ± 7 |
55.7 ± 17 |
<0.05* |
Body Mass Index, kg/m2 (mean ± SD) |
26.8 ± 5 |
26.4 ± 5 |
27.1 ± 6 |
0.84 |
| Left Ventricular Ejection Fraction (%) | 48.3% |
47.6% |
50% |
0.80 |
| Last Preoperative Hematocrit (%) | 35.3% |
39% |
31.9% |
0.052 |
| Received preoperative Beta-blocker | 7 (54%) |
5 (83%) |
2 (29%) |
0.052 |
Operative Characteristics |
||||
Surgery time in min (mean ± SD) |
272 ± 67 |
288 ± 58 |
259 ± 77 |
0.50 |
CABG |
5 (38%) |
3 (50%) |
2 (29%) |
0.99 |
Valve Procedure |
2 (15%) |
0 (0%) |
2 (29%) |
0.99 |
CABG + Valve |
5 (38%) |
3 (50%) |
2 (29%) |
0.99 |
Other |
1 (8%) |
0 (0%) |
1 (14%) |
0.99 |
| Table 1: CABG- coronary artery bypass grafting; SD- standard deviation. Other category includes aortic surgeries, operations involving the myocardium and intra-cardiac masses | ||||
SD1 Changes |
|||||
SD1 % Change from Baseline |
10 min prior |
8 min prior |
6 min prior |
4 min prior |
2 min prior |
Patient 1 |
153.5% |
-16.8% |
-2.3% |
-22.7% |
-45.5% |
Patient 2 |
-20.2% |
-18.2% |
-32.5% |
-27.6% |
6.5% |
Patient 3 |
-32.5% |
-34.2% |
-45.9% |
-39.8% |
-32.6% |
Patient 4 |
166.8% |
96.3% |
112.0% |
-37.1% |
-5.5% |
P-Value |
0.30 |
0.84 |
0.81 |
<0.01* |
0.21 |
SD- standard deviation |
*=statistically significant |
||||
| Table 2: SD- standard deviation | |||||
SD1/SD2 Changes |
|||||
SD1/SD2 % Change from Baseline |
10 min prior |
8 min prior |
6 min prior |
4 min prior |
2 min prior |
Patient 1 |
11.0% |
-54.3% |
-49.9% |
-49.6% |
-49.6% |
Patient 2 |
48.0% |
-13.9% |
-9.8% |
21.2% |
23.5% |
Patient 3 |
-24.0% |
-12.5% |
-50.8% |
35.4% |
-36.7% |
Patient 4 |
42.7% |
-55.5% |
-39.8% |
-68.4% |
-49.9% |
P-Value |
0.33 |
0.07 |
<0.03* |
0.19 |
<0.01* |
SD- standard deviation |
*=statistically significant |
||||
| Table 3: SD- standard deviation | |||||


