Open Access
Research Article
Max Screen >>
Copyright: © 2017 Gottipamula S. This is an open-access article distributed under the terms of the Creative Commons Attribution License, which permits unrestricted use, distribution, and reproduction in any medium, provided the original author and source are credited.
Related article at Pubmed, Google Scholar
Introduction: Buccal mucosal urethroplasty has revolutionized the surgical management of urethral strictures but the success of the procedure has been variable in different series. We have attempted to understand the interplay between buccal mucosal epithelial cells (BME) and the fibroblasts at the molecular level using connective tissue growth factor (CTGF) as a marker so that translation of this information would help in better urethroplasty outcomes.
Materials and Methods: The morphological and functional characteristics of normal urethral fibroblasts (NUF) and urethral stricture fibroblasts (UStF) with and without co-culture with BMEs are compared. The intracellular and extracellular level of CTGF expression in the UStF co-cultured with BMEs was analysed by using molecular biology methods.
Results: The UStF were similar in morphology to NUF, but had higher proliferation rate and produced more collagen. When UStF were co-cultured with BME, CTGF levels in the fibroblasts were downregulated consistently and significantly.
Conclusion: Fibroblasts in the stricture area tend to proliferate and produce more collagen than normal urethral fibroblasts. Proliferating co-cultured BMEs downregulate the expression of CTGF in stricture fibroblasts. Based on these findings, we hypothesize that anti-fibrotic medical treatments which downregulate the CTGF may prevent the formation of strictures.
Keywords: Buccal epithelial cells; Connective tissue growth factor; Fibroblasts; Urethroplasty
Urethral stricture disease causes considerable morbidity due to obstruction of urine flow, infections, and pressure effects proximally [1]. It is characterised by the deposition of excessive amounts of collagen in the strictured area [2]. Buccal mucosal grafts (BMG) have been used as a standard-of-care for the surgical management of urethral strictures for over 20 years [3]. It is assumed that the grafted buccal mucosa forms a new layer of mucosal continuity and maintains an enlarged lumen for a prolonged period of time. However, the actual mechanism of the interplay between epithelial cells, fibroblasts and local biomolecules has not been studied in depth as yet. Previously reported literature has shown that the UStF show increased expression of inflammatory markers and connective tissue growth factor (CTGF), leading to increased collagen deposition resulting in urethral stricture [4-6].
Although, there are several cytokines involved in fibrosis, but the expression of CTGF/CCN2 [6] is more prominent and leading cause for fibrosis (by inducing TGF-β1), as evident by development of anti-CTGF monoclonal antibody for phase-1 clinical trials [7]. Similarly, Anti-CTGF human monoclonal antibody (FG-3019) by FibroGen is in phase-II clinical trials (clinicaltrial.gov). The CTGF is multi-functional growth factors belong to a family of CCN (cysteine rich 61, CTGF, nephroblastoma overexpressed/NOV/CCN3). CTGF regulates proliferation, adhesion, differentiation and formation of ECM. Hence increased expression of CTGF leads to excessive collagen deposition in stricture area, thereby causing obstruction in urine flow and other diseases [8-11]. Tissue penetration is a major challenge in antibody therapy. Current study uses the cell therapeutic candidate as keratinocytes derived from buccal mucosa to tests its efficacy in co-culture conditions, where we used diseased fibroblast (UStF).
In the current study, UStF and NUF were compared in terms of morphology, growth kinetics, collagen deposition, HLA-DR expression and CTGF levels. Furthermore, the CTGF expression levels of UStF co-cultured with BME were studied.
Informed consent was obtained from patients (age above 55 years) undergoing urethroplasty after approval of the institutional ethics committee. The biopsy samples were taken from patients who had strictures and interventions (more than 2 dilations and at least one urethroplasty) over a long period of time. A small segment of the BMG from the donors (n=3) was taken to derive the BME and the small section of the fibrous tissue excised from the strictured area was used to isolate UStF. A 1 cm2 sized biopsy of the normal urethra from a site, nearly 2 cm away from the strictured area, was used to derive the NUF. The UstF and NUF biopsy samples was taken from the same donor (n=3). Human dermal fibroblasts (HDF) was isolated from 1 cm2 section of circumcised skin discarded during surgery (n=3) and was used as control for immunophenotype of HLA-DR.
The BME were isolated using a two-step enzymatic procedure involving Dispase II (Life Technologies, Waltham, MA, USA) treatment to separate epithelial cell sheets, followed by further digestion with CollagenaseType IV (Life technologies, Waltham, MA, USA). The isolated cells (n=3) were cultured in Epi-Life complete medium (Life technologies), as per the manufacturer’s instructions and expanded till passage 2 (P2) for further use in co-culture experiments. The UStF and NUF were isolated from the urethral tissue by Collagenase IV digestion and cultured in Dulbecco’s Modified Eagle Medium (DMEM) (Thermofisher Scientific, Waltham, MA, USA) containing 10% Fetal Bovine Serum (FBS) (Invitrogen, Waltham, MA, USA). The cells were grown at 37 oC in a humidified 5% CO2 incubator, cryopreserved at P2 and further passaged to P4. The morphological changes during cultivation were recorded using a phase contrast inverted microscope (Olympus INV, Marristown, New Jersey, USA) at 280 X magnification.
The growth kinetics of NUF and UStF were investigated between P1 to P4 and the cumulative population doublings (CPD) and population doubling time (PDT) were calculated. CPD is the sum of population doublings at a given passage number using the seeding density of 5000 cells per cm2 and calculated as reported by Yuan et al. 1995 [12].
PicroSiriusRed (PSR) stain is a connective tissue stain which stains collagen both in the intra and extra cellular area [13]. Collagen deposited by fibroblasts (NUF and UStF) was assessed using a PSR stain kit (AbCam, Cambridge, UK) as specified by the manufacturer’s instructions. The optical density was determined at 540 nm using an Infinite M200 (Tecan Austria GmbH, Germany) and the assay was done in triplicates.
The HLA-DR expression is an indicator of an inflammatory event [14]. HLA-DR expression in NUF, UStF and HDF at P2 was investigated by using flow cytometry (Beckman coulter, FC500 series, Indianapolis IN, USA) in triplicates.
The 0.3 X 10⁶ cells of UStF were seeded in 6 well plates and 0.3 X 10⁶ of BME were separately seeded in polyurethane cell culture inserts (ThinCert™ Greiner Bio-One GmbH, Germany) of 0.4 μM pore size. Wells containing UStF alone at the same seeding density were used as controls. The cell cultures were prepared in separate compartments (inserts and wells) a day before the co-culture. DMEM supplemented with 10% FBS was used as the standard culture medium for all cell types prior to induction. The following day, the co-culture was induced by placing the inserts containing BME onto UStF wells. The medium used during induction phase was DMEM supplemented with 0.5% FBS and cells were near to confluence in inserts and wells. Co-culture of BME into UStF was continued for 24 h and respective fibroblasts and conditioned medium were collected and analysed for determining CTGF levels. The co-culture experiment was done in triplicates.
The CTGF derived from UStF (non-co-cultured), BME/UStF (co-cultured) cells and their respective conditioned medium was subjected to a Western blot using anti-human CTGF antibodies. Protein from a suitable volume of conditioned media from UStF and BME/UStF was precipitated by centrifugation, TCA precipitation and subsequently loaded onto an SDS-PAGE gel. The intracellular CTGF antigen of UStF (non-co-cultured) and BME/UStF (co-cultured) cells was isolated as described. Briefly, the cells were lysed to obtain the total intracellular protein, the protein content was estimated using NanoDrop (ThermoFisher Scientific, Waltham, MA, USA) and loaded onto an SDS-PAGE and transferred to a PVDF membrane. The immunoblotted proteins were incubated with rabbit polyclonal anti-CTGF antibodies (PeproTech, NJ, USA) followed by incubation with horseradish-peroxidase conjugated secondary antibodies (Aristogene Bioscience, Bangalore, India). The blot was developed using H2O2 as a substrate to localize the CTGF protein. Recombinant CTGF (PeproTech, NJ, USA) of 11 kDa, known to possess heparin-binding and cell-adhesion motifs and these activities are within the C-terminal 103 residues of CTGF and show that CTGF-mediated cell adhesion is heparin and divalent cation-dependent has been used was used as a positive control and the experiment was done in triplicates [15].
The level of the CTGF antigen in UStF, BME-UStF co-cultured cells, and the conditioned media was examined by CTGF sandwich ELISA using a PeproTech sandwich ELISA kit as per the manufacturer’s instructions and the experiment was done in triplicates.
Glyceraldehyde-3-phosphate dehydrogenase (GAPDH), that is encoded by a single gene and produces a single mRNA transcript with no known splice variants, has been used as an internal control for our RT-PCR experiments. The total RNA prepared from the various cell types were first quantitated and examined for the amount of mRNA for GAPDH by RT-PCR by routine methods. The experiment was than conducted for CTGF mRNA levels by RT-PCR from the same set of total RNA’s in BME, UstF and BME/UstF cells.
The CTGF mRNA copy number in the UStF and BME/UStF co-cultured cells was determined by qPCR using human CTGF gene specific primers. Total RNA was extracted from both the type of fibroblasts by using RNeasy Mini Kit (Qiagen, Germany) following manufacturer’s instructions, and the RNA concentration measured using Agilent Bioanalyzer RNA Chip (Agilent, Santa Clara, CA, USA). 1 μg of total RNA was transcribed to cDNA using SuperScript III TM Platinum one step qRT-PCR Kit (Invitrogen, CA, USA) according to manufacturer’s protocol. Real time PCR was performed in a Qiagen qPCR machine (Qiagen, Strasse 1, Hilden, Germany) and the experiment was done in triplicates.
All values were expressed as mean ± SEM (standard error of mean). Data were analysed by Student’s t-test, ANOVA using Graphpad Prism (version 5, Graphpad Software Inc., La Jolla, CA, USA). P value <0.05 was considered significant.
The biopsy samples of NUF and UStF from the same patient were transferred to cell processing facility of our laboratory in sterile transportation media at 2-8 oC. The P0 seeding density of NUF and UStF for isolation was 50, 000 cells per cm2 and 5,000 per cm2 at subsequent passages. It was observed that UStF attained 80-90% confluency at a faster rate than NUF derived from the same patient. The P0 cell yield of NUF and UStF was 0.5 to 0.92 million per 9.6 cm2. The morphological characteristics of NUF and UStF confirmed the innate, spindle-shaped nature of fibroblasts (Supplementary Figure S1). Similarly, morphological, cultural characteristics and growth kinetics of epithelial cells include BME were studied [17]. There were no prominent differences in basic morphological characteristics between NUF and UStF.
The proliferation efficiency across P1 to P4 in UStF was higher than NUF but significantly higher at P3 and P4 as evident from growth kinetics plots (Figure 1a and Figure 1b).
The deposited collagen was identified by PSR staining, followed by quantification at 540 nm using spectrophotometry. The images show an increased deposition of collagen in UStF when compared to NUF (Figure 2a and 2b), and UStF produced significantly more collagen than NUF (Supplementary Figure S2).
The NUF and UStF showed prominent expression of HLA-DR when cultured under identical conditions (Figure 3), but UStF showed substantially higher expression levels of HLA-DR as compared to NUF. The HLA-DR levels were compared with HDF (Supplementary Figure S3).
The cell number of UStF were measured in co-cultured UStF (BME/UStF) and non-co-cultured UStF. Each pool is 3 wells of 6- well plate in terms of cell number of UStF alone and BME/UStF were represented in Figure 4. The UStF in BME/UStF showed significantly lower cell number as compared to UStF alone.
The CTGF protein expressed by the cells was detected by Western blotting at an estimated molecular weight of approximately 38 kDa. The control recombinant CTGF protein was detected at an expected molecular weight of 11 kDa. BME/UStF co-cultured cells and their conditioned medium exhibited reduced amount of CTGF expression when compared to CTGF in UStF alone as shown in Figure 5. The western blot data correlates well with the ELISA values of CTGF observed for UStF cells and BME/UStF cells. Also, the western blot showed that the CTGF protein from both the cell types showed similar size on SDS-PAGE with no apparent degradation or dimerization (Figure 5). The panel C shows the specificity of the anti-CTGF antibody that lights up the recombinant CTGF protein specifically while panel A and B showed visible reduced signal of CTGF in BME/UStF co-cultured cells in comparison to the CTGF protein expressed from UStF cells alone.
The results indicate that co-culture with BME suppressed the secretion of CTGF from UStF by approximately 68% as shown in Figure 6a, while intracellular CTGF suppression was about 73% (Figure 6b).
BME and BME/UstF cells showed similar Ct values for the fluorescence of GAPDH levels by RT-PCR (Supplementary Figure S4 Panel A). The data also showed similar melt curve analysis for the GAPDH for both the cell types (Supplementary Figure S4 Panel B).
The CTGF expression was found to be down-regulated by 71% in UStF /BME co-cultured cells in comparison to UStF as shown in supplementary Figure S5. While supplementary Figure S5a shows that qPCR Ct value of UStF cells was lower in comparison to BME/UStF cells indicating higher levels of expression of CTGF in UStF cells over co-cultured UStF/BME cells, supplementary Figure S5b shows the melt curve analysis of both the qPCR products demonstrating the specificity of the CTGF PCR product obtained.
Supplementary Figure S6a shows the size of the CTGF PCR product obtained after the RT-PCR reaction of the total RNAs from UStF and BME/UStF cells on agarose gels, supplementary Figure S6b shows the same PCR products as tested on Agilent 2100 Bioanalyzer.
The CTGF expression in UStF and BME/UStF co-cultured cells by QPCR is shown in Figure 7. This figure shows histogram of amount of CTGF expressed from UStF cells and BME/UStF cells by QPCR. Values from UStF cells have been considered as 100% to calculate the relative amount of CTGF expressed in the normalized co-cultured cells of UStF and BME.
Buccal mucosal urethroplasty has been recommended for anterior urethral strictures more than 2 cm in length [17]. The interplay between the graft and the area of the urethral stricture is not completely understood. In the current study, we have shown that the fibroblasts in the strictured area express inflammatory markers such as HLA-DR (Figure 3), CTGF (Figure 5 and 6) and increased collagen deposition (Figure 2 and supplementary Figure S2), though they are morphologically similar to NUF (Supplementary Figure S1). All these internal changes in the UStF could have happened in response to injury which results in stricture. In a clinical setting, not all instrumentations of the urethra result in stricture suggesting additional mechanisms may be operating to produce stricture or to prevent it.
We have shown previously that epithelial cell conditioned medium inhibits the growth of fibroblasts [18]. In addition, here we have demonstrated the lowering of CTGF by the epithelial cells. Bradham et al. (1991) have demonstrated that CTGF plays an important role in scar formation and wound healing [19]. Further, CTGF that belongs to the family of multi-functional growth factors [20] is thought to modulate fibroblast cell growth [21]. The present study reflecting the reduced expression of CTGF in co-cultured cells of BME and UstF is interesting and hitherto unreported. It is tempting to speculate that a locally applicable preparation of the conditioned medium could prevent the response of the fibroblasts and decrease the incidence or severity of the stricture prophylactically.
Clinically it has been reported that repeated dilations or urethrotomies have modified a simple stricture to a severe stricture with increasing fibrosis [22] and produce acute inflammatory episode [23], which can be detected by increased HLA-DR expression [14].The detection of elevated HLA-DR expression in the stricture fibroblasts in our study probably indicate repeated inflammatory response to interventions.
The process of inflammation, fibrosis and collagen deposition has a crucial role in urethral scar formation. Substantial higher expression of HLA-DR expression in UStF is the result of inherent end point characteristics of chronic inflammation with abnormal accumulation of ECM [24]. But surprisingly the NUF has also shown moderate expression of HLA-DR lesser than UStF (Figure 3 and supplementary Figure S3); however, the HLA-DR is negative for normal human dermal fibroblast.
We have shown the downregulation of CTGF, and inhibition of fibroblasts by proliferating BMEs (Figure 4). But in a clinical setting of BMG urethroplasty, the graft has all the components of the epithelium including the basal multiplying cells and superficial non-multiplying stratified cells. When the BMG is getting incorporated with the native urethra the multiplying basal cells form the continuity by creeping substitution but the superficial non multiplying stratified cells would elicit inflammatory reaction for scavenging of these cells. Though the BMG is attached to the partial circumference of the urethral lumen, as the inflammation spreads all around it might lead to anastomotic ring strictures [25-27].
Here we have studied the interaction between pure population of multiplying BMEs and fibroblasts but in a clinical situation the graft would have combination of multiplying and non-multiplying epithelial cells and the fibroblast inhibition may not happen efficiently and this may result in recurrence of stricture. We propose that for urethral strictures, complete excision of strictured tissue and replacement by rapidly multiplying epithelial cell sheet generated by tissue engineering methods would be preferable to the existing approach.
We have shown different methods of CTGF assay that could be used to study the in vitro potency of any fibrotic therapies. The levels of CTGF observed in this study correlates well with the CTGF levels reported for skin fibroblasts as reported by Stratton et al (2001) [28].
The wound healing process is a complex process that is executed and regulated by an equally complex signaling network involving numerous growth factors, cytokines and chemokines, like the epidermal growth factor (EGF) family and transforming growth factor beta (TGF-beta) family. In this study, we have looked only at variation of the levels of CTGF in fibroblasts associated with urethral strictures. The examination of the levels of other growth factors in such clinical setting might give us a better picture of the urethral stricture initiation. The other limitations of the study are the use of limited number of samples, and the variability of the nature of stricture in different subjects which may influence the results.
We have shown for the first time that the BME inhibit CTGF expression levels in UStF both at the cellular and molecular level. This might explain to some extent the process of stricture and a way forward to prevent it. The methodologies used here to demonstrate the anti-fibroblast activities could be used in anti-fibrotic assays of different formulations.
The author discloses no conflict of Interest.
SRTE is fully supported by Sri Sringeri Sharada Peetam.

![]()

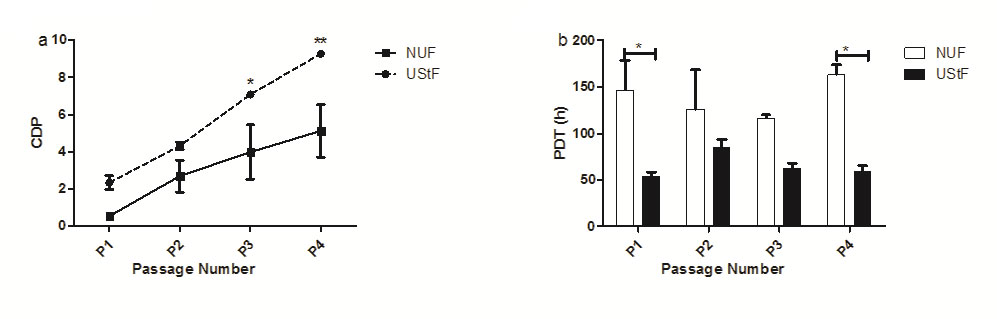 |
| Figure 1: Comparative growth kinetics profiles of NUF and UStF. (a) Cumulative population doublings (CPDs) b) Population doubling time (PDT); (*p≤0.05, **p≤0.01) |
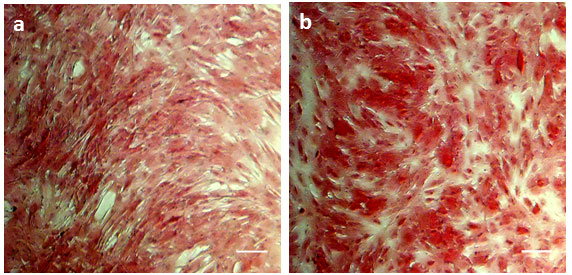 |
| Figure 2: Light microscopy images of (a) NUF and (b) UStF cells. Scale bar, 100 μm |
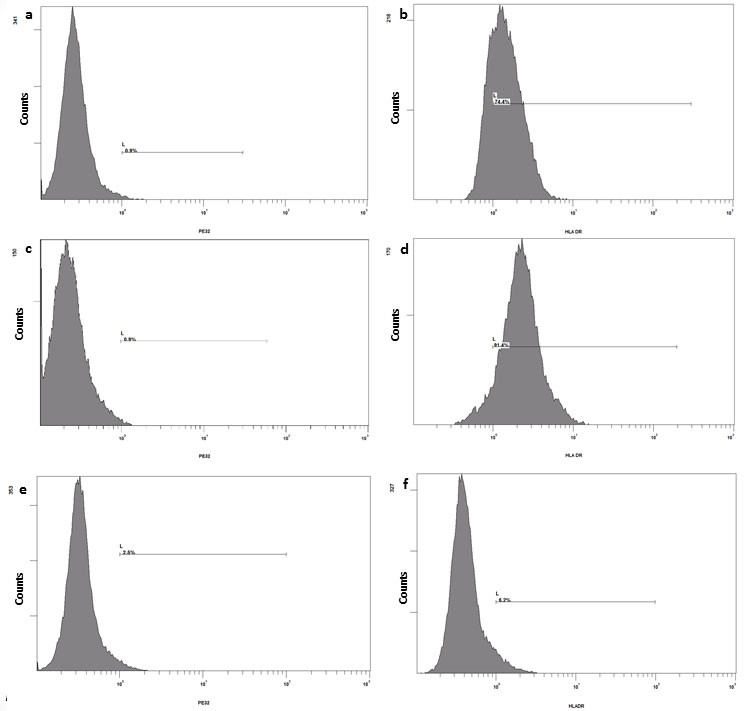 |
| Figure 3: Immuno-phenotyping of NUF (a, b), UStF (c, d) and HDF (e, f): A representative histogram of isotypes a, c, e and HLA-DR expression of b, d, f of respective cell type |
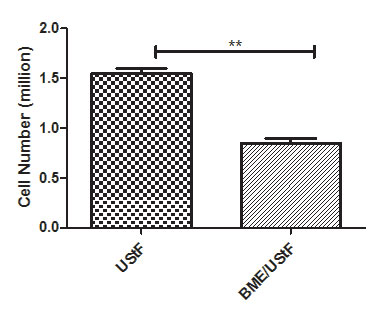 |
| Figure 4: Fibroblast suppression in terms of cell number in BME/UStF co-cultured cells compared with UStF non-co-cultured cells; (**p≤0.01) |
 |
| Figure 5: The figure depicts western blot of the CTGF protein samples of various cell types using anti-human CTGF primary antibody as described in materials and methods section. Panel A: Lane 1: Intracellular CTGF from Ust cells, lane 2: Prestained 43 kDA protein marker. Lane 3: Intracellular CTGF from BME/Ust cells; Panel B: Lane 1: Extracellular CTGF from Ust cells, lane 2: Extracellular CTGF from BME/Ust cells; Panel C: Lane 1: Standard recombinant CTGF |
 |
Figure 6: Histogram showing the concentrations of CTGF by ELISA, both a) extracellular CTGF secreted into the conditioned media, b) intracellular by UStF and BME/UStF; (**p≤0.01) |
 |
| Figure 7: CTGF expression in UStF and BME/UStF co-cultured cells by QPCR: This figure shows histogram of amount of CTGF expressed from UStF cells and BME/UStF cells by QPCR values of UStF have been considered as 100% to calculate the relative amount of CTGF expressed in the co-cultured cells of UStF and BME; (***p≤0.001) |
 |
| FigureS1: Comparative study of morphological characteristics of a) Normal Urethral Fibroblasts (NUF) and b) Urethral Stricture Fibroblasts (UStF) at Passage 1 (P1). Scale bar: ~100 µm |
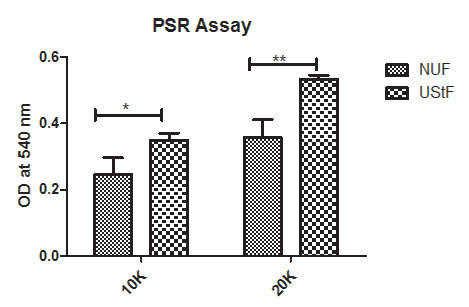 |
| Figure S2: PSR assay: The dye is eluted with 0.1N NaoH and quantified at 540 nm and shows a significantly higher collagen content in UStF than NUF. Abbreviations: 10K - 10,000 cells and 20K - 20,000 cells per well. (*p≤0.05, **p≤0.01) |
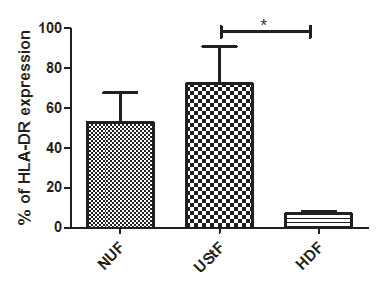 |
Figure S3: Overall comparison of HLA-DR expression in NUF, UstF and HDF cells; (*p≤0.05) |
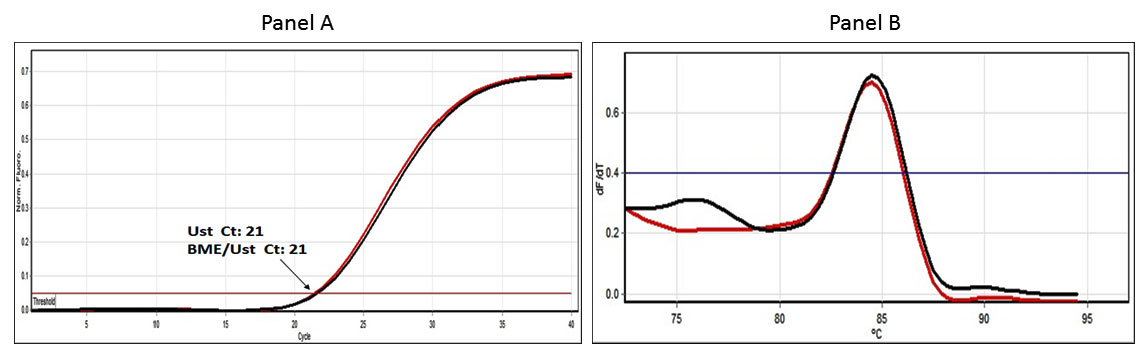 |
Figure S4: QPCR-Ct profile – GAPDH: SYBR Green fluorescence chart produced in real-time PCR of GAPDH. The Panel A shows the Ct values of the CTGF RT-PCR under the experimental conditions while the panel B shows the melting curve produced at the end of real-time PCR for CTGF from Ust cells (in red colour) and the CTGF RT_PCR signal (in black colour) |
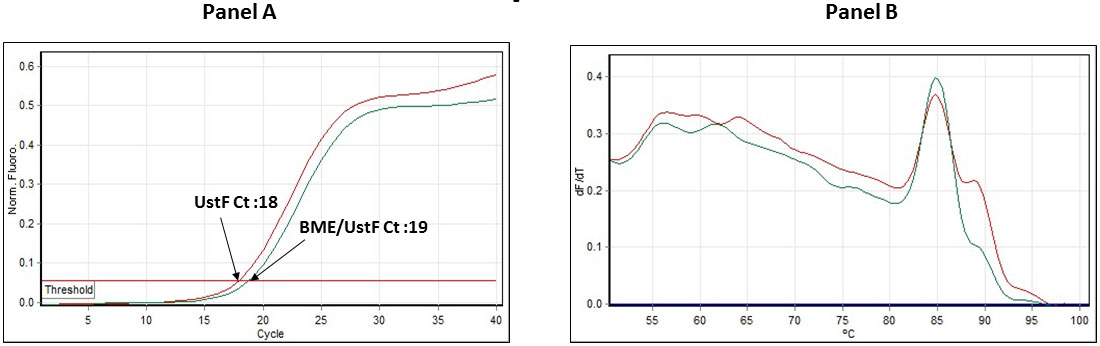 |
| Figure S5: QPCR-Ct profile: Fig. S5a depicts the qPCR Ct data of UstF (Magenta line), and BME/UstF (Cyan blue line). The total RNA was equalized prior to the RT-PCR. Fig. S5b depicts the qPCR-Melt curve of both the samples UstF (Magenta line) and BME/UstF (Cyan blue line) |
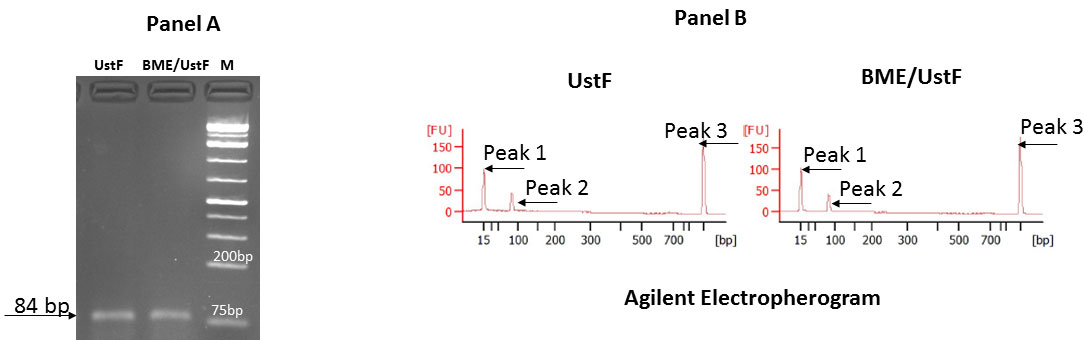 |
Figure S6: Agarose gel electrophoresis and Agilent electropherogram: Fig. S6a depicts the CTGF PCR products from UstF and BME/UstF cells and Fig. S6b depicts the Agilent Bioanalyzer profile of the RT-PCR products of CTGF. Peak 1 is 15 bp standard; peak 2 CTGF peak (84 bp) and peak 3 is 1500 bp standard |


