Open Access
Research Article
Max Screen >>
ISSN: 2639-3336
Copyright: © 2018 Sohair EED. This is an open-access article distributed under the terms of the Creative Commons Attribution License, which permits unrestricted use, distribution, and reproduction in any medium, provided the original author and source are credited.
Related article at Pubmed, Google Scholar
Field experiments were carried out in Agricultural and Experimental Research Station in years 2016 and 2017 to evaluate NPK nano-fertilizers application, times, methods and rates on yield and fiber properties of Egyptian cotton (Giza, 90). The experiment was laid out in a split-split-plot based on Randomized Complete Block Design with four replications. Treatments included two application times were applied in main plots, two application methods are foliar and soil in sub-plots and four rates applications of control (100% soil application traditional recommended NPK fertilizer dose (RFD) and nano NPK fertilizers 12.5%, 25% and 50% RFD) were applied in sub-sub-plots. Significant increases of total and open bolls per plant, boll weight and seed cotton yield as a result of the application of three times NPK nano-fertilizers than two times. Foliar nano-fertilizers application of these traits recorded higher values at the previous parameters than soil application. In the most of studied parameters nano-fertilizers at 50% RFD recorded values statistically at per with control traditional (100% RFD). Also, treatments of 12.5% at per with 25% NPK nano-fertilizers. Interactions between the studied three factors were insignificant in studied parameters except lint% . Whereas, the highest values of previous traits were obtained from plots treated with 50% RFD nano NPK with split 3 times and applied by foliar application in most cases. The application rates of NPK nano fertilizers significantly influenced studied fiber properties. Also, times and methods of application influenced fiber length in second season and application methods influenced Length uniformity Index in second seasons. All the interaction between study factors cleared no significant effect on fiber quality parameters except interaction between times and methods of application also, between times and rates of application had a significant effect on fiber strength in second season only.
Keywords:Cotton; Gossypium Barbadense L; NPK Nano-Fertilizers; Nano-Phosphorus; Nano-Nitrogen; Nano-Potassium; Seed Cotton Yield; Foliar and Soil Application; Cotton Fiber Quality
Cotton plays a considerable role in the economic development worldwide and important source of fiber, oil, and animal feed (Dai and Dong, 2014) [1]. The NPK are key nutrients required in large quantities by all crop plants and classed as major nutrient elements for plants. Cotton growth, development and maturity are greatly influenced by NPK fertilizers application which increases yield and yield components and fiber quality (Xia et al., 2013; Adnan et al., 2017 and Wajid et al., 2017) [2-4]. In the twenty-first century, agriculture has faced many challenges to produce food and fiber needs of the growing population. Since the population will be increased over nine billion by 2050, human beings will be faced more problems in satisfying their needs. In different fields, including agriculture, nanotechnology has extraordinary potential to make it easier for the next stage of precision farming methods. The agricultural sector will be using more of nanotechnology in the future to achieve higher yields in eco-friendly way even in challenging environment (Ali et al., 2014 and Prasad, 2014) [5,6].
Conventional fertilizers use efficiencies hardly exceed 30-35%, 18.20% and 35-40% for N, P, and K, respectively, which remained constant for the past several decades. Nano-fertilizers intended to improve the nutrients use efficiencies by exploiting unique properties of nano properties of nano-particles with range of nano-dimension from1 to 100 nm (Suppan, 2017) [7]. Moreover, it is very important to optimize the use of chemical fertilization for crop nutrient requirements to minimize the risk of environmental pollution by testing other methods of fertilization using new technologies such as nanotechnology (Manjunatha et al., 2016) [8]. Nano fertilizers will be absorbed by plants rapidly and completely, which save fertilizers consumption and minimize environmental pollution (DeRosa et al., 2010) [9]. The work done on nano-fertilizers is very limited across the global but the reported literature clearly demonstrated that these customized fertilizers have a potential role to play in sustaining farm productivity. Calcium phosphate nano-fertilizers could potentially help in reduction of the quantity of fertilizer applied to crops and contributing to precision farming as it reduces fertilizer wastage and in turn environmental pollution due to agricultural practices (Upadhyaya, et al., 2017; Singh et al., 2017) [10,11].
Conventional fertilizers are generally applied to crops by either spraying or broadcasting. However, one of the major factors that decide the mode of application is the final concentration of the fertilizers reaching to the plant. Soil application of phosphate can be tightly bound, and its mobility and availability in soil can limit plant growth. However, foliar application can reduce the time lag between application and uptake by plant during the rapid growth phase (Taiz and Zeiger, 2010) [12]. Significant increase in yield has been observed due to foliar application of nano-particles as fertilizer (Tarafdar et al., 2012a; Tarafdar et al., 2012b) [13,14]. Foliar fertilization can be used to improve the use efficiency and rapidity of a nutrient urgently required by the plant for maximum growth and yield (Habib, 2012) [15]. Therefore, the aim of this work was to study yield, yield components and fiber properties of cotton under different application times, methods and rates of NPK nano-fertilizers.
Two field experiments were conducted at the Agricultural Experimental and Research Station, Faculty of Agriculture, Cairo University, Giza, Egypt (31º 11' 33.43'E, 30º 1' 36.16' N) in the two successive summer seasons (2016 and 2017) to evaluate NPK nano-fertilizers application times, methods and rates on yield, yield components and fiber properties of Egyptian cotton (Gossypium barbadense L.). Giza 90 used in experiment belonging to the Egyptian cotton long staple grown at upper Egypt, early maturity, the first flower opening at 65 days after sowing, the first boll opening at 110 days after sowing and has fiber rough surface smoothness.
The experiment was laid out in a split- split-plot design in a complete randomized block design with four replications. Treatments included two application times (2 and 3 doses) were applied in main plots, two application methods (foliar and soil) in sub-plots and four rates applications of control (T1= 100% soil application traditional recommended NPK fertilizer dose (RFD), and nano NPK fertilizers; T2=12.5% RFD, T3= 25% RFD and T4= 50% RFD) were applied in sub-sub-plots. Each plot (experimental unit) had six ridges, each of 0.6 m in width and 4.0 m in length, occupying an area of 14.4 m2. All agronomic practices were keeping normal and uniformed for all the treatments. Nano-fertilizers were prepared in lab by ball-milling (Photon Company, Egypt) according to Eleyan et al. (2018) [16]. Transmission Electron Microscopy (TEM) used to investigated and measuring the size of the NPK fertilizers particle using JEOL transmission electron microscope (JEM-1400 TEM, Japan) according to Wang et al. (2014) [17]. The obtained investigated size ranged from 5.56 to 12.3 nm for N; 4.92 to 8.62 nm for P and 5.31 to 9.84 nm for K.The seeds were planted on the first week of April in both seasons in rows 60 cm apart and hills 20 cm apart where two plants per hill were left after thinning. The other agricultural practices were carried out according to the usual practices in the cotton fields. The preceding crop was barley without fertilization application in both seasons to consume the most of soil nutrients to appear the effect of nano-fertilizers application. Nitrogen at a level of 60 kg N fed-1 as ammonium sulfate (21% N), potassium at 48 kg K2O fed-1 as potassium sulphate (48% K2O) and Phosphorus at 30 kg P2O5 fed-1 as calcium super phosphate (15.5% P2O5) were partly split and side dressed directly before the 1st and 2nd irrigation in two times application while, at the 1st, 2nd and 32rd irrigations at three times applications for soil applications. Foliar solution rate was 600 liter fed-1. Surfactant (super film ®) was added according to the recommendation of its label. Standard methods for spraying were followed to avoid osmosis effect on plants. The application was carried out between 9 and 11am, using a knapsack sprayer.
A composite soil samples were collected from 0-30, 30-60 and 60-90 cm depth during the study years before planting and were prepared for analyses in laboratory. The particle size distribution, pH, EC, total CaCO3, organic matter (OM), total and available nitrogen (N), Phosphorus (P), Potassium (K) according to standard methods outline by Jackson (1973); Keeney and Nelson, (1982) [18,19]. Details of soil properties on the research site during years of the study (2016 and 2017) are given in (Table 1).
Yield and Yield Components: Ten guarded plants were taken at random from each plot to determine position of the first sympodial node, earliness (% ), number of sympodial branches per plant, number of open bolls/plant, boll weight (g), seed index (g), seed cotton yield per plant and seed cotton yield per fed. (kentar=157 kg and feddan = 4200 m2) was calculated from the two central rows, of each plot. Earliness (%) determined as percentage of seed cotton yield of first pick to total seed cotton per plot and lint percentage calculated from lint weight to seed cotton weight expressed as percentage.
Fiber Properties: The following fiber properties were measured: fiber length (mm), uniformity ratio (%) was determined by the digital fibrograph, fiber strength (Presley index) by using the pressely tester at zero gauge length and fiber fineness (micronair reading) measured by micronair apparatus. Fiber properties were measured in fiber laboratory at the department of agronomy, Faculty of Agriculture, Cairo University.
Statistical Analysis: The obtained data were subjected to statistical analysis of variance for each season, for all characters under study according to the procedure described by Snedecor and Cochron (1981) [20]. Significance of differences among variables was done according to Least Significant Differences test (LSD) at 5% level of probability. Finally, all statistical analyses were carried out using "MSTAT-C" computer software package (Freed et al., 1989) [21].
Position of the first Sympodial Node: Data in Table 2 show that neither fertilizers application times, nor methods of application and the interaction between them had a significant effect on position of the first sympodial node except application methods in second season. This effect was rather expected as the foliar application treatments were tried at flowering where the position of the first sympodial node was already defined. However, the application rates led to a significant effect on position of the first sympodial node in both seasons. The interaction between studied three factors cleared insignificant effect on the first sympodial node position. Use of nano 50% RFD was at par with control treatment in first season. However, use of nano12.5% RFD statistically at par with nano 25% RFD in in both seasons.
Earliness (%): Data in Table 2 show that neither fertilizers application times, nor methods of application and the interaction between them had a significant effect on earliness (%) except application times in second season. However, the application rates had a significant effect on earliness percentage during both seasons. Squaring, flower initiation, and boll opening of cotton plant delayed significantly under higher N fertilization than the unfertilized plot while the earliness attained in initial boll setting by the intermediate N rate, could be due to optimum nitrogen demand of the crop for the heavy nutrient sinks of cotton bolls to be opened. At the same time, higher rate of nitrogen prolonged vegetative growth and delayed opening period of bolls (Ayissa and Kebedeb, 2011) [22]. Sawan et al. (2008) reported that potassium application increases earliness of harvest [23]. Compared to common fertilizer, the nano-synergistic fertilizer had the function of promoting the maize precocity Liu et al. (2008c) [24]. The experiments of nano-fertilizer efficiency on radish, cabbage, eggplant, pepper, tomato, celery and leek crops were carried out and the results indicated that the nano-fertilizer led to the vegetables come into the market 5 to 7 days ahead of time Liu et al. (2009) [25]. Abdel-Aziz et al. (2016) found that The life cycle of the NPK nano-fertilized wheat plants was shorter than normal-fertilized wheat plants with the ratio of 23.5% (130 days compared with 170 days for yield production from date of sowing) [26]. Use of nano 50% RFD was at par with control treatment in both seasons. Also, use of nano 12.5% statistically at par with nano 25% RFD in in both seasons.
Number of Sympodial Branches per Plant: Data of sympodial branches per plant clear that the main effect of application methods showed that there is a significant increase in sympodial branches per plant in both seasons (Table 3). These increase was greater in foliar than soil applications (7.73 and 10.79% in first and second seasons, respectively). Also, results indicate that, a significant increase in sympodial branches per plant with increasing rates of fertilizers application in both seasons (Table 3 and Figure 1). Especially, significant increase was achieved when use of 50% RFD of nano NPK fertilizers which at par with control treatment in the second season. Also, nano-NPK fertilizers at 12.5% RFD recorded sympodial branches per plant statistically at par with nano-NPK fertilizers at 25% RFD in the first season. Increasing NPK fertilizers application levels increased the number of sympodial branches per plant; this might be due to the role of P to divert the plant towards the reproductive phase, because P has vital role in cell division, cell elongation and stimulate early flowering (Singh, 2003) [27]. A gradual increase in sympodial branches with the subsequent increases in the nitrogen application rates was also reported by Kumbhar et al. (2008) [28]. High amount of sympodial branches in a plant is an indication of higher potential of cotton crop for high production of seed cotton because these are considered the boll bearing branches (Hussien et al., 2015) [29].
Seed Index (g): Data in Table 4 and Figure 2 showed that the analysis of variance for seed index was influenced by application methods (B) and application rates (C), however, the interaction AC and BC being significant in second season only. Maximum seed index (9.11 g) was recorded in 3 times foliar application at 50% nano RFD and minimum (8.14 g) was recorded in 2 times soil application at 12.5% nano RFD, while each increment of fertilizers rates increased seed index. Our results confirmed the findings of Upadhyaya et al., (2017) and Meena et al., (2017) that P is essential for the biosynthesis of chlorophyll as pyridoxal must be present for its biosynthesis which ameliorated the mobilization of photosynthates and directly influenced boll weight that coincide with increased seed index [10,33].
Lint (%): Data in Table 4 and Figure 2 showed that the analysis of variance for lint percentage was influenced by application time (A) in second season only, application methods (B) and application rates (C) in both seasons, however, the interaction AB, BC and ABC being significant in both seasons (Table 4 and Figure 2). Maximum lint (40.54% ) was recorded at 3 times foliar application at 50% nano RFD and minimum (36.78% ) was recorded at 2 times soil application 12.5% nano RFD, while each increment of fertilizers rates increased lint (% ). A significant relationship (R2= 0.75) between lint (%) and seed cotton yield per plant. Deficiency of N adversely affecting lint yield through reductions in stem elongation, leaf expansion (Lu et al., 2001), photosynthetic and metabolic activities (Ciompi et al., 1996), and biomass production (Fritschi et al., 2003) [34,35].
Seed Cotton Yield per Plant: According to the results both of seed cotton yield per plant and per feddan significantly increased (P ≤ 0.05) with increasing the number of nano fertilizers splits (Table 4 and Figure 2). These increases as average in both seasons were 10.79% at 3 times comparing with 2 times application. The increase of seed cotton yield due to increase in boll weight which increased by split of fertilizers, also agreed with Yang et al., 2011; Shuaib et al., 2015 and Wajid et al., 2017) [4,30,36]. Also, results cleared that nano fertilizers application methods led to a significant increase (P ≤ 0.05) in both of seed cotton yield per plant and per feddan. The increase was higher in foliar than soil application which represents as average of both seasons 11.85% and 8.34%, respectively. The higher response may be due to the effect of foliar application led to production of sympodial branches, which increases in number of boll per plant to increase seed cotton yield. This trend is harmony with Taiz and Zeiger, 2010; Tarafdar et al., 2012a and Tarafdar et al., 2012b [12-14].
The obtained result indicates that increased trend in both of seed cotton yield per plant and per feddan with increasing rates of fertilizers application (Table 4). Significant differences (p ≤ 0.05) were achieved among the treatments of nano-fertilizers. This may be due to differences in fruiting branches, productive bolls and seed cotton weight per boll. Nitrogen application promoted photosynthetic rate, assimilates production and accumulation that ultimately boosted final seed cotton yield (Kumbhar et al., 2008) [28]. Nano 50% RFD was at par with control treatment, which means that nano 50% RFD might have met the demand of plant and any further addition of NPK may not be utilized by the plant leading to environment and economic concerns. Nano fertilizers increase availability of nutrient to the growing plant which increase chlorophyll formation, photosynthesis rate, dry matter production and result improve overall growth of the plant (Hediat and Salama, 2012) [37]. Data in Table 4 indicated that, the interaction between study factors cleared no significant effect on seed cotton yield per plant and per feddan except the interaction between the application times and methods rates (BC) and between the application methods and rates (BC) in second season.
Fiber properties: The measures of fiber quality, including the fiber length, length uniformity index, strength, and fiber fineness were positively affected by fertilizer treatment (Table 5). Fiber quality increased with the application of fertilizers times, methods and rates. However, statistical results of the study showed that, the application rates of NPK nano fertilizers significantly affected on studied fiber properties.
Also, times and methods of application on fiber length in first season and application methods on length uniformity Index second seasons. All the interaction between study factors cleared no significant effect on fiber quality parameters. These results were harmony with Jyothi et al. (2017) they reported that the interaction effect of nitrogen, phosphorus and potassium failed to exert significant influence on fiber quality parameters except for ginning out turn [38]. Nitrogen limitation during fiber development stage resulted in reduced fiber strength and quality. It has been reported that N deficiency decreased the fiber length and strength (Read et al., 2006) while increased the micronaire value (Reddy et al., 2004) [39,40]. A positive relationship was also found between fiber strength and N fertility (Fritschi et al., 2003) [35]. Ciompi et al., 1996) [34], (Fritschi et al., 2003) [35].
Application of nano-fertilizers have greater role in enhancing cotton yield production this will reduce the cost of fertilizer and also minimize the pollution hazard. Approximately, nano 50% RFD was at par with control treatment (traditional 100% RFD) and nano12.5% RFD also recorded statistically at par with nano 25% RFD in the most of studied parameters. This suggested that the use of nano-fertilizers can be enhanced and improve cotton growth and yield up to optimum applied times, methods and rates.

![]()

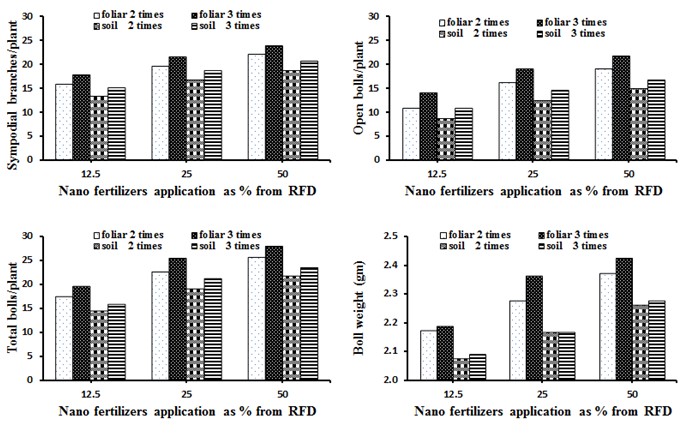 |
| Figure 1: Relationship between nano fertilizers application rates and cotton yield components |
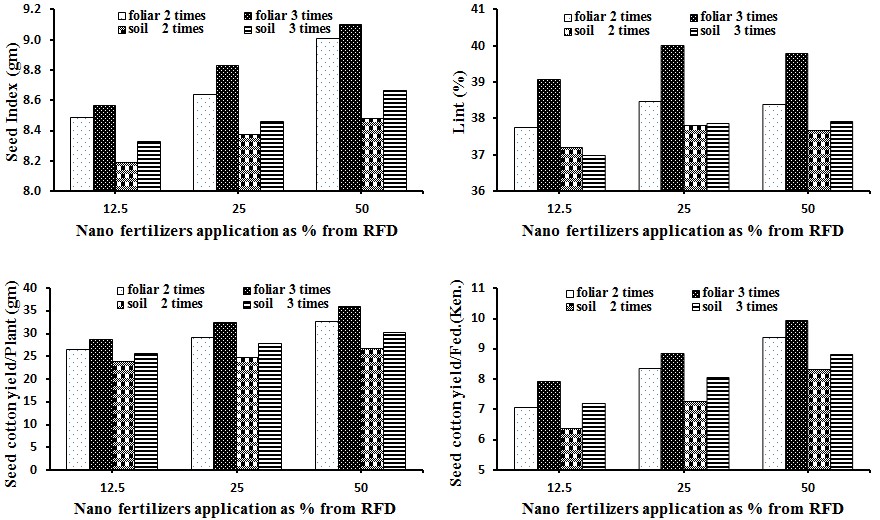 |
| Figure 2: Relationship between nano-fertilizers application rates and each of seed index, lint%, seed cotton yield per plant and seed cotton yield per fed |
Soil characteristics |
seasons |
||||||||||
2016 |
2017 |
||||||||||
Soil depth (cm) |
Soil depth (cm) |
||||||||||
0-30 |
30-60 |
60-90 |
0-30 |
30-60 |
60-90 |
||||||
Physical analysis: |
|||||||||||
C. Sand (% ) |
2.26 |
3.45 |
3.69 |
4.03 |
5.43 |
4.06 |
|||||
F. Sand (% ) |
35.7 |
35.6 |
40.0 |
30.9 |
31.8 |
39.6 |
|||||
Silt (% ) |
29.6 |
28.1 |
27.3 |
31.2 |
26.4 |
30.2 |
|||||
Clay (% ) |
32.5 |
32.9 |
29.0 |
33.9 |
35.4 |
27.2 |
|||||
Texture* |
C. L. |
C. L. |
C. L. |
C. L. |
C. L. |
C. L. |
|||||
Soil bulk density (g/cm3) |
1.11 |
1.25 |
1.40 |
1.20 |
1.27 |
1.35 |
|||||
Chemical analysis: |
|||||||||||
pH (paste extract) |
7.61 |
7.88 |
7.97 |
7.73 |
8.02 |
8.02 |
|||||
EC (dS/m) |
1.87 |
2.57 |
2.44 |
1.91 |
2.58 |
2.77 |
|||||
Calcium carbonate (% ) |
3.67 |
3.02 |
4.16 |
3.47 |
3.30 |
3.97 |
|||||
Organic matter (% ) |
2.25 |
1.69 |
1.31 |
2.09 |
1.60 |
1.97 |
|||||
Available nutrients (mgkg-1) |
|||||||||||
Nitrogen |
30. 8 |
22.2 |
16. 6 |
31.3 |
24.7 |
12.2 |
|||||
Phosphorus |
8.23 |
6.43 |
6.21 |
8.86 |
7.26 |
6.89 |
|||||
Potassium |
223 |
211 |
210 |
212 |
210 |
203 |
|||||
Total nutrients |
|||||||||||
Nitrogen (mgkg-1) |
940 |
650 |
540 |
910 |
710 |
640 |
|||||
Phosphorus (mgkg-1) |
660 |
590 |
540 |
710 |
650 |
560 |
|||||
Potassium (% ) |
2.12 |
2.10 |
2.05 |
2.25 |
2.15 |
2.10 |
|||||
| *C.L. = clay loam Table 1: Some physical and chemical analysis of the soil used in 2016 and 2017 during the cotton growing seasons |
|||||||||||
Fertilizers application |
Position of 1st sympodial node |
Earliness(% ) |
|||||||
Times (A) |
Methods (B) |
Rates* (C) |
2016 |
2017 |
2016 |
2017 |
|||
2 |
Foliar |
T1 |
6.82 |
7.15 |
65.48 |
63.22 |
|||
T2 |
6.97 |
7.18 |
59.30 |
57.27 |
|||||
T3 |
6.62 |
6.52 |
61.04 |
59.40 |
|||||
T4 |
6.23 |
6.34 |
64.71 |
63.46 |
|||||
mean |
|
6.66 |
6.79 |
62.63 |
60.84 |
||||
Soil |
T1 |
6.82 |
7.15 |
65.48 |
63.22 |
||||
T2 |
6.78 |
7.03 |
58.12 |
59.08 |
|||||
T3 |
6.78 |
7.06 |
61.00 |
60.44 |
|||||
T4 |
6.63 |
6.50 |
63.65 |
62.55 |
|||||
|
Mean |
|
6.75 |
6.93 |
62.06 |
61.32 |
|||
Mean |
|
|
6.71 |
6.86 |
62.35 |
61.08 |
|||
3 |
Foliar |
T1 |
6.50 |
6.63 |
65.99 |
64.99 |
|||
T2 |
6.50 |
6.74 |
60.91 |
60.80 |
|||||
T3 |
6.30 |
6.33 |
62.65 |
62.77 |
|||||
T4 |
5.98 |
6.17 |
64.11 |
64.05 |
|||||
Mean |
|
6.32 |
6.47 |
63.41 |
63.15 |
||||
Soil |
T1 |
6.50 |
6.63 |
65.99 |
64.96 |
||||
T2 |
6.73 |
7.08 |
62.94 |
60.89 |
|||||
T3 |
6.45 |
6.89 |
64.22 |
61.66 |
|||||
T4 |
6.60 |
6.70 |
65.07 |
64.60 |
|||||
|
Mean |
|
6.57 |
6.82 |
64.55 |
63.03 |
|||
Mean |
|
|
6.45 |
6.65 |
63.98 |
63.09 |
|||
Methods (B) |
Foliar |
|
6.49 |
6.63 |
63.02 |
61.99 |
|||
Soil |
|
6.66 |
6.87 |
63.31 |
62.17 |
||||
Rates (C) |
|
T1 |
6.66 |
6.89 |
65.73 |
64.09 |
|||
|
T2 |
6.75 |
7.01 |
60.32 |
59.51 |
||||
|
T3 |
6.54 |
6.70 |
62.23 |
61.07 |
||||
|
T4 |
6.36 |
6.43 |
64.38 |
63.66 |
||||
L.S.D at 0.05 % level |
A |
|
NS |
NS |
NS |
1.163 |
|||
B |
|
NS |
0.189 |
NS |
NS |
||||
C |
|
0.37 |
0.37 |
2.21 |
1.64 |
||||
AB |
|
NS |
NS |
NS |
NS |
||||
AC |
|
NS |
NS |
NS |
NS |
||||
BC |
|
NS |
NS |
NS |
NS |
||||
ABC |
|
NS |
NS |
NS |
NS |
||||
| Table 2 : Position of 1st sympodial node and earliness traits of cotton as influenced by NPK nano-fertilizers application times, methods and rates during 2016 and 2017 seasons | |||||||||
Fertilizers application |
Sympodial |
Total bolls/plant |
Open bolls/plant |
Boll Weight (g) |
|||||||||
Times |
Methods |
Rates (C) |
2016 |
2017 |
2016 |
2017 |
2016 |
2017 |
2016 |
2017 |
|||
2 |
Foliar |
T1 |
16.15 |
16.54 |
24.80 |
23.43 |
17.60 |
16.70 |
2.29 |
2.17 |
|||
T2 |
14.66 |
13.37 |
17.98 |
16.70 |
11.08 |
10.55 |
2.16 |
2.18 |
|||||
T3 |
15.55 |
15.71 |
23.43 |
21.58 |
16.73 |
15.60 |
2.30 |
2.25 |
|||||
T4 |
17.45 |
17.74 |
26.28 |
24.90 |
19.48 |
18.56 |
2.39 |
2.35 |
|||||
Mean |
|
15.95 |
15.83 |
23.12 |
21.65 |
16.22 |
15.35 |
2.29 |
2.24 |
||||
Soil |
T1 |
16.15 |
16.54 |
24.80 |
23.43 |
17.60 |
16.70 |
2.29 |
2.17 |
||||
T2 |
14.06 |
11.40 |
14.99 |
13.60 |
8.92 |
8.09 |
2.09 |
2.05 |
|||||
T3 |
14.69 |
13.12 |
20.01 |
18.04 |
12.79 |
11.99 |
2.19 |
2.14 |
|||||
T4 |
17.09 |
14.44 |
22.81 |
20.60 |
15.32 |
14.31 |
2.26 |
2.26 |
|||||
Mean |
|
15.49 |
13.87 |
20.65 |
18.92 |
13.66 |
12.77 |
2.21 |
2.15 |
||||
Mean |
|
|
15.73 |
14.86 |
21.89 |
20.29 |
14.94 |
14.06 |
2.25 |
2.19 |
|||
3 |
Foliar |
T1 |
17.85 |
17.22 |
27.14 |
25.92 |
19.79 |
19.17 |
2.38 |
2.31 |
|||
T2 |
18.45 |
15.07 |
20.34 |
18.61 |
14.79 |
13.21 |
2.20 |
2.17 |
|||||
T3 |
18.83 |
16.85 |
25.96 |
24.77 |
19.34 |
18.48 |
2.39 |
2.33 |
|||||
T4 |
20.62 |
18.88 |
28.69 |
27.21 |
22.20 |
21.31 |
2.43 |
2.42 |
|||||
Mean |
|
18.94 |
17.00 |
25.53 |
24.13 |
19.03 |
18.04 |
2.35 |
2.31 |
||||
Soil |
T1 |
17.85 |
17.22 |
27.14 |
25.92 |
19.79 |
19.17 |
2.38 |
2.31 |
||||
T2 |
15.68 |
13.80 |
16.15 |
15.43 |
11.04 |
10.44 |
2.07 |
2.10 |
|||||
T3 |
17.29 |
15.20 |
22.07 |
20.06 |
15.29 |
13.84 |
2.16 |
2.17 |
|||||
T4 |
17.15 |
16.85 |
24.49 |
22.32 |
17.29 |
16.04 |
2.28 |
2.27 |
|||||
Mean |
|
16.89 |
15.77 |
22.39 |
20.93 |
15.85 |
14.87 |
2.22 |
2.21 |
||||
Mean |
|
|
17.91 |
16.38 |
23.96 |
22.53 |
17.44 |
16.46 |
2.29 |
2.26 |
|||
Methods (B) |
Foliar |
|
17.44 |
16.42 |
24.33 |
22.89 |
17.63 |
16.70 |
2.32 |
2.27 |
|||
Soil |
|
16.19 |
14.82 |
21.52 |
19.92 |
14.76 |
13.82 |
2.21 |
2.18 |
||||
Types (C) |
|
T1 |
16.89 |
16.87 |
25.97 |
24.67 |
18.70 |
17.93 |
2.34 |
2.24 |
|||
|
T2 |
15.71 |
13.40 |
17.37 |
16.09 |
11.46 |
10.57 |
2.13 |
2.12 |
||||
|
T3 |
16.59 |
15.22 |
22.87 |
21.11 |
16.04 |
14.97 |
2.26 |
2.22 |
||||
|
T4 |
18.08 |
16.97 |
25.49 |
23.76 |
18.57 |
17.55 |
3.34 |
2.33 |
||||
L.S.D at 0.05 level |
A |
|
NS |
NS |
0.44 |
0.771 |
0.75 |
0.68 |
NS |
0.06 |
|||
B |
|
0.89 |
0.96 |
1.07 |
0.51 |
0.48 |
0.23 |
0.05 |
0.04 |
||||
C |
|
0.88 |
1.58 |
0.77 |
0.63 |
0.48 |
0.55 |
0.06 |
0.04 |
||||
AB |
|
NS |
NS |
0.16 |
0.71 |
NS |
0.32 |
NS |
NS |
||||
AC |
|
NS |
NS |
NS |
NS |
NS |
NS |
NS |
0.05 |
||||
BC |
|
NS |
NS |
1.11 |
0.91 |
0.70 |
0.80 |
0.09 |
0.05 |
||||
ABC |
|
NS |
NS |
NS |
NS |
NS |
NS |
NS |
NS |
||||
| Table 3 : Yield and yield components of cotton as influenced by NPK nano fertilizers application times, methods and rates during 2016 and 2017 seasons | |||||||||||||
Fertilizers application |
Seed Index (g) |
Lint |
Seed cotton |
Seed cotton |
|||||||||
Times |
Methods |
Rates |
2016 |
2017 |
2016 |
2017 |
2016 |
2017 |
2016 |
2017 |
|||
2 |
Foliar |
T1 |
8.66 |
8.60 |
38.19 |
38.02 |
30.71 |
28.41 |
9.34 |
9.10 |
|||
T2 |
8.49 |
8.48 |
37.93 |
36.93 |
27.25 |
25.81 |
7.30 |
6.81 |
|||||
T3 |
8.68 |
8.59 |
38.46 |
37.57 |
29.87 |
28.15 |
8.63 |
8.03 |
|||||
T4 |
8.99 |
9.02 |
39.03 |
38.43 |
33.78 |
31.65 |
9.57 |
9.19 |
|||||
Mean |
|
8.70 |
8.67 |
38.40 |
37.74 |
30.40 |
28.50 |
8.71 |
8.28 |
||||
Soil |
T1 |
8.66 |
8.60 |
38.19 |
38.02 |
30.71 |
28.41 |
9.34 |
9.10 |
||||
T2 |
8.14 |
8.24 |
37.26 |
36.29 |
23.75 |
23.90 |
6.76 |
5.97 |
|||||
T3 |
8.44 |
8.31 |
37.79 |
37.13 |
25.01 |
24.63 |
7.39 |
7.13 |
|||||
T4 |
8.51 |
8.44 |
38.01 |
37.79 |
27.48 |
26.10 |
8.27 |
8.38 |
|||||
Mean |
|
8.44 |
8.39 |
37.81 |
37.31 |
26.73 |
25.76 |
7.94 |
7.64 |
||||
Mean |
|
|
8.57 |
8.54 |
38.11 |
37.52 |
28.57 |
27.13 |
8.33 |
7.96 |
|||
3 |
Foliar |
T1 |
8.90 |
8.99 |
38.52 |
38.54 |
33.70 |
32.59 |
10.18 |
9.77 |
|||
T2 |
8.54 |
8.59 |
39.07 |
38.53 |
28.76 |
28.66 |
7.87 |
7.95 |
|||||
T3 |
8.73 |
8.92 |
39.26 |
39.05 |
32.07 |
32.85 |
8.93 |
8.78 |
|||||
T4 |
9.11 |
9.08 |
40.32 |
40.76 |
35.83 |
35.85 |
10.15 |
9.72 |
|||||
Mean |
|
8.82 |
8.89 |
39.29 |
39.22 |
32.59 |
32.49 |
9.28 |
9.05 |
||||
Soil |
T1 |
8.90 |
8.99 |
38.52 |
38.54 |
33.70 |
35.59 |
10.18 |
9.77 |
||||
T2 |
8.35 |
8.30 |
36.10 |
36.17 |
26.55 |
24.47. |
7.43 |
6.95 |
|||||
T3 |
8.48 |
8.43 |
37.76 |
37.83 |
29.83 |
25.83 |
8.21 |
7.86 |
|||||
T4 |
8.63 |
8.69 |
38.20 |
37.92 |
31.12 |
29.32 |
8.88 |
8.74 |
|||||
Mean |
|
8.59 |
8.60 |
37.65 |
37.62 |
30.30 |
28.05 |
8.67 |
8.33 |
||||
Mean |
|
|
8.70 |
8.75 |
38.47 |
38.42 |
31.44 |
30.27 |
8.98 |
8.69 |
|||
Methods (B) |
Foliar |
|
8.76 |
8.78 |
38.85 |
38.48 |
31.50 |
30.50 |
8.99 |
8.67 |
|||
Soil |
|
8.52 |
8.50 |
37.73 |
37.46 |
28.52 |
26.91 |
8.31 |
7.99 |
||||
Types (C) |
|
T1 |
8.78 |
8.79 |
38.35 |
38.28 |
32.21 |
30.50 |
9.76 |
9.44 |
|||
|
T2 |
8.38 |
8.40 |
37.59 |
36.98 |
26.58 |
25.71 |
7.34 |
6.92 |
||||
|
T3 |
8.58 |
8.56 |
38.32 |
37.90 |
29.20 |
27.86 |
8.29 |
7.95 |
||||
|
T4 |
8.81 |
8.81 |
38.89 |
38.73 |
32.05 |
30.73 |
9.22 |
9.01 |
||||
L.S.D at 0.05 level |
A |
|
NS |
NS |
NS |
0.08 |
0.68 |
1.10 |
NS |
NS |
|||
B |
|
0.15 |
0.10 |
0.32 |
0.18 |
2.59 |
0.65 |
0.26 |
0.30 |
||||
C |
|
0.20 |
0.10 |
0.39 |
0.43 |
2.32 |
1.41 |
0.61 |
0.48 |
||||
AB |
|
NS |
NS |
0.45 |
0.25 |
NS |
0.92 |
NS |
0.42 |
||||
AC |
|
NS |
0.15 |
NS |
NS |
NS |
NS |
NS |
NS |
||||
BC |
|
NS |
0.16 |
0.57 |
0.62 |
NS |
2.04 |
NS |
0.69 |
||||
ABC |
|
NS |
NS |
0.80 |
0.88 |
NS |
NS |
NS |
NS |
||||
| Table 4 : Yield and yield components of cotton as influenced by NPK nano-fertilizers application times, methods and rates during 2016 and 2017 seasons | |||||||||||||
Fertilizers application |
Fiber length |
Length uniformity |
Fiber strength |
Fiber fineness |
|||||||||
Times |
Methods |
Rates |
2016 |
2017 |
2016 |
2017 |
2016 |
2017 |
2016 |
2017 |
|||
2 |
Foliar |
T1 |
30.90 |
29.70 |
82.98 |
82.60 |
9.67 |
9.55 |
4.03 |
4.27 |
|||
T2 |
30.73 |
29.00 |
82.63 |
82.93 |
9.03 |
9.70 |
3.83 |
4.20 |
|||||
T3 |
31.27 |
29.13 |
83.48 |
83.07 |
9.77 |
9.90 |
3.87 |
4.10 |
|||||
T4 |
31.40 |
29.37 |
84.23 |
84.13 |
9.93 |
10.07 |
3.67 |
4.00 |
|||||
Mean |
|
31.07 |
29.30 |
83.33 |
83.18 |
9.60 |
9.80 |
3.85 |
4.14 |
||||
Soil |
T1 |
30.90 |
29.70 |
82.98 |
82.60 |
9.67 |
9.55 |
4.03 |
4.27 |
||||
T2 |
30.13 |
28.83 |
82.17 |
82.33 |
8.90 |
9.05 |
4.07 |
4.30 |
|||||
T3 |
30.93 |
28.25 |
83.07 |
82.20 |
8.67 |
9.10 |
4.00 |
4.15 |
|||||
T4 |
31.03 |
29.07 |
83.57 |
82.85 |
9.26 |
9.70 |
3.93 |
4.05 |
|||||
Mean |
|
30.75 |
28.96 |
82.95 |
82.49 |
9.12 |
9.35 |
4.01 |
4.19 |
||||
Mean |
|
|
30.91 |
29.13 |
83.14 |
82.84 |
9.36 |
9.58 |
3.93 |
4.17 |
|||
3 |
Foliar |
T1 |
31.03 |
30.30 |
83.50 |
82.93 |
10.03 |
9.73 |
4.00 |
4.20 |
|||
T2 |
30.40 |
29.67 |
82.80 |
83.00 |
9.43 |
9.07 |
3.97 |
4.20 |
|||||
T3 |
30.80 |
30.63 |
83.47 |
83.40 |
9.50 |
10.13 |
3.80 |
4.13 |
|||||
T4 |
31.57 |
30.17 |
83.50 |
84.07 |
9.43 |
9.87 |
3.80 |
4.07 |
|||||
Mean |
|
30.95 |
30.19 |
83.32 |
83.35 |
9.60 |
9.70 |
3.89 |
4.15 |
||||
Soil |
T1 |
31.03 |
30.30 |
83.50 |
82.93 |
10.03 |
9.73 |
4.00 |
4.20 |
||||
T2 |
29.63 |
28.70 |
82.40 |
82.73 |
9.23 |
9.00 |
3.99 |
4.13 |
|||||
T3 |
30.63 |
29.30 |
82.90 |
82.70 |
9.40 |
9.83 |
4.00 |
4.13 |
|||||
T4 |
30.90 |
30.40 |
83.07 |
83.40 |
9.10 |
9.80 |
3.93 |
4.15 |
|||||
Mean |
|
30.55 |
29.67 |
82.97 |
82.94 |
9.44 |
9.59 |
3.98 |
4.15 |
||||
Mean |
|
|
30.75 |
29.93 |
83.14 |
83.15 |
9.52 |
9.65 |
3.94 |
4.15 |
|||
Methods (B) |
Foliar |
|
31.01 |
29.75 |
83.32 |
83.27 |
9.60 |
9.75 |
3.87 |
4.15 |
|||
Soil |
|
30.65 |
29.32 |
82.96 |
82.72 |
9.28 |
9.47 |
3.99 |
4.17 |
||||
Types (C) |
|
T1 |
30.97 |
30.00 |
83.24 |
82.77 |
9.85 |
9.64 |
4.01 |
4.23 |
|||
|
T2 |
30.22 |
29.05 |
82.50 |
82.75 |
9.15 |
9.20 |
3.97 |
4.21 |
||||
|
T3 |
30.91 |
29.33 |
83.23 |
82.84 |
9.33 |
9.74 |
3.92 |
4.13 |
||||
|
T4 |
31.22 |
29.75 |
83.59 |
83.61 |
9.43 |
9.86 |
3.83 |
4.07 |
||||
L.S.D at 0.05 level |
A |
|
NS |
0.16 |
NS |
NS |
NS |
NS |
NS |
NS |
|||
B |
|
NS |
0.40 |
NS |
0.25 |
NS |
NS |
NS |
NS |
||||
C |
|
0.48 |
0.60 |
0.64 |
0.60 |
0.36 |
0.23 |
0.11 |
0.12 |
||||
AB |
|
NS |
NS |
NS |
NS |
NS |
0.09 |
NS |
NS |
||||
AC |
|
NS |
NS |
NS |
NS |
NS |
0.34 |
NS |
NS |
||||
BC |
|
NS |
NS |
NS |
NS |
NS |
NS |
NS |
NS |
||||
ABC |
|
NS |
NS |
NS |
NS |
NS |
NS |
NS |
NS |
||||
| Table 5 : Fiber properties of cotton as influenced by NPK nano fertilizers application times, methods and rates during 2016 and 2017 seasons | |||||||||||||


