Open Access
Research Article
Max Screen >>
ISSN: 2455-7633
Copyright: © 2017 Soriano R. This is an open-access article distributed under the terms of the Creative Commons Attribution License, which permits unrestricted use, distribution, and reproduction in any medium, provided the original author and source are credited.
Related article at Pubmed, Google Scholar
Our research study on diabetic patients in a community in South Texas have shown that increasing age, male gender, married status, smoking history, limited education, and birth in Mexico are risk factors for observed increasing HbA1c and FBG. Elevated lipoprotein levels are particularly observed in type 2 diabetes. Low insulin levels and high BMI in this high risk population correlate to the severity of their diabetes. Moreover we have observed that being born in Mexico influences the patient’s method of treatment with use of oral or combined oral and parenteral routes with poor control of their diabetes. Perhaps the Hispanics born in Mexico may have limited knowledge of their disease influenced by their educational level, socioeconomic status, and prior misconceptions on appropriate methods of treatment(s).
In conclusion, the primary purpose of this research paper was to characterize the epidemiologic variables affecting the severity of diabetes and its complications and observe for trends that will help identify and target risk factors so as to advocate the most appropriate therapeutic regimen for the affected population.
Keywords: Lipoprotein; Fasting blood glucose; Insulin
Diabetes is a serious pathological medical condition that reflects the body’s inability to regulate the amount of glucose present in the bloodstream. According to the World Health Organization it affects approximately 380 million people worldwide with hundreds of millions more expected to acquire the condition. Of the numerous forms of diabetes, the two most common forms are Type 1 and Type 2. Type 1 is juvenile-onset diabetes, an autoimmune genetic disorder with deficient insulin production in the pancreatic beta cells. Without insulin there is abnormal metabolism of glucose throughout the body that may lead to nerve damage and vascular complications in the eyes and kidneys. Uncontrolled diabetes may result in diabetic ketoacidosis or non-ketotic hyperosmolar syndrome. Potential coma and death may ensue.
Type 2 diabetes is usually of adult onset in which the body is insulin resistant. People with high body mass index (BMI) and a sedentary lifestyle are at increased risk for cardiovascular complications. Treatment strategies vary for the types of diabetes. It is essential for affected individuals to utilize appropriate available therapies and lifestyle changes. Individuals with Type 2 diabetes can readily access many available treatments through healthcare professionals and educational support groups.
Body Mass Index (BMI) measures a person’s weight relative to their height [1]. It is a basic representation of an individual’s overall level of obesity or body fatness. Another important laboratory parameter pertains to Impaired Fasting Glucose (IFG). This is a pre-diabetic state in which a person presents a high amount of glucose in the body [2]. However, this situation is inadequate in itself to warrant diagnosing of a person with diabetes. Fasting Blood Glucose (FBG) is a variable that represents the amount of glucose in the bloodstream after a long period without food intake [3]. This aspect is particularly significant; it may determine if a person truly has diabetes, and the extent to which it occurs, especially if IFG readings can be inconclusive. Thus, FBG may provide insight on the efficiency of the hormonal insulin system. Hemoglobin A1C (HbA1C) entails the ratio of red blood cells present in the bloodstream to those which are glycosylated [4]. In Diabetes, having a lower percentage of such reflects greater control over blood glucose levels; consequently, this may reflect the regulation level of glucose circulation in the bloodstream during fasting periods. A final important laboratory parameter represents lipoprotein concentrations. As a particle in the bloodstream that transports cholesterol, fats, and proteins, increased deposits on the arterial walls may negatively affect the circulation of blood glucose [5]. This provides another physiological connection on the body’s failure to effectively regulate the circulation of glucose, thereby adding another dimension to the cause of Diabetes.
This research consisted of data analysis on statistics obtained from 300 South Texas adult males and females affected with Type 1 and 2 Diabetes. Research was conducted independently at the University of Texas at Brownsville. Four laboratory parameters and anthropometric variables of height and weight were measured to calculate the body mass index (BMI). The laboratory variables were: fasting blood glucose (FBG), hemoglobin A1C (HbA1C), insulin concentration levels, and lipoprotein concentrations. In addition, 6 variables relating to demographic information served to obtain data on age, gender, place of birth, marital status, educational experience, and smoking history. Patients were asked their method or route of treatment, oral, parenteral or both. Combinations of two variables were obtained and juxtaposed for data analysis on Excel. They were observed for trends, relationships, and comparisons. More importantly, the scientific background for the interrelationship of the variables was researched by obtaining, analyzing, and applying relevant literature review from Web-based medical articles. We analyzed the 20 combinations of multivariable pairs from the 11 variables. Observations across the combination of variables would shed light on different epidemiologic and laboratory aspects of diabetes as it affects the specific population.
A data table and multivariable graph (Figure 1) were constructed to identify and demonstrate the relationship between the patients’ method of treating their diabetes, oral or parenteral medication or both methods, versus whether or not they were informed by the physicians in the clinical study of their diabetic condition. According to the results, the vast majority of the individuals (89) in the study were not informed of their diabetic condition, whereas the remaining 11 were informed of their diabetic condition. The individuals that knew of their diabetic condition were attempting to seek further confirmation or treatment. The results of the data table produced 3 different types of outcomes. The first outcome consisted of those who were not told that they had diabetes utilized both oral and parenteral medications, perhaps due to lack of knowledge to treat the disorder. The second outcome consisted of those who were not only uninformed of their diabetes, but also did not utilize either oral or parenteral medications. This is probably because they presumed they were healthy and it was unnecessary for them to perform further action. The third outcome was that of those who were informed of having diabetes and took parenteral medications via the subcutaneous route. In this third group, the study participants realized the severity of their diagnosis and as a result became well-informed of the long-term consequences thereby adhering to the most effective mode of treatment.
The implication of the 3 outcomes demonstrate the importance of immediate patient education and feedback and most especially, the interaction with the physician to help them understand their condition and ensure treatment compliance.
According to Barnett and Kumar, social support groups such as family, friends, physicians, and community support greatly affect behavior modification specifically with regards to weight control. Furthermore, one of their studies compared the treatment drug Sibutramine with lifestyle modification program (Table 1). They concluded that support groups were influenced greatly to undergo significant weight loss more than any other type of treatment [6].
In the demographic analysis of patient data, there exists a connection between patient’s marital status and their Hemoglobin A1C (HbA1C). Marital status was categorized as the following: 1
For single, 2 for married, 3 for divorced, 4 for widowed, and 5 for unknown. Hemoglobin A1C is a test that measures how effectively a person responds to diabetes treatment: a value <5.7 is normal, 5.7 to 6.4 pre-diabetes, and >6.5 diabetes. According to the results seen in Table, we can see that the individuals who self-reported their values of 1, 3, 4, or 5 for their marital status more frequently registered single-digit values of HbA1C than those who were married. The participant who reported as married registered the highest HbA1C value of 13.2. Conversely, a participant who identified himself as single provided the lowest HbA1C value of 3.6 (Table 2).
The general implications for these findings is that individuals who are single in the period following initial diagnosis and treatment of diabetes tend to respond better to treatment than those who are married. This could possibly reflect the individual’s greater control over his or her well-being, whereas in families, members are more attuned to other aspects of their lives, such as care for spouse, partners or children [7]. This result is in contrast with a study in 2014 that showed that unmarried individuals demonstrated 16% higher risk for type 2 diabetes than married men [8]. In particular, the study showed that widowhood was more consistently associated with increased relative risk.
Our results strongly support the ethnic or cultural disposition of this disease. It has been studied in Pima Indians in Arizona that intergenerational mechanisms play a role in diabetes [9]. The inherited thrifty genes play a role. As for the Hispanic population, it has been postulated that a type of fetal programming related to the hyperglycemic intrauterine environment influences early onset of type 2 diabetes [10]. Dabelea et al. noted that more than 70% with prenatal exposure to this environment develops type 2 diabetes at age 25-34 years. Compounding the situation are the ethnic specific lifestyles, active or sedentary, that influence levels of HbA1C (Table 3) [11].
The South Texas population sample significantly demonstrates the impact of ethnicity on access to healthcare treatment in the management of their diabetes. The socioeconomic status, cultural upbringing and race potentially affect their ability to affect treatment outcomes. The participants of this clinical study identified themselves as either having been born in Mexico or in the United States. According to the results of the data table, it was demonstrated that participants who were US-born generally tended to utilize parental medications only, while on the other hand, Mexican-born individuals were recorded to have used either both oral and parenteral modes of treatment or neither type of medication. In particular, 60% participants born in the US solely utilized subcutaneous injections as their diabetes treatment. As for those born in Mexico, 80% of the patients used either both routes of treatment or neither.
Based on these outcomes, it can be concluded from this South Texas population, that more US-born individuals had better access to medical care that may reflect higher socioeconomic status as well. Hispanic minorities from Mexico often face more severe degrees of diabetes as a result of sociocultural disadvantages with limited access to medical care [12].
The educational level of person with diabetes at the time of their participation in the clinical study greatly affects HbA1C levels. It reflects a person’s intellectual awareness, decision and commitment to treatment approaches. Educational level data was obtained on the number of precollege years of schooling prior to their participation in the study. According to the results of the data table, there was an inverse relationship between the two variables. It was observed from the data that individuals who had higher education were usually accompanied by relatively lower HbA1C test results, whereas those who underwent schooling for a short period often registered high HbA1C values, and in this study, HbA1C values of 10% or above [13].
It can be concluded that patients with higher level of education respond better to diabetes treatment. Supplemental studies that shed light on this phenomenon attest to the fact that self-management skills are vital to patients’ goal to overcome diabetes facilitated by a network of support groups consisting of family members, healthcare educators and socioeconomic environment.
A similar study performed on diabetic Southeast Asians have shown that one of the main reasons why such racial groups receive less treatment is because of the poor health choices, literacy limitations, and poor living standards [14]. The lack of understanding of the circumstances of their condition inhibits their willingness to fully accept effective healthcare treatment and delivery. It was stated that a lifestyle reflecting poor standards may either nullify the benefits of diabetes treatment or prevent individuals from facilitating proper administration of the drugs.
This research study also investigated the link between lipoprotein lipase (LPL) concentrations and BMI, a pivotal aspect in the overall nature of the onset of diabetes. The purpose of this comparison was to analyze the extent to which the presence of certain amounts of lipoprotein in these individuals has an effect on the BMI readings or mass composition of diabetic patients. Lipoprotein lipase is an enzyme composed of lipids and proteins that are often used to catalyze the formation and activity of micelles and lipid bilayers which results in lipid transport. Lipoprotein lipase is involved in lipoprotein uptake and metabolism. It is one of several enzymes involved in HDL metabolism and remodeling [15]. However it is still unknown whether its hepatobiliary transport is altered in type 2 diabetes (Borgreeve). The pathophysiology of diabetic dyslipidemia is still poorly defined [16]. However it is believed that the relative insulin deficiency dysregulates lipid metabolism. In this research we attempted to describe the relationship of LPL to BMI.
BMI is calculated by dividing weight in kilograms by square of height in meters, a high BMI can be an indicator of high fat and glucose composition. Values of this variable are measured on a scale of 1 for underweight (BMI <18.5), 2 for normal (BMI 18.5 to 24.9), 3 for overweight (BMI 25.0 to 29.9), 4 for obese (BMI 30-39.9), and 5 for morbidly obese (BMI >40).
According to the results of the data table, participants recorded as being underweight or normal usually displayed high LPL concentrations, while on the other hand, those rated as either a 3, 4, or 5 for their BMI readings often were accompanied by low LPL values. For example, a patient who registered a BMI scale of 2 was found to have an LPL level of 146 U/L, which was the highest of all numbers in this category. On the contrary, participants with a BMI scale of 4 and 5 registered an LPL concentration of 89 U/L and 87 U/L respectively. There was an overall inverse proportion, in which decreasing BMI accompanied increasing LPL concentrations, and vice versa.
During moderate exercise, pancreatic hormones such as insulin are at work, breaking down glucose to provide energy throughout the body. Higher LPL activity is also associated with frequent physical activity and exercise. It appears that LPL is strongly linked to insulin activity (Table 4) [17]. When placed into the context of high BMI readings in severe diabetes, this reflects little or no physical activity with lack of insulin or a high resistance to the hormone. Likewise, the LPL fail to transport cholesterol out of the bloodstream producing a dyslipidemia and impaired insulin transport. Thus, this fundamental principle stresses the importance of frequent physical activity and exercise to promote efficiency of the lipoprotein lipase, which are instrumental to the operation of pancreatic insulin.
We next identified the connection between gender and LPL concentrations. The purpose was to analyze how certain concentrations of LPL can affect both risk level and response of either gender when diagnosed with diabetes. Values were indicated by either a 1 or 2, representing a male or female, respectively. According to the results of the data table, both genders recorded relatively equivalent amounts and frequencies of LPL throughout the entire numerical range of this variable. More specific data analysis showed that the 5 highest LPL values of the female participants averaged to a value of 124.4 U/L, whereas the 5 highest LPL values for male individuals resulted in an average of 122.8 U/L. This indicates that females were recorded to have a slightly higher LPL concentration and activity than males.
As previously mentioned, having a higher amount of this biochemical substance results in more efficient insulin activity, thereby decreasing BMI and successfully regulating blood glucose levels. There are no major differences in the LPL activity based on basal levels of muscle and tissue activity in males and females [18]. Both genders fundamentally achieve similar levels of LPL activity to induce hormonal regulations in their own bodies [19]. However, the slight variation implies that since men have higher basal metabolic requirements, more physical effort is needed to ensure LPL activity to the desired level.
What effects do specific lipoprotein and insulin concentrations impose on each other in the prognosis of diabetes? Insulin is a pancreatic hormone that acts to decrease glucose concentrations in the bloodstream, particularly during fasting. According to the results of the data table, there is a generally observed inverse relationship between these two measured variables. As the amount of insulin increases in certain patients, lipoprotein was found to have decreased or at relatively lower levels, and vice versa. For example, a patient who was recorded to have an insulin concentration level of 14.2 mIU/ml corresponded with a lipoprotein value of 91. Conversely, an individual who registered an insulin concentration value of 5 produced a lipoprotein lipase density value of 124 U/L. Although there were instances in which participants in this clinical study contrasted such trend, the general outlook of the analysis of this data table showed that participants with insulin amounts under 100 mIU/ml more frequently displayed lipoprotein amounts of more than 100 U/L , and those with over 100 mIU/ml in the former displayed lipoprotein values of less than 100 U/L.
The scientific basis behind this observation is the fact that insulin-stimulating hormones are the main regulator of lipoprotein lipases (LPL), enzymes that catalyze the formation and activity of lipids. In particular, insulin acts on regulating transcription and post-translational activity of LPL [20]. Thus, if applied to this case, an inverse relationship between the two, low insulin, high lipoprotein, means stagnation of the latter due to lack of transcriptional machinery, and high insulin and low lipoprotein indicates efficient metabolism of lipoprotein due to an abundance of hormonal regulators enhancing the production and activation of LPL.
Smoking status was next analyzed as to its influence on lipoprotein concentration. Smoking was measured in terms of values of 1, 2, or 3, with each corresponding to yes, no and other. According to the results of the data table there were 11 participants identified as smokers with high lipoprotein values versus 6 individuals who had relatively high lipoprotein concentrations were non-smokers.
The importance of LPL as a biochemical marker working collaboratively with insulin, and the determination of a smoker or non-smoker status allows further insight into the potential consequences of LPL regulation, activity, and efficiency in the light of diabetes management. Smoking increases lipoprotein levels as a result of catecholamine release which promotes the circulation of free fatty acids [21]. Cholesterol esterification is prevented and in turn promotes the build-up of fat and lipid particles which is associated with insulin resistance in diabetes.
Another variable studied was the method of drug administration and its effect on lipoprotein concentrations. According to the results of the data table, it was observed that many of the individuals who utilized only parenteral treatment or both oral and parenteral administration of medications achieved high values of LPL concentrations. On the other hand those who used oral agents only recorded relatively lower LPL values. For example, a total of 40 patients who used either parenteral or both oral and parenteral methods achieved LPL concentrations of at least 100 U/L, whereas the remainder, who did not take any medications or just orally administered drugs, usually registered LPL values in the 90s and 80s (U/L). Furthermore, the individual who registered the highest LPL value of 146 U/L was recorded to have only used parental medications. Such findings indicate that although both types of medications are valuable to diabetes treatment, subcutaneous injections are more effective. Associating this principle with past analyses reveals that LPL and insulin work together, and that parenteral medication, in particular, are necessary to replenish pancreatic beta cells deficient in hormonal insulin as the patient advances in age. Further scientific studies demonstrate that the cholesteryl ester transfer (CET) is an insulin-dependent reaction. However, the pancreatic hormone itself is inadequate in facilitating the activity of the CET. LPL helps activate the CET [22]. This underscores the importance of regular parenteral medication to augment the role of LPL and consequently CET especially in postprandial metabolism.
Scientifically, these findings have been linked to the concept of insulin suppression of free fatty acid (FFA) [23]. Liver steroid hormones antagonize the function and efficiency of pancreatic hormones through lipid synthesis. A study by Laws et al concluded that FFA suppression was more prevalent in women (88%), than in men (66%) [24]. In Oral Glucose Tolerance Tests (OGTT), females were reported with better results and lower FFA levels, thus implying their ability to metabolize glucose more effectively.
Body Mass Index (BMI) of the diabetic participants was used to analyze the important role of obesity as the fundamental basis of the link between insulin resistance and diabetes. According to the data table, the results indicate that there is generally an inverse relationship between BMI and Insulin. That is, as BMI increases, the amount of insulin decreases, and vice versa. Specific numbers from the data table support this observation. For example, people who had normal weights (category 2) often displayed high insulin concentrations such as 11.4, 13.4, and 16.3. On the other hand, those who were categorized as morbidly obese (category 5) registered values such as 5 and 4.7.
When considering BMI in regards to the role of insulin, this reflects either a deficiency in the amount of this pancreatic hormone or a genetic mutation that damages insulin function or increases resistance to its hormonal activity [25]. Insulin resistance rises in accordance with increasing BMI (Barnett and Kumar, 2009). In obesity glucose conglomerates in the bloodstream, provides more density and concentration predisposing to procoagulant states such as atherosclerosis which leads to cardiovascular disease.
Another relationship investigated was between gender of the diabetic individuals and the amount of insulin detected. The rationale was to determine whether males or females had a less chance of acquiring diabetes or how effectively they would respond to treatment after being initially diagnosed. According to the data, it was observed that both male and female participants registered both high and low amounts of insulin. However, female individuals usually recorded more insulin concentrations than their male counterparts. The male patients that registered high HbA1C values not only had low insulin concentrations but contrasted with the low HbA1C and high insulin concentration in females. Of the total of 100 male participants in the study, insulin averaged 5.9 mIU/ml; females averaged a 6.3 mIU/ml.
What is the relationship between patient gender and HbA1C test results? According to the results provided, there seemed to be mixed results regarding whether males or females demonstrated either high or low HbA1C values. In particularly, a number of individuals of both genders were measured to have achieved HbA1C values of over 6.5%, and similar numbers of male and female participants were recorded to have HbA1C values of 6.5% and below. For example, one male registered an HbA1C result of 13.1%, and one female had a comparatively equal measurement at 13.2%. With respect to improvement as a response to diabetes, one of the male patients was recorded to have an HbA1C of 5.2%, and similarly, a female patient was indicated to have an HbA1C value as low as 4.8%. However, a further approach to reaching a concrete conclusion regarding the impact of gender on HbA1C outcomes consisted of determining which gender had more frequently registered high HbA1C values, specifically as high as double-digits. According to the data table, 11 male participants had registered an HbA1C of at least 10%, while only 6 females were recorded in having achieved that number.
Studies by Schroeder, Bayless, Daugherty, and Steiner from the Institute for Health Research, women had often had lower hemoglobin levels than in men. It may mean that anemia may prevent the passage and binding of glucose, thus slowing their release from the bloodstream [24]. A similar study on diabetic Koreans also demonstrated that females of child-bearing age had lower HbA1C values than males. This is attributed to the frequent and efficient turnover of erythrocytes during menstrual cycles. Such observations may indicate the importance of gender in those of Hispanic ethnicity living in the same geographic area.
HbA1C test levels and the amount of insulin in patients reveals the extent of their diabetes. As the value of HbA1C increases, the amount of insulin in the individuals decreases, and vice versa. For example, individuals in the clinical study with double digit HbA1C test results, such as 13.1%, 13.2%, and 10.8%, have insulin concentrations of 5.5 mIU/ml, 5 mIU/ml, and 5.4 mIU/ml, respectively. Conversely, individuals with otherwise low HbA1C test results, such as 4.8%, 5.1%, and 7.9%, have corresponding insulin quantities of 10.2 mIU/ml, 10.5 mIU/ml, and 14.2 mIU/ml, respectively.
Because high HbA1C test results indicate an excess of blood glucose concentrations in the time periods following initial treatment of diabetes, this means that insulin is largely ineffective and unable to exert its effects on the bloodstream. Low HbA1c test results reflect an otherwise successful, effective diabetes treatment, indicating large quantities of normally functioning insulin. According to research studies, drugs such as sulfonylureas, which are important to preserving beta cells from glucotoxicity, are used to maintain and restore the insulin function and structure in light of changes in blood glucose concentrations. HbA1C test values often decrease by 1.5 to 2 percentage values in those taking sulfonylureas (Hirsch).
Age plays a major role in influence in the HbA1C tests. In particular, comparison was made to determine whether patients improved in their response to initial diagnosis and treatment of diabetes as they progressively age. The ages of the patients in the clinical study ranged from 34 to 67 years. According to the results seen in the data table, initial observations would reveal no concrete trend with regards to determining if young or old individuals respond better to diabetes. However, further analysis reveals that the majority of patients from the late 40s and early 50s onward to the oldest age of 67 were recorded to have HbA1C values of at least 6.5% and above. This specific value is the marker on the HbA1C scale that indicates that a patient is diabetic, whereas anything lower than this number could characterize a patient as either pre-diabetic or normal. For example, 3 patients aged 64, 57, and 60 registered HbA1C values of 9.5%, 11.1%, and 10.6%, respectively. On the other hand, 3 patients at relatively younger ages, such as 37, 35, and 39, were recorded with HbA1C results of 5.6%, 6.4%, and 6.1%.
Although there were several outliers, that is, in which participants in each of these age groups switched characterizations of their HbA1C readings, in generally, it was found that most young and old diabetic participants were associated with low and high HbA1C values respectively. This trend supports the observation that HbA1C test results are positively correlated with increasing age. This means that there is a direct relationship between these two variables: as individual ages, he experiences an impaired glucose homeostasis. Consequently, this failure leads to uncontrolled, inadequate responses to hyperglycemia, leading to a high HbA1C value [26]. This conclusion reflects the importance of employing treatment drugs in clinical studies that not only gauge the extent of diabetes itself, but how critical it is to manage intake of carbohydrates and improve glucose metabolism in the elderly.
A patient’s place of birth or native ethnicity was also studied to determine their role in HbA1C values. Results of the data table show comparatively equally high HbA1C values. Preliminary analysis indicating that neither ethnicity demonstrates itself as being more efficient with regards to diabetes treatment. However, further breakdown of the data would reveal that there are more American-born patients who registered values of 5.7% or lower, representing the range a person responding normally and effectively to diabetes treatment. For example, 6 patients had HbA1C values falling under this range, with a lowest value of 3.6%. On the other hand, only 2.
Mexican-born participants registered under the normal range, with a lowest value of 4.8%. Such evidence suggests that people of non-Hispanic ethnicities often respond better to diabetes treatment as reflected by their HbA1C test results. The scientific background for this observation, according to studies that have specifically investigated this aspect of diabetes remains to be fully determined.
Although studies have shown similar trends in average HbA1Cvalues amongst Hispanics, African-Americans, and other minorities, there are a variety of factors that such outcome [27]. Aside from determinants such as BMI, insulin resistance, and beta-cell function, one of the main theories attest to the heritable variations in 2,3-diphosphoglycerate or 2,3-DPG (32). 2,3-DPG is a substance that not only transports RBCs in the bloodstream, but also catalyzes the formation of hemoglobin for HbA1c. It has greater affinity to deoxygenated hemoglobin promoting the release of remaining oxygen molecules to the tissues that need them.
It is postulated that Hispanics and African-American minorities have a deficiency in 2,3- DPG or an abnormal conformational change that prevents binding of this substance to glucose henceforth impairing its transport.
A participant’s place of birth was analyzed against their fasting blood glucose (FBG) levels. The FBG value of these patients represents the amount of glucose in their bloodstreams after having abstained from food intake for at least 8 hrs. The purpose of this comparison was to correlate patterns of glucose concentrations with respect to their ethnicity. FBG measured 100 mg/dL or less is categorized as normal, 100 to 125 mg/dL as prediabetes, 126 mg/dL and above as diabetes. According to the results of the data table, it was observed that Hispanics displayed higher FBG values more frequently than non-Hispanics. For example, 13 Hispanics demonstrated FBG values of at least 100 mg/dl compared to 11 non-Hispanics. The lowest FBG was 77 mg/dl in the former and 74 mg/dl in the latter.
These final two FBG values imply that individuals born from underdeveloped countries already pose a inherent risk for diabetes. Studies have shown that Hispanics and Blacks have a 2.39 and 2.4 risk respectively of impaired fasting glucose (IFG) levels. This may be due to multiple single-nucleotide polymorphism (SNP) across various ethnicities especially in Hispanic-Americans, thereby causing unpredictable allele frequency and higher chances for random mutation leading to differences in physiologic regulation of glucose metabolism [28].
Age may be considered as a fundamental determinant in the FBG levels of diabetic patients. The data table was analyzed by identifying individuals into 2 groups: 50-60 years and 30-40 years. According to the results of the data table, patients who were in the former group were registered to have a higher overall FBG average of 141 mg/dl, while individuals of the latter group had a relatively lower FBG average of 123 mg/dl. Such findings imply that elderly individuals who are diabetic or pre-diabetec are already predisposed to likely suffer from more consequences because a high FBG indicates a high insulin resistance. To illustrate, a person in the 30-40 years age group registered the lowest FBG of of 76 mg/dl of all participants; the lowest reading in the 50-60 years age group was 96 mg/dl, thereby further supporting the implication that older individuals are already predisposed to diabetes.
It has been scientifically proven that aging results in organ impairment and decreased efficiency of metabolic activity [29]. Thus, aging results in decreased insulin secretion and increased resistance to this pancreatic hormone, and consequently a higher concentration of glucose concentration in the bloodstream.
The relationship between BMI and smoking was studied. The purpose of this comparison was to determine the extent to which smoking affects the value of BMI in affected individuals which could promote or delay the onset of diabetes and its complications. The results of the data table show the following: a total of 35 participants provided responses; 19 were non-smokers and 16 were smokers. In the former group, 12 had BMI rating scales between 3 to 5, while the latter group had lower BMI rating scales between 1 to 2. It is postulated that smoking may delay progression of diabetes. Smoking suppresses appetite and increases physiologic metabolism of glucose.
One of the most important aspects of this study consisted of identifying the relationship between IFG and insulin. This was performed in order to understand how prior diabetes treatment medications affect the insulin levels in participants as a means of priming and preparing the body to resist changes in mass and fat content due to the onset of diabetes. IFG is a variable that represents having never taken any medication for the purpose of treating diabetes prior to the year 2010. It had been designated by the American Diabetic Association (ADA) as a method of delineating individuals with FBG levels between normal and diabetes or prediabetes. Assessment was either a 0 or 1, which indicates no or yes.
According to the results of the data table, it was observed that patients who identified themselves as not having taken treatment medications more than 5 years ago more frequently obtained higher concentrations of insulin than compared to those who indicated that they had utilized diabetes treatment over a longer period of time prior to their participation in the clinical study. The highest insulin concentration of the representative sample at 124.5 mIU/mlwas by an individual who had not taken any medication prior to 2010. Conversely, the lowest insulin value of 0.6 mIU/ml was in a patient who had treated himself for at least more than 5 years.
Such findings imply that treatment closer to the time of onset of diabetes allows the body to have a higher surplus of pancreatic insulin, decreasing further complications. The scientific observation supports the natural history of the progression of diabetes from IFG [30]. Early medical interventions that lower the risk of obesity also delay the extent of diabetic complications. Early treatments to prevent diabetes suppress the rate of deterioration of pathophysiological factors such as beta-cell and insulin resistance that ultimately affect glycemic control.
The last variable studied the relationship between the diabetic patients’ method of drug administration (oral vs parenteral) and its effects on BMI. Results demonstrate that diabetic individuals with normal weight, a scale of 2 for BMI, demonstrated use of only parenteral medications via subcutaneous injections. On the contrary, the individuals that were assessed with on the BMI scale with scores of 3,4, and 5 administered their medications via both oral and parenteral treatments or just use of oral medications. These observations suggest that subcutaneous injections are more effective in managing glucose and obesity than oral pills.
According to Lance Porter of Diabetes Positive, a transition from oral capsules to insulin injections does not necessarily mean that the patient is failing to maintain control of his blood glucose levels. Rather, it is important to remember that Type 2 diabetes is a chronic, ever-changing medical condition. Thus, the use of parenteral subcutaneous injections in order to promote further weight loss and long-term management of sugar concentrations in the bloodstream is a more effective mode of treatment in preventing complications in chronic therapy [31]. Subcutaneous injection of insulin compensates for the overall deficiency or for the genetically dysfunctional beta cells that induce feedback inhibition on the amount of glucose stored in the human body.
A platform was created for the analysis and identification of epidemiologic characteristics of a South Texas diabetic cohort and its relationship with disease control as well as implications in method of treatment and prevention of complications. Multiple demographic variables and laboratory values were analyzed for variances in disease severity and treatment outcomes.
A general or complete inability to circulate glucose throughout the bloodstream is predicated from the presence of fatty acids. The kidneys contribute to glucose regulation by facilitating processes such as gluconeogenesis and glycogenolysis. However, renal impairment significantly influences the onset of diabetes. The red blood cell glucose transporter GLUT1 expressed in the mesangial cells of the nephron, is regulated by glucose and oxygen [32]. Anemia results from damaged EPO-producing fibroblasts in the kidneys; excess glucose present inside and outside these organs [33-35]. This necessitates the administration of anemic treatment via EPO stimulating agents (ESAs) to compensate for this specific physiological dysfunction in renal disease.
In addition, ruHuEPO-induced injections have proved to be valuable in defense against diabetes [36].
For example, such treatments when applied to mouse models have demonstrated lower FBG levels and increased area of pancreatic beta cells, both of which deem favorable to the regulation of blood glucose concentrations. Another type of treatment that could be utilized in the representative South Texas population would be that of insulin-sensitive lipoprotein drugs.
Since diabetic individuals, especially those affected with Type 2, are known to suffer with abnormalities associated with lipoproteins and lipid congestion, it becomes imperative to focus on lipid control that would consequently restore the function of hormonal insulin [37]. Statins and fibrate medications are biochemical agents that greatly improve the symptoms and complications of diabetes. They particularly prevent the esterification of cholesterol, a precursor to the glucosal inhibition by triglycerides. Another treatment relates to that of niacin acid. Although accompanied with adverse side effects, this organic compound, if taken in higher doses, decreases insulin resistance, implying cooperation with the pancreatic hormone. Elderly individuals are recommended to receive at least moderate to high intensity statin therapy as cholesterol level is inversely correlated with increasing age. Although women, as previously mentioned, have better glycemic control than men, as they face higher prospects of dyslipidemia, it is recommended for them to employ regular coronary artery disease testing and aspirin treatment for the purpose of preventing diabetic complications in chronic disease.
An underlying improvement does not come without the importance of sociological factors. While many affected people may not realize the severity to which they are afflicted with this condition, diabetes is a serious disorder and societal organizations must employ painstaking measures to prevent it further complications. A supportive medical and social environment addressing ethnic and geriatric needs play a major role in the advocacy of individuals’ improvement of their diabetes. Healthy lifestyle changes advocated through frequent, accessible, educational talks about the scientific background behind diabetes will improve understanding of the disease process. Individuals with severe conditions need aggressive inpatient or outpatient treatment which includes education and lifestyle monitoring to prevent further complications [38].
Healthcare is not the only the responsibility of medical professionals. Local organizations must encourage and support diabetic individuals with regular exercise classes, provide for regular blood glucose monitoring, dietary counselling and modification, and help with regular medical appointments to ensure holistic diabetic management.
It is important that researchers of this serious medical condition not only understand the extent to which diabetes affects the mental, physical and chemical processes of the human body, but most especially, its impact and connection with other physiological orders. According to Hazel Dockrell at the TANDEM Consortium, people with diabetes are 3 times more likely to become afflicted with Tuberculosis [39]. From this scope of the research, it is implied that diabetes may present itself as the fundamental cause behind equally severe disorders in humans. Understanding the connection between two or more medical conditions affecting diabetes provides a full picture of how various body systems are interdependent of each other and the importance of regulating vital metabolic functions for prevention of complications.
In conclusion, the primary purpose of this research paper was to characterize the epidemiologic variables affecting the severity of diabetes and its complications and observe for trends that will help identify and target risk factors so as to advocate the most appropriate therapeutic regimen for the affected population.

![]()

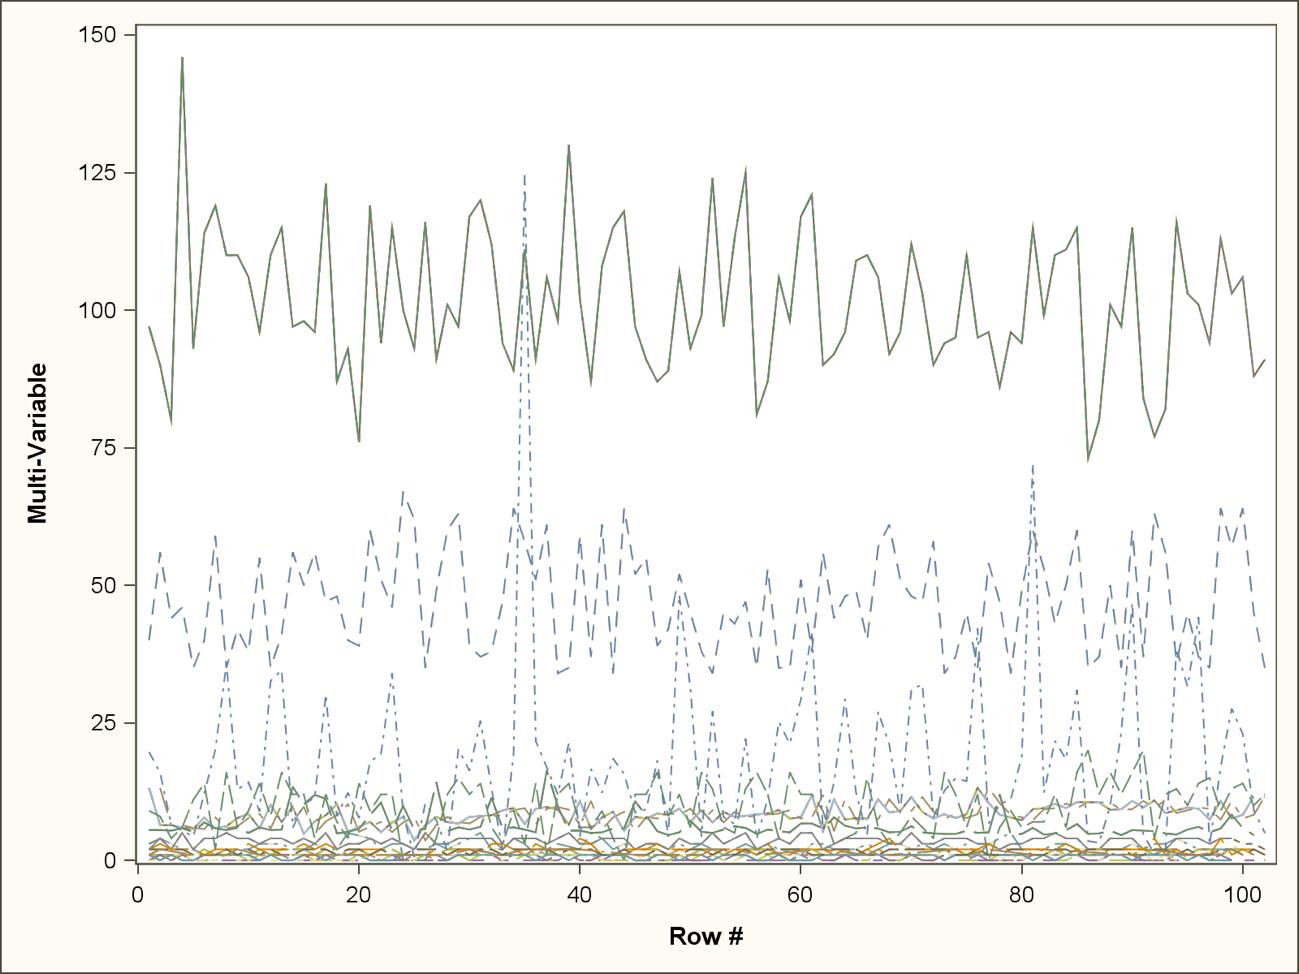 |
| Figure 1: Multivariable graph showing relationship of pairings of demographic variables, anthropometric data, laboratory values, and method of treatment |
Variable Pair color |
Independent Variable (x-axis) |
Dependent Variable (y-axis) |
|---|---|---|
Orange |
Informed of Diabetes |
Treatment method (oral, parenteral or both) |
Red |
Marital Status |
HbA1C level |
Orange |
Place of Birth |
Treatment method |
Yellow |
Education level |
HbA1C level |
Lime Green |
BMI |
Lipoprotein concentrationDark Green |
Dark Green |
Gender |
Lipoprotein concentration |
Turquoise |
Insulin |
Lipoprotein concentration |
Dark Blue |
Current smoker |
Lipoprotein concentration |
Purple |
Treatment method |
Lipoprotein concentration |
Light Green |
Insulin |
BMI |
Light Orange |
Gender |
Insulin |
Dark Orange |
Insulin |
HbA1C level |
Gray |
Gender |
HbA1C level |
Light Gray |
Age |
HbA1C level |
Yellow |
Place of Birth |
HbA1C level |
Dark Green |
Place of Birth |
FBG |
Red |
Age |
FBG |
Light Blue |
Current smoker |
BMI |
Purple |
Insulin |
IFG |
Light Orange |
Treatment method |
BMI |
Table 1: Paired variables to the color-coded graph in Figure 1 |
||
 |
| Table 2: Tabulated data of values of the demographic and anthropometric data, laboratory variables and method of treatment that were paired in Table 1 |
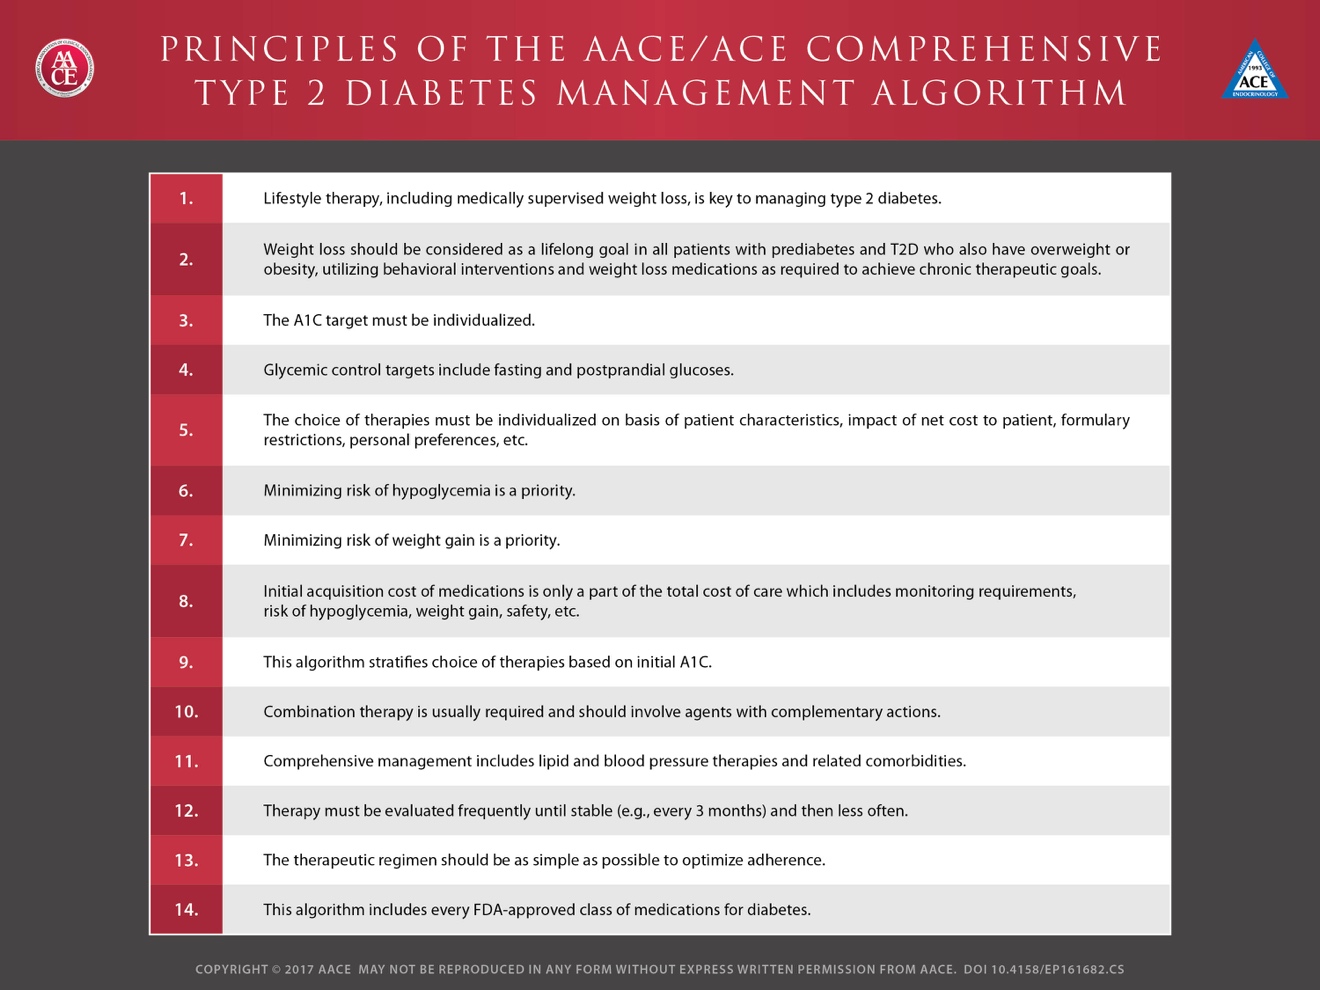 |
| Table 3: The American Association of Clinical Endocrinologists (AACE) and American College of Endocrinology Comprehensive Type 2 Diabetes Management Algorithm- 2017 (copyright permission obtained) |
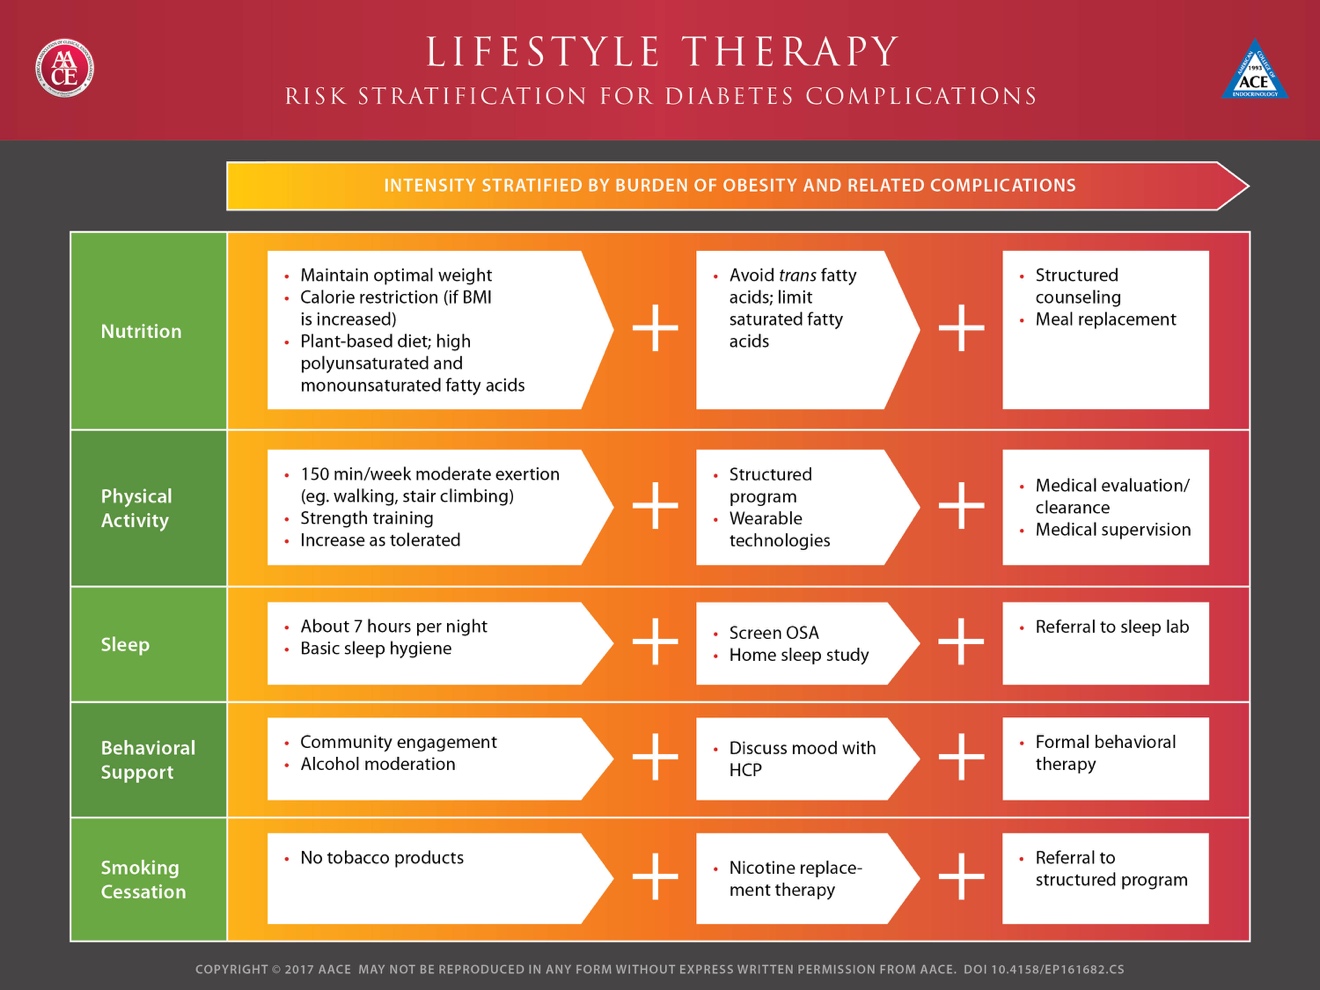 |
| Table 4: The American Association of Clinical Endocrinologists (AACE) and American College of Endocrinology Comprehensive Type 2 Diabetes Management- Multi treatment strategy (copyright permission obtained) |


