Open Access
Research Article
Max Screen >>
ISSN: 2455-7633
Copyright: © 2016 Grant JF. This is an open-access article distributed under the terms of the Creative Commons Attribution License, which permits unrestricted use, distribution, and reproduction in any medium, provided the original author and source are credited.
Related article at Pubmed, Google Scholar
Self-perception and measures of body weight and central adiposity are key indicators of a population’s attitude and level of concern regarding obesity. Parental weight has been shown to be a strong determinant of adult offspring weight. This study initially investigates the association between self-perception, and measured body mass index (BMI) and waist circumference (WC), and characterised this association by perception type (pessimist, optimist and realist). We then examined the link between (mis) perception with midlife parental body shape, which may assist with targeted interventions for those misperceiving their weight. Data from a telephone survey (2007) and two biomedical stages (2004-06 and 2008-10) of the North West Adelaide Health Study (n=2710), a longitudinal cohort of Australian adults. The study included offspring measured BMI and WC and midlife parental body shape recalled from pictograms. Over half of participants misperceived their weight status, with heavier males more likely than females to underestimate their weight and females more likely to correctly estimate or overestimate their weight. Among males, higher maternal weight was associated with a greater risk of offspring being pessimistic about their weight than being an underweight/normal weight realist (BMI RR 2.03, 95% CI 1.01-4.07, p=0.046). Having an overweight mother was also associated with increased risk of both male and female offspring being obese optimists (BMI males RR 1.80, 95% CI 1.14-2.84, p=0.011/females RR 1.77, 95% CI 1.16-2.68, p=0.008; WC males RR 1.95, 95% CI 1.30-2.92, p=0.001/females RR 1.58, 95% CI 1.09-2.28, p=0.015). Higher paternal weight was also associated with being an obese realist for females (BMI RR 1.80, 95% CI 1.15-2.83, p=0.011; WC RR 1.95, 95% CI 1.23-3.09, p=0.004) but not males. Our findings suggest that having an obese parent, particularly an obese mother, may contribute to adult offspring’s misperception of their weight.
Keywords: Obesity; Body Mass Index; Waist circumference; Adult offspring; Cohort
Perception of body weight and its association with actual body weight has been widely researched [1-7]. Perceived rather than actual weight has been associated with dieting and eating behaviours, and body image [8]. Social/cultural norms about what constitutes an appropriate or “normal” weight for adults often differ between public health professionals and the wider community [9]. Obesity is increasingly being accepted as normal by society [10,11]. It has been reported that when comparing themselves with ‘normal’ people in the general population, overweight and obese people may under-estimate their weight and subsequently lack motivation to improve their health status [5,12].
Misperception can be defined as discordance between perceived and actual weight status [13] and is also known as body-image distortion [14]. Misperception can be either an over-estimation of weight which may lead to an eating disorder [15] or more commonly, an under-estimation of weight that may be associated with a failure to address overweight or obesity and the risk of consequent health-related conditions and risk factors [13,16,17]. Misperception is multidimensional and can change across a person’s lifetime due to social, biological, psychological and physiological factors [18].
Misperception of weight is increasingly common across a number of countries such as the United States (US), where a National Health and Nutrition Examination Survey (NHANES) based study in found only 28.5% of women and 61.1% of men considered themselves to be their “right” weight as opposed to being underweight or overweight [19]. A study of young adult overweight and obese women in the US (n=42) found that they perceived themselves to be larger than they actually were, particularly for those who were overweight [20]. Similarly, a study of two household surveys in Great Britain reported an increase in underestimation of weight from 19% in 1999 to 25% in 2007, despite an associated rise in overweight/obese from 43% to 53% respectively [21]. Comparable results of adults misperceiving being overweight or obese were identified in Switzerland (women 33%; men 53%) [6], Greece (38% overall) [22], Japan (women 46%, men 39%) [23] and Sri Lanka (75% overall) [4]. Overall, men are more likely to underestimate their weight status [24,25] while women tend to overestimate [1,9,16,26]. Misperception generally increases with age [10].
Within misperception, underestimation of weight was found to be more likely among older people (aged 65 years and over), those with lower levels of income and education [26], and women with higher levels of depressive symptoms [1]. Over-estimation of weight was more common among women aged under 65 years (particularly those aged 17-35 years) and men aged 35 to 64 years [26]. Most studies utilised either self-reported or measured body mass index (BMI); fewer include waist circumference (WC) as a measure of central adiposity [2,4,19].
Parental weight has been shown to be a strong determinant of the adult offspring weight through pre-natal programming, genetic predisposition and shared environmental factors such as diet and physical activity [27-30]. A series of studies examining parent-offspring BMI associations within a 1958 British birth cohort reported that they (1) were maintained from child to mid-adulthood; (2) had strengthened over two generations; and (3) varied by socioeconomic origins rather than the lifestyle and socioeconomic position of adult offspring. There is concern that the cycle of increasing weight within families will continue to affect subsequent generations [28].
Although there is a growing body of evidence regarding a parent-offspring association with obesity, no studies have been found that examine the association of mid-life parental body shape with self-perception of weight among adult offspring. While anthropometric measurements of parents would be ideal, pictograms that represent body size and shape have been used in a number of body image studies [5,31,32]. They have been shown to have validity as an instrument to recall parental weight where actual measurements are unavailable, including one study that explored the association between parental measured BMI and offspring’s recall (15 years) based on pictograms and found correlations of 0.74 for mothers and 0.63 for fathers [33].
The aim of this study was to firstly investigate misperception of weight status among males and females, and to characterise misperception as pessimist, optimist or realist. Secondly, we examined the association between weight misperception and offspring’s recall of parental body shape at age 40 using pictograms.
The North West Adelaide Health Study (NWAHS) is a longitudinal study of 4056 randomly selected adults aged 18 years and over recruited between 1999 and 2003 from the north-west region of Adelaide, the capital of South Australia. Participants were recruited using the Electronic White Pages during an initial Computer Assisted Telephone Interview (CATI), and the adult who had the most recent birthday in the household was invited to participate. Exclusions included those who did not have the capacity to participate due to illness or intellectual limitations, those who were unable to communicate in English and those living in a residential institution. The study methodology has been previously described in detail [34,35].
NWAHS participants have been followed up several times since initial recruitment (Stage 1 (baseline), n=4056, response rate 49.1%). Data in this paper were from self-reported (CATI and questionnaire) and/or measured clinic assessment, primarily from the Stage 2 first follow-up clinic examination (2004-2006, n=3205, response rate 81.5%); a telephone follow up survey in 2007 (TFU2, n=2996, response rate 90.2%); and Stage 3 (second follow-up, 2008-2010, n=2487, response rate 76.0%) (Supplementary Material Table A1 for a demographic comparison of participants at Stage 2, Telephone Follow Up and Stage 3).
This study was conducted according to the guidelines laid down in the Declaration of Helsinki and all procedures involving human subjects/patients were approved by the Human Research Ethics Committee of The University of Adelaide and of the Central Northern Adelaide Health Service (The Queen Elizabeth and Lyell McEwin Hospitals). Written informed consent was obtained from all subjects/patients.
The overall sample comprised those participants who underwent biomedical examination at Stage 2 and approximately one to three years later (mean 2 years, SD 0.5) provided information on perception of their weight status at TFU2 (n=2710 BMI, n=2691 WC). The analysis sample included participants who also provided information about parental body shape at age 40 in the Stage 3 questionnaire (BMI mother n=2055, father n=2000; WC mother n=2038, father n=1984) (Supplementary Material Table A2 provides a demographic comparison of participants at baseline and for the analysis sample).
At Stage 2, height without shoes was measured to the nearest 0.5 centimetres using a wall-mounted stadiometer and weight to the nearest 0.1 kilogram in light clothing and without shoes using standard digital scales. BMI values were calculated (kg/m2) and classified according to the World Health Organization [36]. Three measurements of WC were made to the nearest 0.1 centimetre using an inelastic tape maintained in a horizontal plane at the level of the narrowest part of the waist, with the subject standing comfortably with weight distributed evenly on both feet and the mean calculated. The definitions for WC were as follows: normal < 94 cm (men) and < 80 cm (women); overweight 94-101 cm (men) and 80-87 cm (women); obesity ≥102 cm (men) and ≥88 cm (women) [37]. To reduce the effect of possible bias, Stage 2 anthropometric measures were used as this was prior to participants reporting self-perception of weight status.
In TFU2, participants were asked “In terms of your weight, do you consider yourself to be … too thin, a little thin, normal weight, a little overweight or very overweight?”. Six perception types were created based on measured BMI and WC: (1) underweight or normal weight realists correctly classified themselves as too thin, a little thin or normal when they were actually underweight or normal weight (BMI <25; WC male <94cm, female <80cm); (2) overweight realists correctly considered themselves to be a little overweight when they were indeed overweight (BMI 25-29; WC male 94-101cm, female 80-87cm); (3) obese realists correctly considered themselves to be very overweight (BMI ≥30; WC male ≥102cm, female ≥88cm); (4) pessimists incorrectly classified themselves as a little overweight when they were normal weight, or very overweight when they were actually normal weight or slightly overweight; (5) overweight optimists incorrectly classified themselves as too thin or a little thin when they were actually normal weight, or normal weight when they were actually overweight; and (6) obese optimists incorrectly classified themselves as a little thin, normal or a little overweight when they were actually obese (Supplementary Material Table A3 provides a cross-tabulation of self-reported perception of weight and measured BMI and WC).
Parental body shape was determined at Stage 3 based on a set of validated pictograms (Figure 1) [38]. The mean age of the study population at the time they were asked about their parents’ body shape at age 40, was 58.6 years (SD 13.97). These diagrams were originally formulated to determine the body build of the parents of both adoptees and biological parents where self-reported and/or measured information was not available [38]. Pictograms have been shown to be accurate representations [33], and have been used with self-reported height and weight to determine familial predisposition to obesity [39]. Based on the Danish Nurse Cohort Study [40], study respondents were asked to identify the body shape of their biological mother and father at age 40 from nine silhouettes of each sex (Figure 1). Each set of silhouettes were derived into a dichotomous variable for mothers and fathers: silhouettes 1 through 5 were classified as obese/overweight, and silhouettes 6 through 9 were classified as healthy/underweight [41].
The unweighted data were analysed using SPSS Version 20.0 (IBM, Armonk, NY) and Stata Version 13 (StataCorp, College Station, TX). Univariable analyses using chi-square tests were undertaken on demographic characteristics and midlife parental body shape, and means for BMI and WC calculated for each category. Cross tabulations were undertaken of perceived versus measured weight status for BMI and WC, and a pictorial representation of the misperception according to offspring BMI was produced. The number, proportion, 95% confidence intervals (CIs) and the mean BMI and WC were calculated for the six perception types. Analyses were stratified by sex due to observed differences between males and females on measured BMI and WC and self-perception of weight (p<0.001) [10].
The association between parental body shape at midlife and weight perception type (combined perception and actual own body weight using both BMI and WC) was examined for males and females using multinomial regression. Underweight/normal weight realists were the reference category, and the relative risk (RR), 95% confidence intervals and p value for each is provided. The first model adjusted for age. The second model adjusted for age, parental country of birth and occupation, and number of siblings and family structure (type of relationship between adults and children living in the household, e.g. child/ren living with one or both biological or adopted parents or step/blended/shared care families; adults living alone, only with partner, or with related/unrelated adults) for the participant. The third model adjusted for the characteristics in model 2 and the following offspring demographics: marital status, highest educational qualification achieved, work status and gross annual household income.
Table 1 provides the distribution of offspring measured BMI and WC, and reported parental body shape at midlife, with the mean and standard deviation (SD) across BMI and WC within each category.
Based on BMI, females were more likely than males to be normal weight but less likely to be overweight. Based on both BMI and WC, males were more likely than females to be overweight but less likely to be obese. Regarding parental body shape, there was a higher proportion of missing paternal (11.2%) than maternal (8.2%) information. More than half of mothers and fathers were classified as overweight or obese by their offspring.
Figure 2 shows four male figures and four female figures representing measured weight status (BMI), together with self-perception of weight status as a pie chart for each. The proportions for self-perception based on WC are similar (Supplementary Material Table A3 provides a cross-tabulation of BMI & WC and self-perception of weight categories). Overall, 51.2% of males and 57.4% of females misperceived their weight status according to BMI. Males were more likely than females to under-estimate their actual weight (optimists) in most categories. For example, among overweight males, 35.8% perceived themselves as normal weight compared to 26.5% of females; among obese men, 64.4% perceived themselves as a little overweight compared to 55.5% of females. Females were more likely to over-estimate their actual weight (pessimists); for example, 21.7% of normal weight females considered themselves to be a little overweight compared to 16.4% of normal weight men.
Table 2 provides the distribution and mean BMI and WC of males and females within the six perception types. Based on perception type by BMI, males were more likely than females to be optimists (overweight or obese) while females were more likely than males to be realists (under/normal weight or obese) or pessimists. Based on perception type by WC, females were more likely than males to be obese realists.
An examination of the association between having an overweight/obese mother and/or father at age 40 and their offspring’s self-perception of their own weight status was undertaken using multinominal logistic regression (Table 3) with underweight/normal weight realists used as the reference category. Model 3 shows that the risk of being a pessimist was twice as high for males (BMI RR 2.03, 95% CI 1.01-4.07) with an overweight/obese mother as males without an overweight/obese mother. The risk of being an obese optimist, compared to being an underweight/normal realist, was also higher for people with an overweight/obese mother (BMI males RR 1.80, 95% CI 1.14-2.84, females RR 1.77, 95% CI 1.16-2.68; WC males RR 1.95, 95% CI 1.30-2.92, females RR 1.58, 95% CI 1.09-2.28).
Compared to being an underweight/normal weight realist, the risk of being an overweight realist was higher for males and females who had an overweight/obese mother (BMI males RR 2.62, 95% CI 1.39-4.93/females RR 2.04, 95% CI 1.29-3.22; WC males RR 2.69, 95% CI 1.45-4.98/females RR 1.99, 95% CI 1.26-3.16). Having an overweight/obese father was associated with being an obese realist for females (BMI RR 1.80, 95% CI 1.15-2.83; WC RR 1.95, 95% CI 1.23-3.09) but not for males.
Regardless of which body shape measure was used, there was generally a stronger association with having an overweight/obese mother rather than father. The three models did not vary greatly after adjusting for parental or offspring demographics.
This study found that obese men and overweight or obese women who had a heavier mother were more likely to correctly estimate or underestimate their own weight. Obese women who also had an obese father were more likely than men to correctly estimate or underestimate their own weight. Normal weight men who had a heavier mother were more likely than women to overestimate their actual weight.
The strength of these associations suggests that parents contribute to their offspring’s frame of reference and this persists into adulthood. Research argues that obesity is “socially contagious” with individuals more likely to become obese themselves if people in their family, social network or neighbourhood are obese [5,42]. While Frayling argues that the causes of obesity are genetic, through the influences of appetite, metabolism and physical activity tolerance [43], Wilding acknowledges that while genetics plays a part, it is primarily environmental factors such as the lower cost of energy dense foods and the rising rates of sedentary activities that has contributed to the predominantly global increase in obesity prevalence over the last 30 years [44]. Studies of self-perception explain that because of shifts in what is considered a normal body size, increases in perceptions of desired and ideal weights, a decrease in body dissatisfaction as people age, and multiple family histories of obesity, people are more accepting of overweight and obesity in general, and less motivated to control or reduce their body size [5,6,17,45].
The association with underestimation of weight has been linked to increased hours of television viewing for males and depressive symptoms for females [1]. Those who are depressed and/or feel badly about their body image may be in a fragile psychological state and therefore less able to make lifestyle changes to improve their health [25]. Conversely, those who overestimate their weight may be sensitive to the risk of resembling their overweight/obese parents and may be drawn to unhealthy eating patterns including unnecessary and/or excessive dieting, or binge eating and purging [17].
In this study, almost half of the participants misperceived their weight status, somewhat higher than recent findings within similar Western societies [19,21]. Almost two-thirds of participants thought that they were only a little overweight when they were actually obese. Males were more likely than females to be optimistic about their weight in line with other self-perception studies [1,9,26]; of those who considered themselves to be normal weight, more males than females were actually overweight, similar to a 2010 study [16]. It has been suggested that this may be due to heavier males seeing themselves as big and strong rather than overweight or obese [25].
It has been hypothesized that different methods of measurement (clinical versus community), different samples (including people at a stable weight or losing weight) and weight extremes may explain how overweight/obese people can be either realistic or optimistic about their weight [25]. Optimistic weight perceptions may lead to risky health behaviours; one study reported that obese women who underestimated their weight actually gained weight [5]. It is widely held that theories such as the Health Belief Model require a perceived susceptibility in order for a change in health behaviour, which may result in a desire to lose weight through improved diet or increased physical activity [13]. Chang et al. estimated that increasing one’s weight by approximately 3kg (equalling a 1 unit increase in BMI) increased the odds of being in a heavier/higher weight perception category by over 60% for both males and females, while a two-unit BMI increase tripled the odds of this [9]. Jones et al. found that those whose BMI was 35 and over had less distress about emotional overeating, less weight concern and less disinhibition about overeating, as well as less time for dieting [16]. It has been suggested that those who misjudge their own weight may also misjudge their children’s weight which has implications for the next generation continuing down the obesity pathway [4].
A previous study by the authors examined the association between parental body shape and the overall body shape as well as the central adiposity of their adult offspring, and found that compared to both parents being a healthy weight at age 40, those whose parents were overweight or obese were themselves more likely to be also overweight or obese, particularly if their mother was an unhealthy weight, and that this effect was stronger for daughters than for sons [46]. Guidelines for obesity management in general practice developed by the National Health and Medical Research Council recommend that doctors document BMI and WC during practice visits, in efforts to prevent and manage obesity. A study of 78 Australian general practices between July 2011 and December 2013, found that only 22.2% and 4.3% of patients had a documented BMI and WC respectively [47]. The use of pictograms in primary care settings to identify the risk from parental overweight and obesity, together with identification of the patient’s own body weight status and their perception of their body shape, may prove beneficial as a screening tool for young adults in efforts to reach or maintain a healthy weight.
It is also recognised that effective treatment of patients with chronic conditions incorporates successful self-management and adherence to programs which also take into account individual’s health beliefs; fear regarding their future health; frustrations with restrictions, the use of medications and the need for lifestyle changes; and possible depression [48].
Denial or inability to acknowledge one’s obesity may impact on the uptake of warnings and possible strategies to achieve a healthy weight. People so affected may retreat from medical interventions and find solace and encouragement of current unhealthy lifestyle choices elsewhere, such as in obesity acceptance groups and websites [11]. However it is encouraging that weight misperception can be modified, and advice from physicians may increase successful weight loss [47].
The strengths of this study include anthropometric versus self-reported measurements and the additional information regarding severe obesity, compared with a single category of overweight/obese (BMI 25+) used in US surveys such as NHANES. This study also incorporated WC as a measure of body fat distribution, which may provide a better indicator of health risk due to the identification of location of body fat, and it has been suggested that a higher WC is associated with a higher risk of feeling overweight [2].
This study has some limitations including a single measure of weight perception of weight, approximately one to three years (mean 2 years, SD 0.5) following anthropometric measurements of height, weight, and WC and hip circumference. An examination of weight loss/gain between baseline and Stage 3 (n=2128) found relatively stable weight change over the approximate eight years between these studies, with approximately 37% losing weight (mean 4.7 kg, SD 5.36) and 62% gaining weight (mean 6.0 kg, SD 5.76). Other limitations of the study include that perception type was characterised based on WHO BMI cut-offs, which have been acknowledged as possibly differing regarding the degree of fatness for different ethnic groups, particularly for the Asian and Pacific populations [36]. However, as approximately 70% of the participants were born in Australia, with a further 18% born in the United Kingdom/Ireland and 9% in Europe, it is considered that the WHO BMI cut-offs were appropriate for use in this population. Parental country of birth was similar, with approximately 56% born in Australia, 23% born in the United Kingdom/Ireland, and 17% born in Europe. Another limitation is that participants may have incorporated medical standards from their general physician, or personal standards based on cultural norms or the weight of family or friends. It is acknowledged that there is divergence between clinical and public health standards of what constitutes “normal” weight and its healthy distribution within the body, and the perception among the general community [49].
Another limitation was some loss to follow up of the initial cohort. In Stage 2, 3.1% (n=126) were unable to take part due to death, illness or incapacity or loss, while a further 14.2% (n=575) withdrew from the study, were unable to be contacted or declined to take part; the figures were 8.5% (n=345) and 14.2% (n=577) respectively for TFU2. An examination was undertaken of the representativeness of cohort participants which showed that by Stage 3, the NWAHS had a higher proportion of females and older people, and that study participants were more likely to be employed, have a certificate or trade level of education, and to have a higher level of gross annual household income. They were also more likely to report better overall health, to be ex- or non-smokers and to be obese (based on self-report) [50].
The focus of our cohort study is the epidemiology of chronic disease and health-related risk factors among adult participants which limited the exploration of familial factors such as midlife parental obesity. Sorensen et al. argue that while reports of body weight are less accurate than measurements, they are also less costly and enable epidemiological studies of obesity to be undertaken [33]. They further highlight their value in allowing associations between relative weights of people to be investigated particularly where absolute values are not available, while separating extremes of the distribution. Further, they reported recall to be sufficiently accurate after comparing reported parental body shape in 1979 with measured values in the early 1960s [33], similar to the approximate 17 year recall period between TFU2 and Stage 3.
Setting the age at 40 regarding parental body shape allows for consistency of recall while avoiding younger ages when parents are raising children, as well as later middle and older age. It is also argued that midlife parental weight would be less easily recounted while midlife parental height may be reported quite accurately. The use of pictograms allows for recall of body shape when actual measurements are not available such as when parents have died. Some criticisms of the use of pictograms as representations of body shape relating to restricted range of responses and limited number of available options may lead to an inability to provide a standard deviation around the response; the coarseness of the scale with loss of information through the need to reduce the response to fit a single option; method of presentation with silhouettes presented in ascending or descending order in one figure, rather than randomly presented as separate figures; and scale of measurement with silhouettes inconsistent in size across the scale and all figures the same height [51]. However, a number of studies consider pictograms to be a valid estimation of BMI measure to be used in the discrimination of overweight or obese compared to normal individuals [52,53].
This is the first study, to our knowledge, to examine the association between parental body shape and self-perception of weight among their adult offspring. Obese people who think they are normal weight or just a little overweight are an important group to engage in discussion about healthy lifestyle choices. While balance is required to maintain healthy weight and not encourage eating disorders such as anorexia and bulimia among vulnerable people, action is required to counter ongoing denial of health risk due to obesity which may result in comorbidities and possible early mortality. Public health prevention programs which provide information to people about how their parents’ overweight or obesity may have affected their health as well as providing a ‘norm’ regarding unhealthy weight status, together with information about their own overall weight and their central adiposity, and the possibility of associated health risks, may provide impetus for change in people’s lifestyle choices, such as diet and physical activity.
The authors thank Prof Gary Wittert for his assistance with figures, and are grateful for the generosity of the cohort participants as well as the work of the clinic, recruiting and research support staff.
JFG researched the data, contributed to discussion, and undertook a literature search, data analysis, generation of figures and writing of the manuscript. All authors reviewed, edited and revised the manuscript, and contributed equally.

![]()

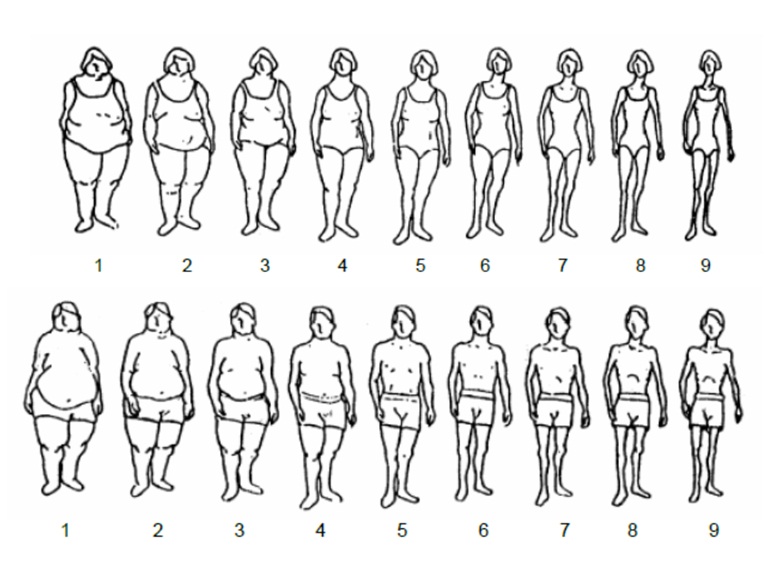 |
| Silhouettes 1-2 = Very overweight; Silhouettes 3-4 = Moderately overweight; Silhouette 5 = Slightly overweight; Silhouettes 6-7 = Appropriate (healthy) weight; Silhouettes 8-9 = Underweight. Reprinted with permission Figure 1: Images for perceived body shape of parents from the Figure Rating Scale (adapted from the paper by Sorensen et al. [33]) |
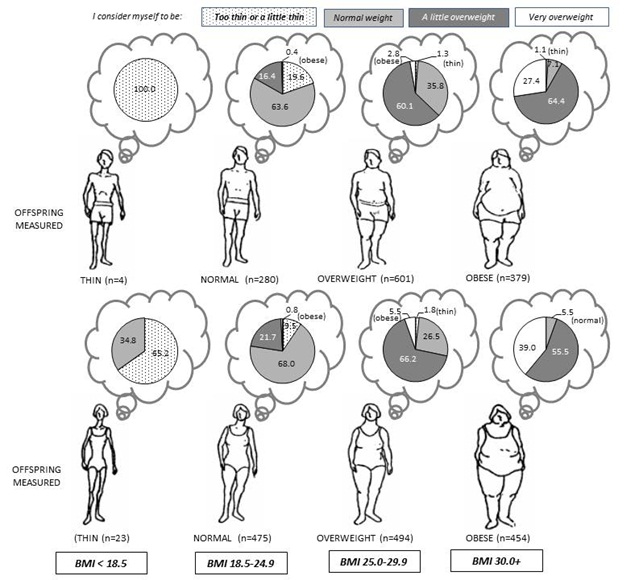 |
Figure 2: Distribution of self-perceived weight among measured BMI categories of participants |
MALES |
FEMALES |
|||||||||||||
BMI |
WC* (cm) |
BMI |
WC* (cm) |
|||||||||||
n |
% |
Mean |
(SD) |
Mean |
(SD) |
n |
% |
Mean |
(SD) |
Mean |
(SD) |
p |
||
OFFSPRING BODY SHAPE (Stage 2 – measured) |
` |
|||||||||||||
BODY MASS INDEX (n=2710) |
<0.001 |
|||||||||||||
Underweight |
4 |
0.3 |
17.7 |
(0.4) |
72.3 |
(6.0) |
23 |
1.6 |
17.3 |
(1.1) |
68.7 |
(6.5) |
||
Normal |
280 |
22.2 |
23.1 |
(1.5) |
87.5 |
(7.5) |
475 |
32.8 |
22.4 |
(1.7) |
76.4 |
(6.6) |
||
Overweight |
601 |
47.5 |
27.4 |
(1.4) |
98.3 |
(6.4) |
494 |
34.2 |
27.3 |
(1.4) |
88.2 |
(6.8) |
||
Obese1 |
267 |
21.1 |
31.8 |
(1.3) |
109.5 |
(6.6) |
272 |
18.8 |
32.2 |
(1.5) |
98.7 |
(6.5) |
||
Obese2 |
81 |
6.4 |
37.0 |
(1.3) |
121.6 |
(7.1) |
115 |
8.0 |
36.9 |
(1.3) |
106.6 |
(6.3) |
||
Obese3 |
31 |
2.5 |
43.1 |
(3.4) |
135.4 |
(9.1) |
67 |
4.6 |
44.5 |
(4.3) |
118.6 |
(10.7) |
||
WAIST CIRCUMFERENCE (n=2691) |
0.001 |
|||||||||||||
Normal |
383 |
30.5 |
24.2 |
(2.3) |
87.0 |
(5.6) |
410 |
28.6 |
22.2 |
(2.3) |
73.4 |
(4.4) |
||
Overweight |
339 |
27.0 |
27.2 |
(2.0) |
97.7 |
(2.3) |
315 |
21.9 |
25.8 |
(2.3) |
83.9 |
(2.3) |
||
Obese |
533 |
42.5 |
32.0 |
(4.3) |
112.1 |
(9.4) |
711 |
49.5 |
32.3 |
(5.5) |
100.0 |
(9.6) |
||
Total |
1264 |
100.0 |
28.3 |
(4.7) |
100.1 |
(12.8) |
1446 |
100.0 |
28.0 |
(6.1) |
88.9 |
(13.7) |
||
PARENTAL BODY SHAPE (Stage 3 – pictograms) |
||||||||||||||
MOTHER (overall BMI n=2055, WC n=2038) |
0.720 |
|||||||||||||
(n=947) |
(n=1091) |
|||||||||||||
Underweight/Normal weight |
400 |
41.8 |
27.5 |
(4.2) |
98.4 |
(11.7) |
446 |
40.6 |
26.8 |
(5.4) |
86.3 |
(12.5) |
||
Overweight |
527 |
55.1 |
28.7 |
(4.6) |
101.5 |
(12.5) |
614 |
55.9 |
28.6 |
(6.5) |
90.1 |
(14.4) |
||
Obese |
29 |
3.0 |
32.2 |
(6.2) |
108.3 |
(15.1) |
39 |
3.5 |
30.6 |
(7.1) |
92.8 |
(12.9) |
||
Total |
956 |
100.0 |
28.3 |
(4.6) |
100.4 |
(12.4) |
1099 |
100.0 |
27.9 |
(6.2) |
88.6 |
(13.7) |
||
FATHER (overall BMI n=2000, WC n=1984) |
0.066 |
|||||||||||||
(n=934) |
(n=1050) |
|||||||||||||
Underweight/ Normal weight |
415 |
44.0 |
27.9 |
(4.5) |
99.7 |
(11.9) |
504 |
47.7 |
27.1 |
(5.6) |
87.1 |
(13.1) |
||
Overweight |
514 |
54.5 |
28.3 |
(4.5) |
100.6 |
(12.7) |
528 |
50.0 |
28.4 |
(6.2) |
89.3 |
(13.7) |
||
Obese |
14 |
1.5 |
31.8 |
(6.4) |
107.9 |
(14.0) |
25 |
2.4 |
35.5 |
(9.8) |
103.4 |
(18.3) |
||
Total |
943 |
100.0 |
28.2 |
(4.6) |
100.3 |
(12.4) |
1057 |
100.0 |
28.0 |
(6.2) |
88.6 |
(13.8) |
||
| *WC males n=1255; females n=1436 Table 1: Distribution of offspring BMI & WC and parental body shape at midlife, with mean and standard deviation (SD) of measured BMI & WC within each category |
||||||||||||||
MALES |
FEMALES |
||||||||||
n |
% |
95% CI |
Mean |
(SD) |
n |
% |
95% CI |
Mean |
(SD) |
p |
|
BMI* |
<0.001 |
||||||||||
Underweight/Normal weight REALISTS |
237 |
18.8 |
(16.7-21.0) |
22.9 |
(1.7) |
391 |
27.0 |
(24.8-29.4) |
21.9 |
(2.0) |
|
PESSIMISTS |
64 |
5.1 |
(4.0-6.4) |
25.0 |
(2.2) |
134 |
9.3 |
(7.9-10.9) |
24.2 |
(2.3) |
|
Overweight OPTIMISTS |
223 |
17.6 |
(15.6-19.8) |
26.8 |
(1.3) |
140 |
9.7 |
(8.3-11.3) |
26.9 |
(1.4) |
|
Overweight REALISTS |
275 |
21.8 |
(19.6-24.1) |
27.7 |
(1.3) |
277 |
19.2 |
(17.2-21.3) |
27.4 |
(1.4) |
|
Obese OPTIMISTS |
361 |
28.6 |
(26.1-31.1) |
33.0 |
(2.9) |
327 |
22.6 |
(20.5-24.8) |
33.4 |
(3.1) |
|
Obese REALISTS |
104 |
8.2 |
(6.8-9.9) |
36.3 |
(4.8) |
177 |
12.2 |
(10.7-14.0) |
38.1 |
(5.7) |
|
Total |
1264 |
100.0 |
28.3 |
(4.7) |
1446 |
100.0 |
28.0 |
(6.1) |
|||
n |
% |
Mean (cm) |
(SD) |
n |
% |
Mean (cm) |
(SD) |
||||
WC** |
<0.001 |
||||||||||
Underweight/Normal weight REALISTS |
283 |
22.5 |
(20.3-24.9) |
86.1 |
(5.8) |
324 |
22.6 |
(20.5-24.8) |
72.7 |
(4.4) |
|
PESSIMISTS |
110 |
8.8 |
(7.3-10.5) |
90.5 |
(4.8) |
97 |
6.8 |
(5.6-8.2) |
76.8 |
(4.0) |
|
Overweight OPTIMISTS |
138 |
11.0 |
(9.4-12.8) |
97.4 |
(2.3) |
122 |
8.5 |
(7.2-10.1) |
83.4 |
(2.3) |
|
Obese OPTIMISTS |
423 |
33.7 |
(31.1-36.4) |
97.8 |
(2.3) |
520 |
36.2 |
(33.8-38.7) |
84.2 |
(2.3) |
|
Overweight REALISTS |
191 |
15.2 |
(13.3-17.3) |
110.0 |
(7.3) |
182 |
12.7 |
(11.1-14.5) |
97.3 |
(7.2) |
|
Obese REALISTS |
110 |
8.8 |
(7.3-10.5) |
120.4 |
(11.8) |
191 |
13.3 |
(11.6-15.2) |
107.5 |
(11.4) |
|
Total |
1255 |
100.0 |
100.6 |
(12.8) |
1436 |
100.0 |
88.9 |
(13.7) |
|||
| *BMI Underweight/Normal <25; Overweight 25-29; Obese30+ **WC Normal M<94cm, F<80cm; Overweight M 94-101cm, F 80-87cm; Obese M>=102cm, F>=88cm (n=18 incomplete not shown) Table 2: Perception type and mean of weight measurement by BMI and WC |
|||||||||||
Perception type |
BMI (n=2710) |
WC (n=2691) |
|||||||
REFERENCE CATEGORY |
MALES (n=1264) |
FEMALES (n=1446) |
MALES (n=1255) |
FEMALES (n=1436) |
|||||
Realists - Underweight/ Normal Weight |
RR (95% CI) |
p |
RR (95% CI) |
p |
RR (95% CI) |
p |
RR (95% CI) |
p |
|
PESSIMISTS |
|||||||||
*MOTHER Overweight/obese |
|||||||||
Model 1 |
2.09 (1.06-4.11) |
0.033 |
1.43 (0.90-2.27) |
0.129 |
1.36 (0.81-2.28) |
0.249 |
1.34 (0.78-2.28) |
0.285 |
|
Model 2 |
2.11 (1.06-4.20) |
0.033 |
1.39 (0.87-2.22) |
0.169 |
1.48 (0.87-2.53) |
0.146 |
1.34 (0.78-2.31) |
0.293 |
|
Model 3 |
2.03 (1.01-4.07) |
0.046 |
1.40 (0.87-2.26) |
0.165 |
1.45 (0.84-2.50) |
0.181 |
1.36 (0.78-2.37) |
0.271 |
|
**FATHER Overweight/obese |
|||||||||
Model 1 |
0.61 (0.32-1.18) |
0.144 |
0.96 (0.60-1.52) |
0.852 |
0.85 (0.50-1.42) |
0.528 |
0.61 (0.35-1.06) |
0.078 |
|
Model 2 |
0.57 (0.29-1.11) |
0.100 |
1.00 (0.62-1.60) |
1.000 |
0.78 (0.46-1.33) |
0.366 |
0.60 (0.34-1.06) |
0.080 |
|
Model 3 |
0.59 (0.30-1.16) |
0.128 |
1.00 (0.62-1.61) |
0.997 |
0.78 (0.46-1.35) |
0.381 |
0.59 (0.33-1.05) |
0.071 |
|
OPTIMISTS - OVERWEIGHT |
|||||||||
*MOTHER Overweight/obese |
|||||||||
Model 1 |
1.06 (0.68-1.67) |
0.788 |
1.48 (0.90-2.41) |
0.120 |
1.01 (0.61-1.67) |
0.963 |
1.28 (0.76-2.16) |
0.347 |
|
Model 2 |
0.96 (0.60-1.52) |
0.858 |
1.44 (0.87-2.37) |
0.152 |
1.06 (0.63-1.78) |
0.821 |
1.27 (0.75-2.15) |
0.375 |
|
Model 3 |
1.02 (0.64-1.63) |
0.923 |
1.38 (0.83-2.30) |
0.216 |
1.04 (0.62-1.76) |
0.878 |
1.22 (0.71-2.11) |
0.465 |
|
**FATHER Overweight/obese |
|||||||||
Model 1 |
1.19 (0.76-1.87) |
0.448 |
1.30 (0.79-2.11) |
0.299 |
1.00 (0.60-1.66) |
0.996 |
1.31 (0.77-2.20) |
0.316 |
|
Model 2 |
1.15 (0.73-1.83) |
0.549 |
1.43 (0.87-2.36) |
0.157 |
0.94 (0.56-1.58) |
0.811 |
1.41 (0.83-2.39) |
0.206 |
|
Model 3 |
1.14 (0.72-1.82) |
0.570 |
1.56 (0.93-2.60) |
0.090 |
0.92 (0.55-1.56) |
0.766 |
1.42 (0.83-2.46) |
0.204 |
|
OPTIMISTS - OBESE |
|||||||||
*MOTHER Overweight/obese |
|||||||||
Model 1 |
1.82 (1.17-2.82) |
0.008 |
1.86 (1.25-2.77) |
0.002 |
1.78 (1.21-2.61) |
0.003 |
1.69 (1.19-2.41) |
0.004 |
|
Model 2 |
1.84 (1.17-2.88) |
0.008 |
1.81 (1.21-2.72) |
0.004 |
1.97 (1.32-2.93) |
0.001 |
1.64 (1.15-2.36) |
0.007 |
|
Model 3 |
1.80 (1.14-2.84) |
0.011 |
1.77 (1.16-2.68) |
0.008 |
1.95 (1.30-2.92) |
0.001 |
1.58 (1.09-2.28) |
0.015 |
|
**FATHER Overweight/obese |
|||||||||
Model 1 |
1.29 (0.83-1.99) |
0.258 |
1.57 (1.06-2.34) |
0.024 |
1.27 (0.86-1.87) |
0.223 |
1.49 (1.05-2.12) |
0.028 |
|
Model 2 |
1.25 (0.81-1.95) |
0.317 |
1.61 (1.07-2.41) |
0.021 |
1.24 (0.84-1.83) |
0.288 |
1.52 (1.06-2.19) |
0.022 |
|
Model 3 |
1.23 (0.79-1.93) |
0.358 |
1.61 (1.07-2.44) |
0.023 |
1.19 (0.80-1.78) |
0.390 |
1.49 (1.03-2.15) |
0.034 |
|
REALISTS - OVERWEIGHT |
|||||||||
*MOTHER Overweight/obese |
|||||||||
Model 1 |
1.29 (0.87-1.92) |
0.207 |
2.15 (1.49-3.08) |
0.000 |
1.17 (0.75-1.82) |
0.478 |
1.98 (1.28-3.06) |
0.002 |
|
Model 2 |
1.32 (0.88-1.98) |
0.176 |
2.12 (1.47-3.06) |
0.000 |
1.25 (0.79-1.95) |
0.340 |
1.97 (1.27-3.08) |
0.003 |
|
Model 3 |
1.32 (0.87-1.99) |
0.186 |
2.04 (1.40-2.97) |
0.000 |
1.23 (0.78-1.95) |
0.372 |
1.95 (1.25-3.06) |
0.004 |
|
**FATHER Overweight/obese |
|||||||||
Model 1 |
1.19 (0.80-1.78) |
0.383 |
1.21 (0.85-1.73) |
0.295 |
1.00 (0.64-1.55) |
0.985 |
1.33 (0.86-2.05) |
0.195 |
|
Model 2 |
1.15 (0.77-1.72) |
0.504 |
1.26 (0.87-1.81) |
0.215 |
0.98 (0.63-1.54) |
0.930 |
1.41 (0.91-2.19) |
0.127 |
|
Model 3 |
1.14 (0.76-1.72) |
0.522 |
1.25 (0.87-1.81) |
0.231 |
0.93 (0.59-1.47) |
0.754 |
1.40 (0.90-2.19) |
0.135 |
|
REALISTS - OBESE |
|||||||||
*MOTHER Overweight/obese |
|||||||||
Model 1 |
2.47 (1.37-4.48) |
0.003 |
2.11 (1.36-3.26) |
0.001 |
2.46 (1.39-4.35) |
0.002 |
2.07 (1.33-3.22) |
0.001 |
|
Model 2 |
2.62 (1.41-4.84) |
0.002 |
2.08 (1.33-3.25) |
0.001 |
2.75 (1.52-4.99) |
0.001 |
2.03 (1.29-3.18) |
0.002 |
|
Model 3 |
2.62 (1.39-4.93) |
0.003 |
2.04 (1.29-3.22) |
0.002 |
2.69 (1.45-4.98) |
0.002 |
1.99 (1.26-3.16) |
0.003 |
|
**FATHER Overweight/obese |
|||||||||
Model 1 |
1.08 (0.61-1.90) |
0.790 |
1.80 (1.17-2.78) |
0.007 |
1.06 (0.61-1.83) |
0.837 |
1.95 (1.26-3.02) |
0.003 |
|
Model 2 |
1.03 (0.58-1.84) |
0.907 |
1.77 (1.14-2.75) |
0.011 |
1.01 (0.58-1.77) |
0.968 |
1.95 (1.24-3.05) |
0.004 |
|
Model 3 |
0.98 (0.54-1.77) |
0.949 |
1.80 (1.15-2.83) |
0.011 |
0.94 (0.53-1.67) |
0.828 |
1.95 (1.23-3.09) |
0.004 |
|
| *Mother, n=2055; **Father, n=2000 Model 1 adjusted for age Model 2 adjusted for age, parents' country of birth, parents' occupation, offspring family structure; and in offspring's early childhood - having siblings and parental unemployment Model 3 adjusted for age, parents' country of birth, parents' occupation; in offspring's early childhood - having siblings and parental unemployment; and offspring's marital, education, work, income status and family structure. Table 3: Relative risks of perception type by parental body shape and offspring BMI and WC (measured) |
|||||||||


