Open Access
Research Article
Max Screen >>
ISSN: 2455-7633
Copyright: © 2016 Kawadry O. This is an open-access article distributed under the terms of the Creative Commons Attribution License, which permits unrestricted use, distribution, and reproduction in any medium, provided the original author and source are credited.
Related article at Pubmed, Google Scholar
Objective: The prognostic utility of the triglyceride: HDL-cholesterol (TG:HDL-C) ratio, a marker for insulin resistance, is unknown among high-risk children and adolescents. We examined the clinical utility of TG:HDL-C ratio as a marker of insulin resistance and chronic inflammation in obese youth.
Materials and Methods: Body mass index (BMI), body composition, fasting lipids, glucose, high sensitivity c-reactive protein (hs-CRP), HbA1c, insulin and the homeostatic model assessment for insulin resistance (HOMA-IR) were evaluated in 133 obese pubertal subjects (86F/47M), aged 13.9 ± 2.3 years [55 Caucasian (C), 40 Hispanic (H), 38 African American (AA)] [body mass index z-score (BMI-z) 2.4 ± 0.3].
Results: The C and H subgroups had higher TG, TG: HDL-C and hs-CRP values and prevalence of metabolic syndrome (MS) compared to AA subgroup (58.2% and 62.5% vs. 44.5%, p<0.05) without gender differences. There was a positive correlation between hs-CRP and fat mass (FM) within each gender. The TG: HDL-C ratio correlated with HOMA-IR (r=0.20, p<0.05), and hs- CRP (r=0.46, p<0.0001) when controlling for FM, gender and ethnicity. Further, TG: HDL-C ratio of 3.0 provided a sensitivity of 89.2% and specificity of 84.8% (p<0.0001) for detection of MS. However, a HOMA-IR cut-off value for TG: HDL-C ratio could not be calculated. On the other hand, an hs-CRP cut-off point of 2.0 mg/L provided a sensitivity of 58% and specificity of 80% for a TG: HDL-C ratio of 3.0.
Conclusion: The TG: HDL-C ratio correlated with markers of insulin resistance and inflammation. Nevertheless, the TG: HDL-C ratio may be a more reliable independent marker for inflammation than HOMA-IR for the identification of atherosclerosis risk in obese children and adolescents.
Keywords: Obesity; Insulin Resistance; Inflammation; Diabetes; Dyslipidemia
List of Abbrevations: AA: African American; BMI-z: Body Mass Index z-score; C: Caucasian; CMR: Cardiometabolic Risk; FM: Fat Mass; HbA1c: Hemoglobin A1c; hs-CRP: Highly Sensitive C-Reactive Protein; H: Hispanic; HOMA- IR: Homeostatic Model Assessment for Insulin Resistance; MS: Metabolic Syndrome; ROC: Receiver-Operating Characteristic; TG:HDL-C: Triglyceride: HDL- Cholesterol Ratio
Cardiovascular disease is the most common cause of death among the adult population, and it has been documented that risk factors associated with its development may appear as early as childhood [1]. Cardiometabolic risk (CMR) factors tend to precede the development of atherosclerosis in obese children and adults [2]. Indeed, diagnostic correlates of pediatric metabolic syndrome (MS) have been shown to predict adult MS, heart disease mortality and type 2 diabetes mellitus (T2DM) [2-4]. Further, implementation of increased physical activity in pediatric obesity prevention trials has demonstrated improvements in markers of insulin resistance and inflammation [5]. Therefore, clinically reliable and cost-effective tools to identify and predict CMR factors in children and adolescents are critical for prevention of MS.
The triglyceride: HDL-cholesterol (TG: HDL-C) ratio has been proposed as a simple tool to identify subjects with insulin resistance and MS, and can predict coronary artery disease [6,7]. Potential mechanisms that may explain the relationship between insulin sensitivity and TG: HDL-C ratio could be free fatty acid concentrations, adipose tissue adipokines such as leptin and adiponectin levels, physical activity energy expenditure, gene expression and diet [8]. Indeed, it has been shown that obese youth with insulin resistance and dyslipidemia have impaired suppression of lipid oxidation and elevated free fatty acid concentrations in response to insulin infusion [9].
High-sensitivity c-reactive protein (hs-CRP) has emerged as a useful biomarker for vascular inflammation associated with atherosclerosis [10]. Increased circulating hs-CRP levels predict acute coronary events not only in patients with cardiovascular disease, but also in apparently healthy subjects [11]. Many studies in adults have shown that hs-CRP levels are associated with adverse lipid profiles, such as increases in TG levels and decreases in HDL-C levels [12,13]. There are few studies exploring the relationship between hs-CRP and certain risk of cardiovascular disease among children [14].
Data from the Third National Health and Nutritional Examination Survey (NHANES III) indicate that the most frequently encountered components of the MS among adolescents are high circulating TG) (25-30% of adolescents) and low HDL-cholesterol (HDL-C) levels (40-50% of adolescents) [15]. Using hyperinsulinemic-euglycemic clamp, Hannon et al. showed that a cutoff point of TG: HDL-C ≥3.0 had a sensitivity of 61% and a specificity of 82% for identifying overweight pediatric cohort in the lowest tertile for insulin sensitivity [16]. To date, the clinical utility of TG: HDL-C ratio in identifying CMR factors in pediatric obesity has not been studied. Therefore, we evaluated the relationship between TG: HDL-C ratio and indices of insulin resistance and low grade inflammation in a group of obese children and adolescents.
One hundred thirty-three pubertal children (8.8-18.4 years; Tanner stage 2-5) who met the criteria for obesity (BMI >95th percentile for age) [17] were included in the study. All subjects were evaluated at the Children’s Hospital of Wisconsin (CHW) (affiliated with the Medical College of Wisconsin) Endocrine Clinic for obesity between January 2003 and October 2008. Race/ethnicity was self-assigned: Caucasian (C; n = 55, 41.4%), Mexican American (Hispanic H; n = 40, 30.1%), and African American (AA; n = 38, 28.6%). Children with cardiac, endocrine, renal, infectious, and chronic conditions and medical therapies that could affect cardiovascular or metabolic function were excluded from the study. The CHW Institutional Review Board approved the retrospective review of patients’ clinical charts; therefore, informed consent was not required.
Data was collected on patients including age, sex, self-declared ethnicity, height, weight, and body composition analysis that was performed by bioelectrical impedance (BIA) (TANITA- TBF-410; TANITA America, Arlington Heights, IL) [18]. Each patient’s height was measured using a Harpenden stadiometer. Subjects and/or their guardians completed a questionnaire detailing their medical history and medications. Two measurements of right arm systolic and diastolic blood pressure (SBP and DBP) were performed 2 times 10 minutes apart and the mean values of the two measurements were recorded. Pubertal development was assessed by Tanner stage of breast development in girls and testicular volume in boys by two pediatricians. Fasting serum samples were obtained for the determination of glucose, insulin, lipid profile, hs-CRP, and HbA1c.
Serum glucose was measured by an autoanalyzer (Orthodiagnostics Fusion 5.1; Orthodiagnostics, Rochester, NY). The hs-CRP assays were carried out using a polystyrene particle-enhanced immunonephelometric method (Dade Behring BNII). The detection limit of this assay was 0.20 mg/L with measuring range of 0.18 to 1150 mg/L with intraassay and interassay coefficients of variance of 2.65 and 3.6%, respectively (Quest Diagnostics, San Jose, CA). Hs-CRP levels >10 mg/L were eliminated from the study, to avoid the influence of acute infection.
Fasting serum insulin was measured by Nichols radio-immunoassay (RIA) (Nichols Institute, San Clemente, CA) with intra-assay and inter-assay coefficients of variation (CV) of 2.4-6.3% and 5.2-13.0%, respectively. The homeostatic model assessment estimates for insulin resistance (HOMA-IR) calculated as previously described [19]: HOMA-IR= (blood glucose mmol/L x insulin μU/mL)/22.5).
Total cholesterol, high-density lipoprotein Cholesterol (HDL-C) and triglycerides (TG) were determined by colorimetric methods (Beckman spectrophotometer, Fullerton, CA). Low- density lipoprotein cholesterol (LDL-C) was calculated using Friedewald’s equation [20]. A cut- off point of TG (mg/dL): HDL-C (mg/dL) ratio ≥3.0 was used to define insulin resistance [16].
Since waist circumference was not obtained in this cohort, the international diabetes federation (IDF) criteria for diagnosis of MS was not used [21]. Therefore, modified National Cholesterol Education Program (NCEP) criteria [22] for diagnosis of MS were defined as the presence of 3 or more of the following: age-adjusted BMI >95th percentile, systolic or diastolic BP >90th percentile, TG >90th percentile, HDL cholesterol <5th percentile, and impaired fasting glucose >5.6 mmol/L.
Statistical analyses were carried out using SPSS (version 14.0; SPSS, Chicago, IL). Data are expressed as mean ± SD unless otherwise specified. Spearman rank correlation was used to study the relationship between variables; partial correlations were used to control for potential covariates (eg, FM, gender, Tanner stage and ethnicity). ANOVA was used for normally distributed variables. Chi-square analysis was used to compare prevalence of MS. The Kruskal- Wallis Test was used for variables with skewed distributions for the overall comparisons. Fisher Z transformation was used to compare two correlations. Student’s t-test and Mann-Whitney non-parametric test were used to compare means and mean ranks, respectively. P < 0.05 was considered statistically significant.
Receiver-operating characteristic (ROC) curves were constructed using logistic regression to identify cut-off points for the TG: HDL-C ratio, which optimized the sensitivity and specificity of these biomarkers to identify youth with inflammation. The ROC curves were constructed by plotting the true-positive rate (sensitivity) against the false-positive rate (1- specificity) over a range of cut-off values. The cut-off points used in this analysis were determined by choosing the coordinates of the curve that provided the highest sensitivity, without compromising specificity.
Table 1 summarizes the clinical and biochemical characteristics of the entire participant cohort stratified according to ethnicity. Table 2 applies the Kruskal-Wallis test for ethnicity. Overall comparison results across the ethnic groups were reported. There were no differences in FM, BMI-z, serum glucose, HOMA-IR, cholesterol, LDL-C, HDL-C. The serum TG levels, TG: HDL-C ratios and hs-CRP values were significantly higher in H and C than AA (p<0.05, p<0.01, respectively). This corresponded to higher prevalence of MS among C and H subgroups compared to AA subgroup (58.2% and 62.5% vs. 44.5%, p<0.05): [(AA vs. H: x2=6.52, p=-.0015, RR=1.45, 95% CI: 1.08-1.95), (AA vs. C: x2=3.90, p=0.047, RR=1.33, 95% CI=1.01-1.77) and (C vs. H: x2=0.32, p=0.56, RR=0.92, 95% CI= 0.69-1.2)]. Conversely, HbA1c was significantly higher in AA and H than C (p<0.05). However, there were no gender differences in TG: HDL-C ratio, hs-CRP, and HbA1c levels. While hs-CRP was positively correlated with FM without gender differences (r=0.40; p<0.01), the correlation between TG: HDL-C and FM was not significant.
Table 3 summarizes the bivariate correlations while controlling for FM, gender, and ethnicity using Spearman rank partial correlations. The TG: HDL-C ratio was correlated with HOMA-IR (r=0.20, p<0.05) and hs-CRP (r=0.46, p<0.0001). While HOMA-IR was correlated with HbA1c (r= 0.24, p<0.01), there was no correlation between HOMA-IR and hs-CRP, or between hs-CRP and HbA1c.
Figure 1 and Table 4 show the TG: HDL-C ratio ROC curves at different hs-CRP cut-off points. An hs-CRP cutoff = 2.0 gives the highest predictability (highest sensitivity and specificity combination) for TG: HDL-C ratio. An hs-CRP cut-off point of 2.0 gives a sensitivity of 58% and a specificity of 80% for a TG: HDL-C ratio of 3.0. A HOMA-IR cut-off point for TG: HDL- C ratio with an acceptable sensitivity and specificity could not be determined. Finally, TG: HDL-C ratio of 3.0 provided a sensitivity of 89.2% and specificity of 84.8% for detection of MS (AUC= 0.94, standard error=0.0196, 95% CI=0.8995-0.994, p<0.0001).
In this study, we observed that measures of inflammation (hs-CRP) and dyslipedemia (TG: HDL-C ratio) were significantly higher in H and C than AA without gender differences. The prevalence of MS was higher among H and C subgroups compared to AA subgroup. Conversely, HbA1c was significantly higher in AA than H and C. Also, there was a correlation between FM and hs-CRP within each gender without gender differences. Furthermore, TG: HDL-C ratio correlated with both indices of insulin resistance and inflammation even after controlling for confounding factors. An hs-CRP cut-off point of 2.0 was found to give a sensitivity of 58% and a specificity of 80% for a TG: HDL-C ratio of 3.0.
Previously, Hannon et al. showed that a cutoff point of TG: HDL-C ≥3.0 had a sensitivity of 61% and a specificity of 82% for identifying overweight individuals in the lowest tertile for insulin sensitivity, despite having percent body fat comparable to those subjects with values below the cut-off point [16]. However, the study was not powered to determine the sensitivity, specificity, and predictive values of lipid markers for clinical prediction of insulin resistance. Also, Dhuper et al. found that HOMA-IR had a correlation with TG: HDL-C ratio, but, the correlation was not controlled for FM [23]. In contrast, Quijada et al. observed that the TG: HDL-C ratio correlated with all markers of obesity and mean blood pressure, but not HOMA-IR [24] suggesting that the expression of insulin resistance in obese pediatric subjects is heterogeneous. However, we observed that TG: HDL-C cutoff of 3.0 was a marker for detecting MS.
Sumner et al. reported that the TG: HDL-C ratio is not a reliable marker of insulin resistance in AA adults [25] since AA subjects tend to display higher lipoprotein lipase (LPL) activity with resultant lower TG levels in this ethnic group compared to C cohort [26]. Hence, insulin resistance leads to an impairment of LPL levels and high TG levels in C, but not in AA subjects [27]. While the TG: HDL-C ratio ≥3.0 failed to predict insulin resistance in all three ethnic groups, it predicted MS in our cohort. Our observations differ from those of Sumner et al. which may be attributed to genetic variants and age-related changes in the effects of LPL within individuals over time [28].
It has been shown that hs-CRP is a major player in the atherosclerotic process at all stages [29,30]. The evaluation of CMR factors in Young Finns Study showed that the correlation between hs-CRP and carotid intima-media thickness is driven by the effects of adiposity [31]. This interaction between hs-CRP, TG and HDL-C could be mediated by different cytokines of adipose origin, such as tumor necrosis factor-alpha (TNF-α) and interleukin-6 (IL-6). The hs- CRP levels are elevated in some genetically predisposed individuals in relation to greater abdominal adiposity [32]. In our study, hs-CRP correlated with TG: HDL-C ratio while controlling for FM. While the association with most CMR factors appears to be due to the confounding effects of adiposity [33], our finding is unique in that it shows the presence of low grade inflammation during childhood prior to the development of atherosclerosis and cardiovascular disease [34].
In adults, an hs-CRP value >1.0 has been shown to be an independent predictor for future cardiovascular events [34]. In children, however, there is a lack of evidence for defining critical cut-off points for hs-CRP. Guren et al. found that an hs-CRP > 1.04 mg/L had 58% sensitivity and 92% specificity of identifying children with coronary heart disease risk factors [35]. However, the relationship between hs-CRP and CMR factors was not adjusted for FM especially since the increased levels of hs-CRP were likely the consequence of underlying adiposity rather than the atherosclerotic process. In our study, we observed that a hs-CRP cut-off point of 2.0 gave a sensitivity of 58% and a specificity of 80% for a TG: HDL-C ratio of 3.0. Recently, Di Bonito et al. reported that TG: HDL-C ratio ≥2.0 was associated with several CMR factors and preclinical signs of cardiac abnormalities in a group of Caucasian children and adolescents [36]. However, they did not examine the relationship between TG: HD-C ratio and hs-CRP. Therefore, prospective studies with larger multi-ethnic population are needed to investigate the progression of hs-CRP values, their association with cardiovascular events, and the influence of hs-CRP lowering therapy.
There are well-documented differences in hs-CRP concentration distribution among different ethnic groups. The NHANES 1999-2000 showed that hs-CRP levels were higher in H than in C and AA groups after adjusting for age, BMI percentiles, smoking status, systolic blood pressure, and total cholesterol concentration [37]. In our study, C and H groups displayed higher hs-CRP levels than AA group. Hs-CRP levels were also higher in C than in H subjects, but this did not reach statistical significance.
Numerous studies have linked measures of adiposity to measures of inflammation in children without gender differences. Syme et al. showed that excess intra-abdominal fat was associated with higher hs-CRP levels in both female and male adolescents [38]. Similarly, the correlation between hs-CRP and FM was not significantly different across gender in our cohort. Contrary to our findings, Khera et al. showed that the quantity and distribution of body fat and sex-related differences in the inflammatory response to adiposity may influence hs-CRP levels to a greater extent in women as compared to men [39]. They used dual-energy x-ray absorptiometry and abdominal magnetic resonance imaging to quantify regional adipose tissue distribution. Finally, our cohort included children and adolescents in varying stages of puberty which may account for lack of gender differences in hs-CRP.
Also, there are also well-documented ethnic differences in HbA1c concentration distribution among diabetic and healthy children. Similar to data from the Third NHANES [40], we observed higher HbA1c levels in AA than C. Our study also showed that HbA1c was higher in AA than H. Both findings suggest that physiologic or genetic factors may contribute to racial differences in HbA1c glycation [41] independent of glucose concentration, but its impact on long- term complications is unknown.
Limitations to this study include lack of oral glucose tolerance data to assess glucose homeostasis and β-cell function in relationship to the TG: HDL-C ratio, particularly since HbA1c values were higher in AA group compared to C and H groups. The possible presence of impaired glucose tolerance among some of the participant cohort may have influenced our results [42]. Another limitation to the study is that there was no age- and sex-matched normal-weight controls for each ethnic group, and controls having children with impaired glucose tolerance and T2DM. Finally, a prospective study will be needed to further address the hypothesis that markers of dyslipidemia and other similar markers can identify overweight youth with decreased in vivo insulin sensitivity and inflammation.
The TG: HDL-C ratio can be utilized not only as a reliable independent marker for insulin resistance and inflammation, but also for identification of atherosclerosis risk in obese children and adolescents. Furthermore, defining insulin resistance is difficult since no clear guidelines or cutoffs exist for either HOMA-IR or fasting insulin concentrations. In addition, the use of glucose clamps method for diagnosis of insulin resistance, which is invasive, time consuming, and not practical in a clinical setting. Thus, surrogates of insulin resistance, which would be more practical and reliable in clinical settings, should be proposed. Our study demonstrates that the pro-inflammatory state likely tracks from childhood. The TG: HDL-C ratio could prove to be a useful, readily available biomarker of CMR in obese youth that could provide opportunities for prevention of atherosclerosis in adulthood.
This study was funded by the Diabetes Research Fund, Department of Pediatrics, Medical College of Wisconsin, Milwaukee, WI, USA.
Ola Kawadry contributed to data collection and writing the manuscript. Jessica Kichler contributed to data analysis and writing the manuscript. Raymond G. Hoffmann contributed to data analysis and editing. Mahua Dasgupta contributed to data analysis. Ramin Alemzadeh contributed to data collection, data analysis, and writing and editing the manuscript.

![]()

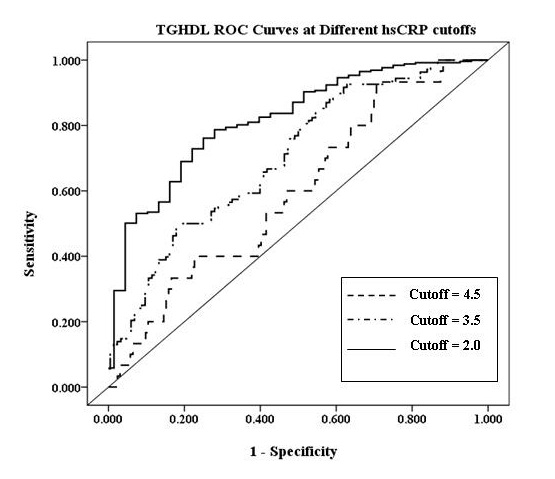 |
| Figure 1: TG:HDL-C ratio ROC curves at different hs-CRP cutoffs |
Parameter |
All |
Caucasians (C) |
Hispanics (H) |
African Americans (AA) |
N (%) |
133 |
55 (41.4) |
40 (30.1) |
38 (28.6) |
Age (years) |
13.9 ± 2.3 |
14.2 ± 2.0 |
13.4 ± 2.1 |
14.0 ± 2.6 |
Gender (% female) |
64.7 |
63.6 |
62.5 |
68.4 |
Tanner Stage |
3.8 ± 1.0 |
3.9 ± 1.0 |
3.7 ± 1.0 |
3.9 ± 1.1 |
BMI-z |
2.4 ± 0.3 |
2.4 ± 0.4 |
2.4 ± 0.3 |
2.5 ± 0.3 |
Fat Mass (%) |
44.9 ± 7.7 |
44.1 ± 8.3 |
45.1 ± 6.2 |
45.9 ± 8.2 |
Systolic blood pressure (mm Hg) |
127 ± 14 |
129 ± 15 |
125 ± 10 |
127 ± 17 |
Diastolic blood pressure (mm Hg) |
68 ± 9 |
69 ± 9 |
66 ± 7 |
69 ± 10 |
Glucose (mmol/L) |
5.0 ± 0.4 |
5.0 ± 0.4 |
5.0 ± 0.4 |
4.9 ± 0.4 |
Insulin (pmol/L) |
211.0 ± 112.0 |
197.1 ± 98.6 |
205.6 ± 95.6 |
236.7 ± 141.3 |
HOMA-IR |
6.6 ± 3.6 |
6.1 ± 3.1 |
6.6 ± 3.2 |
7.4 ± 4.4 |
HbA1c (%) |
5.3 ± 0.4 |
5.1 ± 0.4 |
5.3 ± 0.4 |
5.4 ± 0.4a |
Cholesterol (mmol/L) |
4.8 ± 0.9 |
4.7 ± 0.8 |
4.7 ± 0.9 |
4.8 ± 0.9 |
LDL-C (mmol/L) |
2.9 ± 0.7 |
2.8 ± 0.6 |
2.7 ± 0.8 |
3.1 ± 0.8 |
HDL-C (mmol/L) |
1.06 ± 0.3 |
1.07 ± 0.3 |
1.01 ± 0.3 |
1.10 ± 0.3 |
TG (mmol/L) |
1.72 ± 0.7 |
1.81 ± 0.7 |
1.82 ± 0.8 |
1.45 ± 0.8a |
TG:HDL-C |
4.1 ± 2.5 |
4.2 ± 2.3 |
4.4 ± 2.2 |
3.5 ± 2.9a |
hs-CRP (mg/L) |
3.1 ± 1.2 |
3.3 ± 1.1 |
3.2 ± 1.0 |
2.5 ± 1.3b |
Metabolic Syndrome (%) |
55.6 |
58.2 |
62.5 |
44.7a |
| Data are expressed as mean ± SD ap< 0.05; AA vs. C and H bp< 0.01; AA vs. C and H Table 1: Clinical and biochemical characteristics of subjects based on ethnicity |
||||
Caucasian (C) |
Hispanic (H) |
African American (AA) |
KW p-value |
|||||||||
N |
55 |
40 |
38 |
NA |
||||||||
TG: HDL Ratio |
4.2 ± 2.3 |
4.4 ± 2.2 |
3.5 ± 2.9a,b |
0.02 |
||||||||
hsCRP (mg/L) |
3.3 ± 1.1 |
3.2 ± 1.0 |
2.5 ± 1.3b |
0.006 |
||||||||
HbA1c (%) |
5.1 ± 0.4 |
5.3 ± 0.4 |
5.4 ± 0.4c |
0.0006 |
||||||||
| Data are expressed as mean ± SD; Mann-Whitney Wilcoxon Test has been used for each pair ap<0.05, AA vs. C bp<0.01 AA vs. H cp<0.001 AA vs. C Table 2: Kruskal-Wallis (KW) test for Ethnicity |
||||||||||||
Variable |
TG:HDL-C |
HOMA-IR |
hs-CRP |
HbA1c |
||
TG:HDL-C |
1.00 |
0.20a |
0.46c |
0.01 |
||
HOMA-IR |
1.00 |
0.14 |
0.24b |
|||
hs-CRP |
1.00 |
-0.04 |
||||
HbA1c |
1.00 |
|||||
| ap<0.05 bp<0.01 cp<0.001 Table 3: Bivariate correlations controlling for FM, gender, and ethnicity |
||||||
hs-CRP Cut-off |
Sensitivity |
Specificity |
||
2.0 |
58% |
80% |
||
3.0 |
59% |
80% |
||
3.5 |
51% |
78% |
||
4.0 |
54% |
60% |
||
4.5 |
50% |
54% |
||
| Table 4: TG: HDL-C ratio ROC curves at different cut-offs for hs-CRP | ||||


