Open Access
Research Article
Max Screen >>
ISSN: 2455-7633
Copyright: © 2016 Osama Y Safdar. This is an open-access article distributed under the terms of the Creative Commons Attribution License, which permits unrestricted use, distribution, and reproduction in any medium, provided the original author and source are credited.
Related article at Pubmed, Google Scholar
Introduction: Obesity is a global program that is increasing worldwide and associates with high morbidity and mortality. Increase left ventricular mass is a target organ damage that is related to increase in blood pressure. Some evidence suggests that obesity is an independent risk factor for the development of increase left ventricular mass.
Methods: This study was a cross sectional observational study conducted in King Abdulaziz University Hospital (KAUH) A Sample of 67 children with different ages was recruited from the pediatric outpatient clinic. Obesity was defined using the Center for disease control (CDC) charts for Body Mass Index (BMI). Obesity defined as BMI weight more than 95th percentile, overweight defined as BMI between 85th to 94th percentile and normal body weight defined as BMI between 5th to 84th percentiles According to the BMI obtained, the study sample was then divided into two subgroups; Normal weight for age group and overweight obese group. Systolic and diastolic left ventricular mass index were assessed and measured with 2D echocardiography along with the ejection fraction percentages.
Results: Only 59 children (24 males = 40.68% and 35 females = 59.32) were included and the sample were divided into two groups (normal body weight group which constitutes 42.37% of the sample and obese/overweight group which constitutes the remainder 57.63%).The mean (SD) of LV mass index in systole g/m2 was statistically significantly greater in the Obese/Overweight group 82.70 (21.86) compared to the Normal body weight group 69.85 (16.64), t(57) = 2.481 and p = 0.016. The mean difference was 12.85 with [95% CI: 2.48 to 23.21].
The mean (SD) of LV mass index in diastole g/m2 was statistically significantly greater in the Obese/Overweight group 61.57 (15.72) compared to the Normal body weight group 52.05 (15.69), t(57) = 2.309 and p = 0.025. The mean difference was 9.51 with [95% CI: 1.26 to 17.76].
Conclusion: Obesity associates with increase left ventricular mass index in systole and diastole.
Keywords: Left Ventricular Hypertrophy; Children; Obesity
Obesity is a global problem and is associated with multiple health disorders including diabetes mellitus, hypertension and cardiovascular disease [1]. While obesity affects all age groups, there has been a recent rise in the rate of childhood obesity with significant short- and long-term consequences and serious complications that persist well into adulthood [2,3]. In a review by Han and colleagues, childhood obesity is described as a multifaceted disease that has a detrimental impact on most vital organ systems, resulting in a multiplex of chronic sequelae including hypertension, insulin resistance, dyslipidemia and psychosocial deterioration. A surge in adult mortality and morbidity is linked with childhood obesity along with potentially life threatening pathologies [4].
In the last decade, the incidence of obesity has increased worldwide in the youth population and is most likely related to changes in lifestyle and dietary habits with an increase in the consumption of unhealthy food [5]. This trend has become a mounting public health concern across the globe. In the western hemisphere and in the U.S. in particular, 31.7% of children are considered to be overweight and 16.9% are considered obese [6].
In comparison, the prevalence of overweight, obese and severely obese children in Saudi Arabia is 23.1%, 9.3% and 2%, respectively [7]. In this vulnerable population, an increased BMI is associated with many cardiac disorders that primarily involve atherosclerotic changes. This is particularly evident in the pediatric age group with BMI values above the 97th percentile. Additionally, pulmonary diseases, such as obstructive sleep apnea and reactive airway disorders, are common presentations in obese children compared with their non-obese counterparts [8].
Excessive intake of fatty meals in addition to sugary food consumption and the large amount of fast food chains have led the younger population to lead a life of physical inactivity. The modern technological advancements of online gaming and easy accessibility of indoor entertainment such as electronic tablets and television have inadvertently caused the new generation to abandon active outdoor lifestyles in favor of sedentary ones [9].
The sedentary lifestyle and physical inactivity of the juvenile population has resulted in an increased risk of developing cardiovascular disorders [10]. A pattern of increased left ventricular mass is being identified with increased frequency in overweight and obese youth [11]. Left ventricular hypertrophy is a silent marker of target organ damage and is mainly due to elevated blood pressure [12]. Childhood obesity is also associated with varying abnormalities of cardiac geometry and function including left ventricular hypertrophy and impairment of diastolic function that is independent of hypertension [13].
There is a paucity of studies in the Middle East evaluating the relationship between left ventricular hypertrophy and childhood obesity. This is in part due to the absence of a joint national database with reliable data from all regions of the kingdom and a lack of periodic surveillance data that targets the pediatric age group [14].
This study aimed to determine if left ventricular mass is increased in obese children compared with the left ventricular mass of children who have a normal body weight.
This was a cross sectional observational study conducted at King Abdulaziz University Hospital (KAUH).
In total, 67 children of different ages were recruited from the pediatric outpatient clinic during the 2014/2015 academic year. Informed consent was approved by Ethical Committee of Medical Researchers, and signed informed consent forms were obtained from the patients’ parents.
Healthy children between 5-18 years were included, while participants with chronic medical diseases were excluded from the study.
A data sheet was completed and organized in a corresponding database that included the following demographic data: age, gender, blood pressure, and anthropometric measures such as weight in kilograms (using an electronic scale) and height in cm (using a height scale). Waist circumference was measured according to the World Health Organization (WHO) STEPS protocol that recommends the measurement be made at the approximate midpoint between the lower margin of the last palpable rib and the top of the iliac crest [15].
Obesity was defined using the Center for Disease Control (CDC) charts for Body Mass Index (BMI). Obesity was defined as a BMI at or above the 95th percentile, overweight was defined as a BMI at or above the 85th percentile and lower than the 95th percentile, and normal body weight was defined as a BMI between the 5th to less than the 85th percentile [16].
Based on BMI, the study sample was then divided into two subgroups: a normal weight for age group and an overweight/obese group.
Blood samples were obtained from the majority of the participants to determine serum levels of fasting blood glucose, glycated hemoglobin (HbA1c) lipid profile including low-density lipoprotein (LDL), high-density lipoprotein (HDL) and triglycerides. Method used to calculate ejection fraction: automatically calculated by the echocardiography machine GE Vivid E9, which is programed to do all the left ventricular quantification and volumetric measurement data including LV linear measurements and calculations at the end of diastole and the end of diastole (LVIDD, LVIDS, EF, SF, and LV mass) from 2D image or M-mode from a parasternal long or short axis views. The LV mass was calculated using the formula recommended by the American society of echocardiogram for estimation of LV mass from LV linear dimensions, LV mass = 0.8 x {1.04[(LVIDd + PWTd + SWTd)3 - (LVIDd)3]} + 0.6 g
where PWTd and SWTd are posterior wall thickness at end diastole and septal wall thickness at enddiastole, respectively.
LV ejection faction can be calculated using any of the two methods recommended by the ASE which are the linear method or volumetric method (modified simpson’s rule of disc) which is based on the apical endocardial tracing of the LV in diastole and systole where the LV is assumed to be bullet-shaped. The mid-LVcross-sectional area is computed by planimetry in the parasternal short-axis view and the length of the ventricle is taken from the midpoint of the aortic annulus to the apex in the apical 4-chamber view and then left ventricular ejection fraction LVEF is calculated using the formula EF % = EDV-ESV/EDV x100, where LVEF is, EDV and ESV are LV end diastolic and end diastolic volume respectively, in our study we elected to use the volumetric method to avoid any misleading error in case of asymmetry in LV linear dimensions.
Both systolic and diastolic left ventricular mass indexes were assessed and measured by 2-D echocardiography along with the ejection fraction. Echocardiograms were, the procedure was performed by two trained technicians, and the results were read by an experienced pediatric cardiologist.
Statistical analysis was performed using the Statistical Package for Social Sciences Version 20.0 software package. The results were reported as the mean and standard deviation (mean ± SD) for continuous data and as a percentage for categorical data. The Chi-Square test was used to evaluate the relationship between gender variables and BMI status, and an independent t-test was used evaluate differences in the means between the normal body weight and the overweight/obese groups. ANOVA was used to test for differences between normally distributed groups, and the non-parametric Mann-Whitney test was employed to test for differences between the groups that were not normally distributed.
A total of 61 children between the ages of 5 and 18 years old were investigated during the specified time period, and the sample was divided into two groups (a normal body weight group and an obese/overweight group). Two children were excluded from the final LV mass analysis due to missing echocardiogram reports. Furthermore, only 40 of the participants from the final study sample (N = 59) had blood samples for measurement of fasting serum glucose, lipid profile.
The mean (SD) age of the total study sample was 11.28 (3.18) years. The normal body weight group had a mean (SD) age of 11.46 (3.34) years, and the obese/overweight group had a mean (SD) age of 11.04 (3.0) years.
There was a significant relationship between gender and BMI status (P <0.003) as the following table shows and obesity &overweight were significantly higher in in male comparing to female patients see Table 1.
Descriptive lab results for fasting LDL, fasting blood glucose, HbA1C, ejection fraction, waist circumference are shown in Table 2.
Fasting LDL and HBA1C were significantly higher in obese+overweight comparing to children with normal body weight. Fasting blood glucose and ejection fraction were not statically different in obese+overweight comparing to children with normal body weight (see Table 3a).
LV mass index S g/m2: The mean (SD) of the LV mass index S g/m2 was significantly greater in the obese/overweight group 82.70 (21.86) compared the normal body weight group [69.85 (16.64), t (57) = 2.481 and p = 0.016]. The mean difference was 12.85 [95% CI: 2.48 to 23.21] (See Table 3b, 4 and Figure 1).
LV mass index D g/m2: The mean (SD) of the LV mass index D g/m2 was significantly greater in the obese/overweight group 61.57 (15.72) compared with the normal body weight group [52.05 (15.69), t (57) = 2.309 and p = 0.025]. The mean difference was 9.51 [95% CI: 1.26 to 17.76] (See Table 3b, 4 and Figure 2).
Childhood obesity has reached epidemic proportions in developed countries, and its prevalence is rising in the Middle East as well [17]. Obesity and overweight have become a major health problem and are a growing health concern because of the dramatic escalation in these conditions over the last few years, almost doubling in prevalence. Obesity has been reported in 9.3% of school-aged children, and 23% of children are overweight [18]. A study of male children in Saudi Arabia between the ages of 6 and 18 years by Al-Nuaim and colleagues found that one out of every six children in Saudi Arabia is obese [19]. Similarly, in this study, more than half of the children were either overweight or obese. Furthermore, while more females were of normal body weight, the majority of the males were either overweight or obese.
Common risk factors for obesity include a family history, minimal physical activity, higher socioeconomic status, urban residence, unhealthy food and sedentary lifestyles. Obese children tend to retain their extra weight and carry it into adulthood, thus contributing to the increase in obesity rates in adulthood along with the high morbidity and mortality resulting from serious obesity-related health consequences. Childhood obesity is not without its own immediate adverse outcomes including endocrinopathies, cardiovascular diseases and other obesity-related disorders such as nonalcoholic fatty liver disease (NAFLD), obstructive sleep apnea (OSA), depression and anxiety, which are conditions previously encountered primarily in older age groups [20].
An association between an overweight/obese status and changes in cardiac structure, specifically left ventricular mass index, has been previously reported in children. These structural changes may alter cardiac function and lead to cardiac complications even in normotensive individuals [21]. The presence of left ventricular hypertrophy in childhood is alarming evidence of target organ damage that must be addressed. This study confirms that obese and overweight children have a significant increase in left ventricular mass in both systolic and diastolic phases of the cardiac cycle. In our study, obesity was significantly associated with a high LV mass index, both systolic and diastolic. This result agrees with those of the Hietalampi study, which was conducted in a Finnish population. The authors found that eccentric and concentric LV remodeling was positively correlated with weight and body mass index [22]. In the same study, left ventricular mass was also correlated with birth weight, indicating that the dynamics underlying cardiac remodeling begin at birth.
Although the children are asymptomatic, the presence of an increased left ventricular mass is alarming in this age group. Our findings are similar to those reported in adults in whom a strong correlation has been identified between left ventricular mass, obesity and the metabolic syndrome. The TODAY study reported that the incidence of elevated left ventricular mass was 16.2% among obese adults [23].
There are several limitations to this study. First, as a pilot study that included only 59 subjects, the actual prevalence of left ventricular mass hypertrophy in obese children and the prevalence of obesity itself are likely to be underestimated. Second, although the participants were randomly recruited, there was a discrepancy between the genders, their respective weights and their ages, which may bias the results.
In the future, a national multi-center study should be undertaken with a larger sample size to confirm our findings. In addition, inclusion and exclusion criteria should be more refined to avoid bias. Lastly, additional contributing variables should be identified by investigating potential correlations between serum fasting blood glucose levels, HbA1c and lipid profiles including total cholesterol, LDL, HDL and triglycerides with childhood obesity and left ventricular hypertrophy.
Very few studies have been performed in the pediatric age group. To our knowledge, this is the first study conducted in children that assessed the relationship between obesity and increased left ventricular mass.
In Saudi children, obesity is a risk factor for the presence of increased left ventricular mass.

![]()

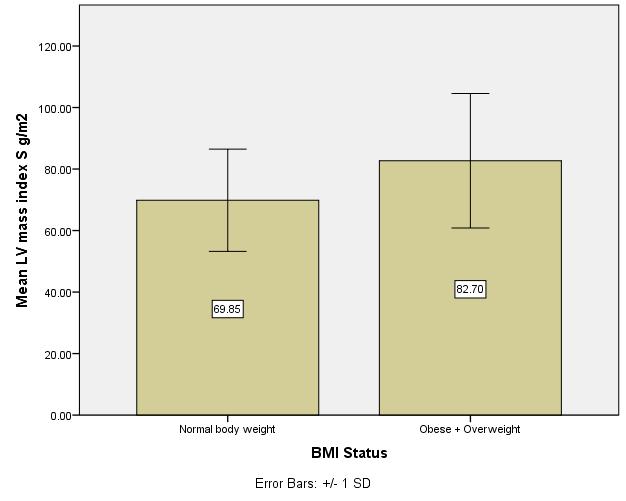 |
| Figure 1: Mean LV mass index in systole is significantly greater in obese+overwight comparing to children with normal body weight with p-value 0.016 |
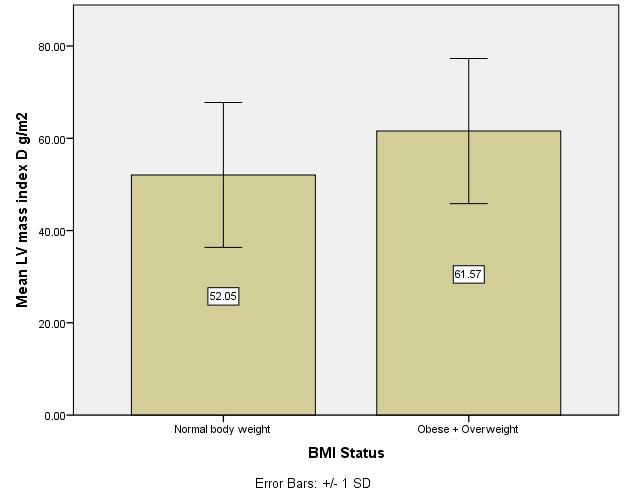 |
| Figure 2: Mean LV mass index in diastole is significantly greater in obese+overwight comparing to children with normal body weight with p-value 0.025 |
BMI Vs Gender |
||||
BMI Status |
||||
Normal body weight |
Obese + Overweight |
Total |
||
Gender |
Male |
5 |
20 |
25 |
Female |
21 |
15 |
36 |
|
Total |
26 |
35 |
61 |
|
Table 1: Gender and BMI status showed that obesity &overweight is more common in male comparing to female with p-value < 0.003 |
||||
Descriptive Statistics |
||||||||
N |
Mean |
Std. Deviation |
Minimum |
Maximum |
Percentiles |
|||
25th |
50th (Median) |
75th |
||||||
Fasting LDL |
40 |
2.5797 |
.67822 |
.02 |
3.96 |
2.2200 |
2.6650 |
2.9400 |
Fasting BLOOD SUG |
40 |
4.9725 |
.39613 |
4.20 |
6.10 |
4.7250 |
4.9000 |
5.1000 |
HBA1C |
40 |
5.5128 |
.41108 |
4.50 |
6.70 |
5.2400 |
5.5000 |
5.7750 |
EF % |
40 |
62.48 |
8.838 |
27 |
83 |
60.25 |
63.50 |
66.00 |
WC |
40 |
77.57 |
18.11 |
55 |
106 |
70 |
77.6 |
86013 |
FS % |
40 |
35.32 |
6.285 |
30 |
66 |
32.00 |
34.00 |
36.00 |
Weight Status (Non-Obese, Obese) |
39 |
1.44 |
.502 |
1 |
2 |
1.00 |
1.00 |
2.00 |
Table 2: Descriptive table for fasting LDL, fasting blood glucose, HBA1C , EF: ejection fraction WC: waist circumference |
||||||||
Weight Status (Non-Obese, Obese) |
N |
Mean Rank |
Sum of Ranks |
p-value |
|
Fasting LDL |
Non-Obese |
22 |
16.41 |
361.00 |
|
Obese |
17 |
24.65 |
419.00 |
||
Total |
39 |
0.025 |
|||
Fasting BLOOD SUG |
Non-Obese |
22 |
17.66 |
388.50 |
|
Obese |
17 |
23.03 |
391.50 |
||
Total |
39 |
0.142 |
|||
HBA1C |
Non-Obese |
22 |
16.20 |
356.50 |
|
Obese |
17 |
24.91 |
423.50 |
||
Total |
39 |
0.018 |
|||
EF % |
Non-Obese |
22 |
18.09 |
398.00 |
|
Obese |
17 |
22.47 |
382.00 |
||
Total |
39 |
0.232 |
|||
FS % |
Non-Obese |
22 |
18.66 |
410.50 |
|
Obese |
17 |
21.74 |
369.50 |
||
Total |
39 |
0.400 |
|||
Table 3a: Descriptive table Mann-whitney test comparing lab results in obese+overweight to children with normal bodyweight |
|||||
BMI Status |
Mean |
Std. Deviation |
|
Normal body weight |
LV mass index S g/m2 |
69.8508 |
16.64251 |
LV mass index D g/m2 |
52.0535 |
15.68961 |
|
Obese + overweight |
LV mass index S g/m2 |
82.6976 |
21.86359 |
LV mass index D g/m2 |
61.5655 |
15.71989 |
|
Table 3b: Mean of Left ventricular mass index in systole (S) and diastole (D) in normal body weight comparing to obese+overweight |
|||
Independent Sample Test |
||||
t |
df |
Significance (2-tailed) |
Mean difference |
|
LV mass index S g/m2 |
2.481 |
57 |
0.016 |
12.84681 |
LV mass index D g/m2 |
2.309 |
57 |
0.025 |
9.51199 |
Table 4: Independent sample t-rest showed that left ventricular mass index is significantly greater in systole & diastole in obese+overweight comparing to normal body weight |
||||


