Open Access
Research Article
Max Screen >>
ISSN: 2393-9060
Copyright: © 2021 Ariff S. This is an open-access article distributed under the terms of the Creative Commons Attribution License, which permits unrestricted use, distribution, and reproduction in any medium, provided the original author and source are credited.
Related article at Pubmed, Google Scholar
Obesity is considered a serious health hazard. It predisposes the individual to many disorders, such as diabetes and heart disease, it shortens the life span, and it complicates childbirth and surgery. This study was a cross-sectional study conducted in health centers at Khartoum locality during November 2018- January 2019; aimed to predict mortality among a young female Sudanese population enrolled in health centers.
The total sample of this study was 80 obese females, were 20-45 years enrolled into two randomly selected health centers. All obese females who fit the criteria and approved to be included have been selected as respondents. Primary data was obtained through questionnaires, anthropometric and other relevant measurements; main tool utilized is the Edmonton’s obesity staging system (EOSS).
The prevalence of EOSS stages 0 (no risk factors or co-morbidities), 1 (mild conditions), 2 (moderate conditions), and 3 (significant conditions) were 22.5%, 12.5%, 45.0%, and 20.0%, respectively. All variables except for functional, of the EOSS had showed a positive correlation with BMI.
Considering the progression of co- morbidities with BMI shifts, same trend with the other variables, the relationship between EOSS variables and BMI was found to be linear. Further in- depth studies, a cohort prospective study should be carried, with objective to predict morbidity and mortality, to provide data for population studies and suggest suitable solutions.
Keywords:Anthropometric, BMI, Obesity, Females, Sudan.
Obesity is a condition that results from excessive storage of fat in the body [1]. Worldwide obesity has nearly tripled since 1975. In 2016, more than 1.9 billion adults, 18 years and older, were considered to be overweight and of these over 650 million were obese. Adults aged 18 years and over, 35% were overweight, and 13% were obese. In Sudan, The prevalence of obesity in 2017 was found to be 21.2% with a higher rate of obesity in female than male [2]. Most of the world's population live in countries where overweight and obesity kills more people than underweight. It has been predicted that there will be 65 million more adults with obesity in the USA and 11 million more adults with obesity in the UK by the year 2030 [3]. The rates are increasing drastically, but obesity is known to be preventable. Many low and middle-income countries such as African countries are now facing a "double burden" of disease; while these countries continue to deal with the problems of infectious diseases and under nutrition, they are also experiencing a rapid upsurge in non-communicable disease risk factors such as obesity and overweight, particularly in urban settings. It is not uncommon to find under nutrition and obesity co-existing within the same country, the same community and the same household [4]. For example, where Sudan is a developing country with a high under nutrition rate, the prevalence of obesity amongst its young people was found to be 24.5% in December 2017 [5]. Obesity is measured using variety of approaches. Anthropometric measurements are used to assess the size, shape and composition of the human body. The methods used to gather these measurements are like body mass index (BMI) [6].
The most common classifications of obesity are based on simple clinical measures such as BMI or waist circumference [7]. The BMI or Quetelet’s index has been proposed for determining ideal body weight for height [8]. People are generally described overweight when their BMI exceeds 25 kg/m2, with the range 25-30 kg/m2 defined as overweight, thus the pre-obesity consider as a MBI between 25-30 kg/m2 and 30 kg/m2 or more defined as obesity [9]. The BMI, although a good indicator for conducting epidemiology studies, it is limited for measuring the individual risk that the person may endure [6].
The Edmonton Obesity Staging System (EOSS) is a five-stage system of obesity classification that considers the metabolic, physical, and psychological parameters in order to determine the optimal obesity treatment. EOSS has been reported to be better predictor of mortality than BMI or metabolic syndrome. Furthermore, it measures the disease continuum from a functional point of view [9].
In Khartoum locality, the fast food industry is multiplying drastically. Obesity is to some extent not perceived as fatal, but it is indeed on the long run. Population studies are lacking about mortality rates in Sudan associated with obesity. The methodologies of obesity measurements are very essential for population studies. However, BMI possesses well-known limitations at the individual level, including the inability to directly distinguish between lean and fat tissue. Furthermore, neither BMI nor waist circumference directly reflects the presence of underlying obesity related comorbidity, reduced quality of life or diminished functional status, elements that are widely considered to be critically important to the clinical assessment of patients with excess body weight [10]. Using a more individualized approach such as the EOSS staging system, provide more accurate predictions of morbidity and mortality amongst young Sudanese female population by using Edmonton’s obesity staging system, with complicated conditions, with an aim to control and receive most intense treatment regimens. Furthermore, this research provides a novel approach that can contribute to epidemiological studies associated with obesity.
As reference, these two different studies used the EOSS staging system tool in their research, which will demonstrate a great example of the practicality, and how the different purposes achieve data used to predict mortality. The first research was carried out in Edmonton, Canada, to determine the distribution of EOSS stages and differences in weight loss achieved according to EOSS stage, in patients attending a referral-based publically funded multisite weight management clinic. Their results were as follows, the prevalence of EOSS stages 0 (no risk factors or co-morbidities), 1 (mild conditions), 2 (moderate conditions), and 3 (severe conditions) was 1.7%, 10.4%, 84.0%, and 3.9%, respectively [16]. The second study EOSS have also been used for predicting post-operative mortality. In a center of maximum care in Germany, a prospective study has been carried with patients undergoing laparoscopic sleeve gastrectomy (LSG), laparoscopic Roux-en-Y gastric bypass (LRYGB), or laparoscopic omega-loop gastric bypass (LOLGB). The data collected included preoperative EOSS score, gender, age, BMI, waist circumference, waist-to-hip ratio, co-morbidities, early postoperative complications, and 30-day mortality [17].
Sample size was two health centers at Khartoum locality have been selected randomly (VLCC and Sama style Center). Eighty obese females were selected using purposive sampling, as based on availability and acceptance, not many of the population were willing to participate on the research due to personal reasons. The Inclusion Criteria for the study are all obese females enrolled in health centers who are 20-45 years.
Data collection and tools methods by BMI calculated using equation, BMI=weight (Kg)/height (m2), classified to class 1 (30-34.9BMI kg/m2), class 2 (35-39.9 BMI kg/m2) and class 3 (≥40 BMI kg/m2) according to WHO [10]. Also Electronic hand dynamometer Camry 90KG Digital Hand Dynamometer Grip Strength Measurement Meter Auto Capturing (Camry Body Fat Scale EF 973-Dx), Hand Grip Power was used to measure the muscle strength as adjusted according to age and gender, two pre-standardized questionnaires with scoring systems were used, hospitals anxiety and depression questionnaire (HADS) used to predict the psychological score for the patients [12], and Epworth sleepiness scale (ESS) for scoring system indicates patient could have the disorders [13]. The scores deducted from the pre-standardized and anthropometric measurements are all added to one cover page per sample. The data collected includes age, weight, height, BMI, Muscle strength, hospitals anxiety and depression questionnaire (HADS) score, Anxiety score, ESS Score, Medical condition, Mobility and work performance, Quality of life (predicted score), and EOSS Stage (conclusion). Edmonton Obesity Staging System is used to stratify patients according to severity of obesity-related comorbidities and barriers to weight management into five graded categories, and for the purpose of this research is used to predict mortality [14].
The stages distribution of the Edmonton Obesity Staging System across the participants, across the three BMI classes, and the frequency of the BMI classes across the samples.
Table 1 shows the results of the EOSS distribution concluded for each sample. Each variable of the EOSS (Co-Morbidity-Psychological-Functional-Quality of life) was ranked in accordance with qualitative ordinal data (Non-Mild-Moderate-Significant). The highest rank of the sample according to the results, determined the stage of the obesity of the patient. Close to half (45%) of participants were found to be in stage 2 EOSS, and close to one quarter (22.5%) was found to be the percent of patients in stage 0. One fifth (20%) had significant result of the sample were in stage 3, and finally one-eighth (12.5%) were found to be in stage 1. Thus the prevalence of EOSS stages 0 (no risk factors or co-morbidities), 1 (mild conditions), 2 (moderate conditions), and 3 (significant conditions) were 22.5%, 12.5%, 45.0%, and 20.0%, respectively.
A study in 2011 was carried out in Edmonton, Canada, to determine the distribution of EOSS stages and differences in weight loss achieved according to each EOSS stage, in patients attending a referral-based publically funded multisite weight management clinic. Their results were as follows, the prevalence of EOSS stages 0 (no risk factors or co-morbidities), 1 (mild conditions), 2 (moderate conditions), and 3 (severe conditions) were 1.7%, 10.4%, 84.0%, and 3.9%, respectively [5]. Less than half (45%) had moderate conditions in this study’s sample size compared to the Edmonton sample, which was (84.0%).
Close to one quarter (22.5%) of the Sudanese sample seeking weight loss, had no risk factors or co-morbidity, where very few (1.7%) had no risk factors in the Edmonton sample. The difference is because in the Edmonton sample it was a referral-based weight management clinic, so the samples deducted from that clinic are already referred by physician’s, which means they already had a condition. Conversely, the health centers in this study were for all conditions, including people without health problems visiting to achieve weight loss.12.5% of this study’s sample had mild conditions and only a few (10.4%) of the Edmonton sample. Similar low percentages, because patients in mild either do not lose weight due to perceiving the condition as not serious, or they enroll and lose weight to achieve prevention; these had differences as the areas in comparison have different food habits, lifestyles and health care systems; but Similar to the health center in Sudan.
Table 2 describes the frequency of the BMI classes across the 80 samples. Near two-third (70%) of the sample size was found to be the number of samples in Class 1 BMI while near to one-fifth (17.5%) was found to be the frequency of the samples in Class 2 BMI. The rest, leaving a few (12.5%) were found to be in Class 3 BMI.
The Body Mass Index of each sample was used as a comparative variable. First the EOSS stages distribution across the three different BMI classes was derived and presented in the form of doughnut charts (Figure 1).
BMI classes
Class 1 reveals the distribution of stages according to EOSS across BMI class 1. Close to the half (43%) was found to be the prevalence of stage 2, and near to one third (29%) was the prevalence of stage 0. while few (16%) were of stage 1 and only (13%) was found to be stage 3.
Class 2 shows the distribution of stages according to EOSS across BMI class 2. More than half (64%) was found to be the prevalence of stage 2, and near to one third (22%) was the stage 3. (14%) were the percentage of stage 1 none in stage 0.
Class 3 demonstrates the distribution of stages according to EOSS across BMI class 3, two third (60%) was found to be the prevalence of stage 3, and near to one third (30%) was the prevalence of stage 2. only (10%) were the percentage of stage 1 and none in stage 0.
Side by side, these figures show the increase or decrease in percentages of the stages. In the sample of the young Sudanese obese population, the EOSS stages 2 & 3 become exponentially more apparent with increase of BMI class. Evidentially shows the percent of increased risk, and severity.
Stage 3 across the three BMI classes starting from class 1 to class 2 to class 3 was 13% to 22% to 60%, similar trend to stage 2 but with a drop at class 3, results were 43% to 64% to 30%. The sudden drop of stage 2 in class 3 explains the sharp rise of stage 3 in class 3. The patients in stage 2 and class 3 were at a very high tendency to be from the 30% who were no longer stage 2 or 60% who were in stage 3 of class 3.
Class 1 demonstrates for patients according to BMI, the percentage of each ordinal data of the co-morbidities. Near to half )46%) was found to be the percentage of patients with no co- morbidities, and one quarter (25%) was the prevalence of patients with Moderate co-morbidities. Near to one quarter (20%) were with Mild co-morbidities and very few (9%) with significant co- morbidities.
Class 2 reveals for patients according to BMI, the percentage of each ordinal data of the co- morbidities. Less than half (43%) was found to be the percentage of patients with Moderate co- morbidities, and more than one third (36%) with no co-morbidities. Few of them (14%) were the percentage of patients with significant co-morbidities and only (7%) with Mild co-morbidities.
Class 3 shows for patients according to BMI, the percentage of each ordinal data of the co- morbidities. Half (50%) was found to be the percentage of patients with Significant co- morbidities, and near to one third (30%) was the prevalence of patients with Mild co-morbidities. Almost one quarter (20%) were the percentage of patients with Moderate co-morbidities and none of them (0%) with no co-morbidities.
These figures proved that there is a linear correlation between the co-morbidities and the increase in BMI ratio (Figure 2). Evidently as the significant co-morbidities percentage increase along the three classes of BMI (9% to 14% to 50%). The sharp rise in class three BMI, predicts the risk of significant morbidities to the patients with BMI at borderlines of class 2 and class 3 BMI (39-40kg/m2). Also proves that percentages of patients with no co-morbidities diminish as the classes increase, as evident by the rate drop from (46% to 36% to 0%).
Class 1 indicates for patients according to BMI, the percentage of each ordinal data of the psychological variable. Less than half of patients (42%) was found to be with normal psychological condition, near to one third (35%) were found to be of patients with abnormal depression or anxiety score. (14%) was found to be the patient with mild or borderline physiological condition; (7%) was found to be the percentage of patients with moderate psychological factors, and only (2%) was the percentage of patients with significant psychological conditions.
Class 2 demonstrates for patients according to BMI, the percentage of each ordinal data of the psychological variable. Near to one third (36%) was found for both normal and abnormal, (14%) were found to be the prevalence of patients with mild psychological condition, and only (7%) with moderate conditions and same as with significant conditions.
Class 3 illustrates for patients according to BMI, the percentage of each ordinal data of the psychological variable. More than half (70%) were found to be the percentage of participants with abnormal psychological conditions, (10%) were found to be with normal conditions, (10%) patients with mild conditions and (10%) patients with moderate conditions. None of them (0%) were found to have significant psychological conditions.
These figures are of particular importance as it demonstrates that the psychological parameter was of high relevance with the increase of BMI in the young Sudanese obese population (Figure 3). Abnormality in the psychological parameter increases dramatically from 35% to 36% to 70% with BMI class. The reverse applies to Normality; this data points towards psychopathological and psychosomatic indicators- mental health issues.
Class 1 illustrates for patients according to BMI, the percentage of each ordinal data of the functional limitations. More than half (61%) of patients were a normal functional limitation, and near to one quarter (21%) was the prevalence of patients with a weak functional limitation, and the rest (18%) with a strong functional limitation.
Class 2 demonstrates for patients according to BMI, the percentage of each ordinal data of the functional limitations. More than half (57%) of participants with a normal functional limitation, and more than one third (36%) was the prevalence of patients with a weak functional limitation, and the rest (7%) with a strong functional limitation.
Class 3 shows that the patients according to BMI, the percentage of each ordinal data of the functional limitations. The majorities (80%) of patients were with a normal functional limitation, and near to one quarter (20%) of respondents were with a weak functional limitation, and none of them (0%) with a strong functional limitation
Functional limitations data not as consistent as other parameter correlations, however there was evidence that “Strength” diminishes with each subsequent BMI class (Figure 4). Functional limitations were a function of increased obesity but not an absolute correlation. This may be a direct reflection of differing physical activity amongst the obesity sample base.
Class 1 shows that the participants according to BMI, the percentage of each ordinal data of the quality of life variable; more than half (53%) of patients with a Normal “quality of life”, and more than one third (36%) was the prevalence of patients with Moderately impacted quality of life, only (11%) were the percentage of patients with a significantly impacted quality of life.
Class 2 reveals the respondents according to BMI, the percentage of each ordinal data of the quality of life variable; more than half (64%) was found to be the percentage of patients with a Moderately impacted quality of life, and near than one quarter (22%) was the prevalence of patients with a normal quality of life; few of them (14%) were the percentage of patients with a significantly impacted quality of life.
Class 3 demonstrates the patients according to BMI, the percentage of each ordinal data of the quality of life variable. More than half (60%) was found to be the percentage of patients with a Significantly impacted quality of life, and near to one quarter (20%) was the prevalence of patients with both a normal quality of life, and a moderately impacted quality of life.
These figures supports that the higher the BMI, the higher the chance on impairment of wellbeing, or quality of life being impacted (Figure 5). Psychological state, limited functionality, co-morbidities all contribute to compromising one’s quality of life.
This would make sense considering the progression of co-morbidities with BMI shifts. Additional to that was the relevance of the greater tendency towards the mental health status beyond the physiological situation. Mental health and negative thought processes contribute to co-morbidity and mortality rates, therefore impact quality of life.
This research’s results, compared to the Edmonton study had similarities and differences. There was a wide difference in the percentage of patients with no comorbidities. In the sample 22.5% had no comorbidities and only 1.7% of the Edmonton sample.
This is due to the differences in centers included in studies. The samples were derived from health centers with several cases, including those with no medical conditions. On the other hand, the Edmonton sample was derived from a referral based weight management clinic, meaning that their samples already have an existing medical case in which they were referred to lose weight.
The EOSS distribution across the 3 classes of BMI, the results were radical. The distribution of stage 3 EOSS (significant stage), had went from 13% to 22% to 60%. This proves the linear relationship between EOSS and BMI. When the co-morbidity variable of the EOSS had been used alongside the 3 classes of BMI, there was a more detailed result. The result stated that, the percentage of significant co-morbidities across the 80 sample base had dramatically increased from 9% to 14% to 50%. This shows that the highest risk of having significant comorbidities was between end of class 2 and beginning of class 3.
The psychological variable of the EOSS has been used as well across the 3 BMI classes. The results of abnormality increased in a very high rate in class 3, from 35% to 36% to 70%. This proves that an increase in BMI increases the susceptibility of having mental disorders such as depression and anxiety, and shows to what extent, because if only one percent rise from class 1 and 2 that means that the highest risk to drop up is the end of class 2 and entering class 3. The functional limitation variable of the EOSS has been studied across the BMI to determine the correlation. The results were not as consistent as the other variables but the strengths diminished from 18% to 7% to 0%. The results of the weakness were not linear, but that could be due to the differences in work nature of the samples, which could increase or diminish the functional abilities.
Obesity is associated with a worse health-related quality of life (HRQOL) [15]. In this study, the quality of life variable of the EOSS across the BMI classes had proved that there was a linear relationship between the increase of BMI class and an impacted quality of life.
The study limitations are the lack of a statistical analysis; moreover the sample size was small for the reason that the country was in revolution crises.
This study was a cross-sectional study conducted at health centers at Khartoum locality during November 2018-January 2019; aimed to predict mortality among a young female Sudanese population enrolled in health centers. Main tool utilized is the Edmonton’s obesity staging system (EOSS). The prevalence of EOSS stages with no risk factors or co-morbidities, mild conditions, moderate conditions, and significant conditions were 22.5%, 12.5%, 45.0%, and 20.0%, respectively. The EOSS stages 2 and 3 become exponentially more apparent with increase of BMI class. Evidentially shows the percent of increased risk, and severity. There was a linear correlation between the co-morbidities and the increase in BMI ratio. Evidently as the significant co- morbidities percentage increase along the three classes of BMI (9% to 14% to 50%). This shows that the highest risk of having significant comorbidities was between end of class 2 and beginning of class 3. The psychological parameter was of high relevance with the increase of BMI, evidently linear in nature. The paper sets out that there is a linear relationship between BMI and EOSS, which could work to the benefit of determining the extent of obesity and appropriate treatment. In effect of utilizing BMI ratio to determine classes of obesity, one does not necessarily have an indication of the prevailing circumstances and consequent treatment.

![]()

Stage |
Frequency |
Percentage |
0 = no risk factors or |
18 |
22.5 |
1= mild conditions |
10 |
12.5 |
2= moderate |
36 |
45.0 |
3= significant |
16 |
20.0 |
Total |
80 |
100 |
Table 1: The EOSS Distribution across the Obese Samples (N=80)
BMI Classification |
Frequency |
Percentage |
Low risk (Class 1) |
56 |
70 |
Moderate risk (Class 2) |
14 |
17.5 |
High risk (Class 3) |
10 |
12.5 |
|
80 |
100 |
Table 2: The BMI classes frequency across the Obese Samples (N=80)
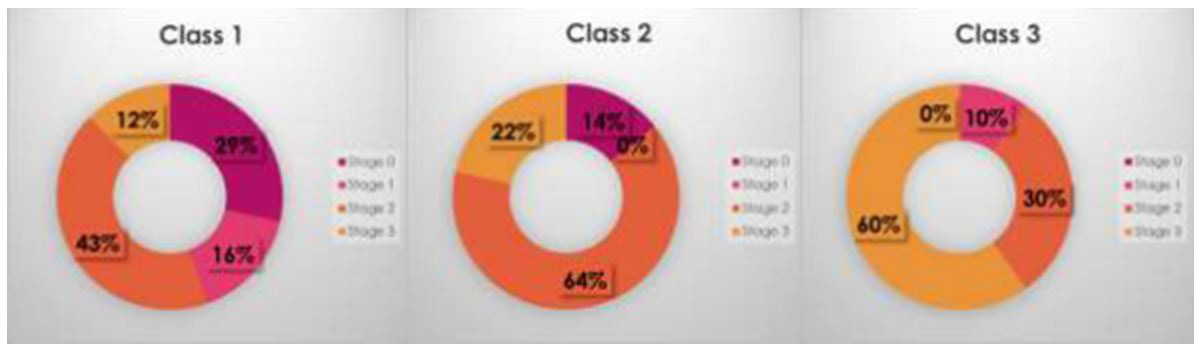 |
Figure 1: The stages distribution of the Edmonton Obesity Staging System across the three |
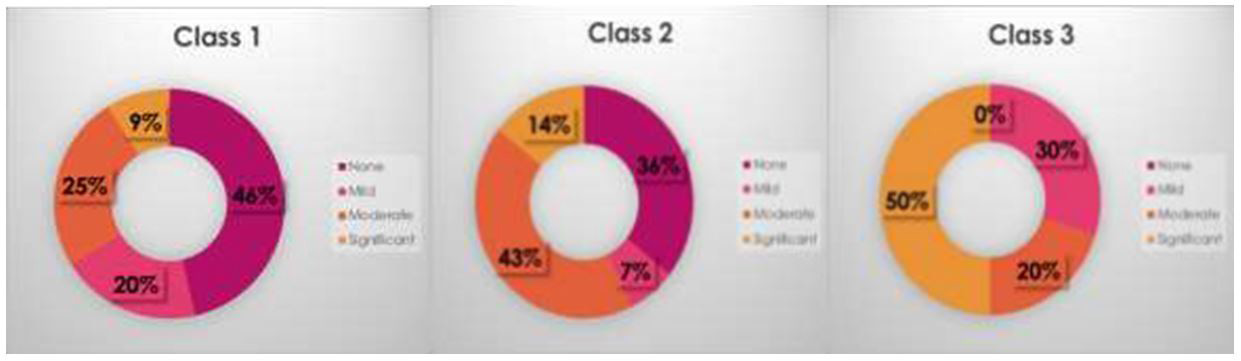 |
Figure 2: The correlation between the co- morbidity ordinal qualitative data and the BMI Classes |
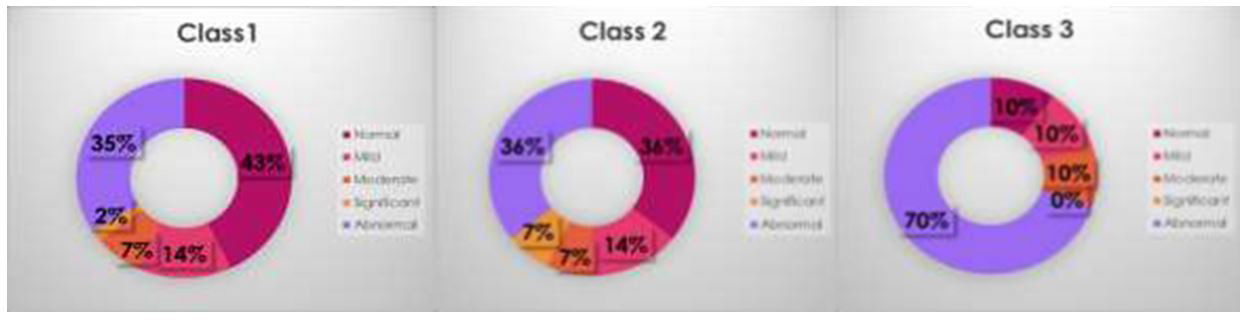 |
Figure 3: Distribution of respondents according to the correlation between the psychological ordinal data and the BMI Classes |
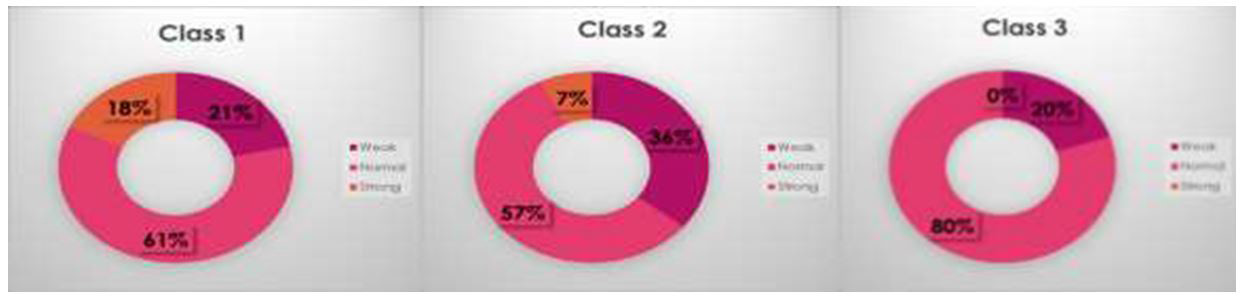 |
Figure 4: Distribution of respondents according to the correlation between the functional limitations and the BMI Classes |
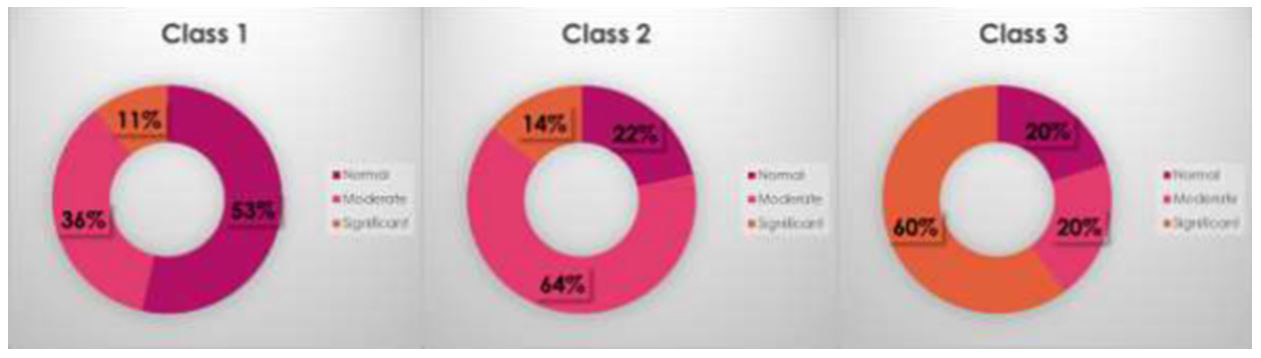 |
Figure 5: Distribution of respondents according to the correlation between the quality of life ordinal data and the BMI Classes |


