Open Access
Research Article
Max Screen >>
ISSN: 2393-9060
Copyright: © 2018 Agyemang P. This is an open-access article distributed under the terms of the Creative Commons Attribution License, which permits unrestricted use, distribution, and reproduction in any medium, provided the original author and source are credited.
Related article at Pubmed, Google Scholar
Background: Little information exists about the nutritional quality of foods distributed at pantries. Therefore, studies are needed to assess the quality of foods offered by pantries to those lacking consistent access to adequate food.
Objectives: To evaluate the quality of inventory at Food Pantry, Milwaukee as it compares to nutrient recommendations outlined in the USDA Dietary Guidelines for Americans 2010.
Results: 372 unique labeled food items and over 100,000 servings of food were surveyed. 92% of the total inventory volume was packaged and 8% were fresh/frozen foods. 11% of the inventory ranked as high nutrient-density.
Conclusion: There is great diversity of food and nutrient quality that exists at food pantries. Variability in inventory content and pantry staffing availability pose challenges for assessing quality of foods.
Implications: Food pantries help alleviates the burden of food insecurity for millions of Americans. Nutritious diets are essential for health maintenance and disease prevention. Both quantity and quality of food should be key considerations for pantry donors and stakeholders.
Keywords:Food Insecurity; Nutrient Rich Diet; Food Pantry; Dietary Guidelines for Americans
Hunger in the United States is a real and constant struggle. In 2014, 48 million Americans including 32.8 million adults and 15.3 million children lived in food insecure households [1]. In the last decade there has been an increase in the number of US households requiring food assistance. Fourteen percent of US households are presently food insecure meaning they are unable to consistently access adequate amounts of food needed for an active, healthy life for all household members [1,2]. Furthermore, since 2013-2014, there has been no significant reduction in food insecurity in American households [1,2].
Although food insecurity has remained relatively stable, obesity and lifestyle-related diseases continue to rise nationwide. According to data from the Centers of Disease Control (CDC), one third of US adults and 1 in 6 children and adolescents are obese. In a nationally representative sample of youth aged 12-18, household food insecurity was associated with increased overweight and having central obesity [3]. It is also concerning that obesity-related diseases such as heart disease, stroke, type 2 diabetes, and certain types of cancer are growing as leading causes of preventable death in the US [4]. Studies have found an association between food insecurity and markers of metabolic syndrome, self-reported hypertension, hyperlipidemia, and other cardiovascular risk factors [3,5,6]. These findings and the rising obesity epidemic highlight the importance of healthy diet to maintain weight and prevent disease.
Food insecurity has also been shown to be inversely associated with diet quality. In a study examining differences in reported intake and diet quality, low-income food insecure adults in the NHANES reported a significantly higher consumption of high fat dairy products and high sodium snacks as compared to low-income food secure adults [7]. Adults with food insecurity were also found to have other characteristics of nutrient poor diet including low vegetable intake and increased consumption of sugar-sweetened beverages. In 2010, Seligman et al. described the cyclic nature of food security and the collaborative role of food insecurity and stress on chronic disease [8]. Those who struggle with persistent stress of hunger and food insecurity are more likely to consume unhealthy calorie-dense meals because they are typically more affordable and satiating. Poor nutrition is associated with malnutrition, central nervous system effects and can suppress the immune system [9-11]. Therefore, not only is it important that resources address food security, but the quality of the foods should also be considered.
Millions of Americans with food insecure rely on charitable and federal food assistance programs, food banks, and food pantries to meet their daily nutritional needs. Such efforts strive to lessen the burden of hunger and insecurity, however, there are individual and community factors that serve to perpetuate or alleviate food insecurity [12-14]. Some pantries have reflected on the nutritional quality of the foods they offer and others have implemented policies that help improve the quality of pantry foods [2,15-17]. However, barriers to facilitate large-scale changes include being limited by funds, fear of reduced distributions, or potential tensions, as well as insufficient staff capacities [15]. For a majority of food pantries in the US, quantity and not quality of food remains the top priority. Diet quality of food from food pantry users is inadequate and further studies are needed to assess the impact of food pantries on individual diet quality in the long term [18].
Limited information exists regarding the diet quality of subsets of pantry users [7,18,19]. Little is known about the nutritional quality of foods distributed at thousands of food pantries across the country. This is likely due to variability of food products available and high turnover of inventory as foods are cyclically acquired and distributed to pantry users. Food insecurity is a major stressor for many urban families but can be especially difficult for those living in poverty. Data from Wisconsin Poverty Report suggests that Milwaukee County has the highest rate of poverty in the state [20]. In this study, we developed a nutrition profiling protocol to evaluate the food inventory at Riverwest Food Pantry-an inner-city Milwaukee food pantry. Our goal was to describe and analyze the nutritional quality of sampled inventory at the pantry as it compares to nutrient recommendations in the Dietary Guidelines for Americans (DGA) 2010. We worked closely with leadership and volunteers at the pantry, as part of an ongoing effort to revitalize the pantry’s food philosophy and development of a nutrition policy.
The United States Department of Agriculture’s (USDA) releases science-based recommendations in the Dietary Guidelines for Americans every 5 years. The DGA endorse improved health behaviors through physical activity and diet, while emphasizing caloric balance and consumption of consuming nutrient-dense foods and beverages [21]. The algorithm used to evaluate the nutritional quality of inventory at Riverwest Food Pantry was based on principles derived from the Nutrient-Rich Food (NRF) indices. The NRF index is based on recommendations from the USDA 2005 DGA and has been validated against the USDA’s Healthy Eating index (HEI) with a relation of p <0.001 [22,23]. This food nutritional quality index was developed to profile individual foods based on their nutrient composition. Like the DGA 2010, the 2005 guidelines specify ‘nutrients of concern’ in the American diet. The NFR9.3 index algorithm calculated a score for each food item based on the sum of percent daily (%DV) of the 9 nutrients to encourage minus %DV of the 3 nutrients to limit [22,23].
Our study algorithm was based on recommendations from the 2010 DGA and nutrient density scores were calculated based on the sum of %DV per 2000 calorie diet for 3 nutrients to encourage minus the %DV for the 4 nutrients to limit. The nutrients of interest for this study included three nutrients to encourage (calcium, dietary fiber, protein) and four nutrients to limit (sodium, added sugar, Tran’s fats, saturated fats). The 2010 guidelines identified potassium, dietary fiber, calcium, and Vitamin D as “nutrients of concern” in the typical American diet. Potassium and Vitamin D were not included as nutrients of interest given that these nutrients are not typically provided on food labels. Our study included FDA-recognized names for added sugars. Nutrition facts labels currently do not differentiate between total sugar versus added sugar for a given product, however the Food and Drug Administration (FDA) has proposed updating nutrition facts labels to distinguish between the two [24]. In our study pantry items that contained any of the FDA-recognized sugars within the first three listed ingredients received a set value within the algorithm, while a separate value was given to items with added sugar listed as fourth ingredient or subsequently [25].
The program for the nutritional analysis was initially developed and tested in excel-based interface to mirror the format of inventory records at the pantry and a website version was utilized for the final data collection. Nutrient information was entered in the metrics designated on the food label (grams, milligrams, or percent). The program algorithm converts all metrics into grams per serving per 2000 calorie diet, and automatically calculates a nutrient density score and assigns a ranking. A color ranking system of Green, Yellow, and Red was assigned to each unique item based on its calculated score [16]. The score represents the nutrient density in one serving of the given item and each rank color encompasses a range of scores. Higher scores were ranked Green indicating that the item contains greater than or equal to 25% DV of the 3 nutrients to encourage and less than 25% DV of the 4 nutrients to limit. In addition, all non-labeled whole foods including fresh or frozen fruits and vegetables, meats, and poultry were assigned a rank of Green. According to the FDA, one requirement for labeling a single item food as “healthy” is that it provides at least 10% of one or more of: vitamin A and C, iron, calcium, protein, and fiber [26]. With this in mind, our algorithm ranks an item as Red it contains less than or equal to 10% DV of the 3 nutrients to encourage and more than 10% DV of the 4 nutrients to limit. Items with nutrient density scores between the Green and Red range were ranked Yellow.
The entire food inventory at the St. Casimir’s site of Riverwest Pantry was assessed as a “snap shot” on 2 consecutive days prior to when the pantry distributes foods. Select pantry items were inventoried with emphasis placed on items that are consistently present or present in high volume. Prior to data collection, pantry staff conducted a preliminary count of unique items and these counts were later merged into the database to establish the volume of inventory present. On day one volunteers entered data labeled pantry stock items into the website database and entered data on perishable foods on day 2. Non-labeled items such as animal products, fruits and vegetables were recorded separately. To reduce redundancy and errors in data entry, the program had strict settings per data point. Volunteers received a brief orientation about the study, how to identify nutrients of interest on food labels, and how to use the web database. The principal investigator and members of pantry leadership provided support and direct supervision of the entire process. This project was deemed exempt by the Medical College of Wisconsin Institutional Review Board (IRB) review, and did not include any human subjects.
Inventory items were separated into 8 main categories decided upon by the project team. Categories were chosen based on the MyPlate 5 food groups. Other groupings were created to cluster products of similar content that were otherwise not represented by the 5 food groups. No biostatical analysis was performed on the data set given no current parameters/ guidelines to indicate what warrants significant nutrient density. Table 1 describes the food group subdivisions within the categories. The subdivision of ‘Cereals’ included hot and cold cereals. ‘Other Starches’ included pasta, rice sides, ramen, mashed potatoes, and other highly processed starches. The Fruit category encompassed dried, canned, fresh, frozen, and 100% pure fruit juices (not concentrate). Tomato products such as pasta sauces were classified in the Vegetable category. Cooking/Baking subdivision included items such as coffee, oil, seasoning, flour, condensed milk, and raw ingredients. ‘Sweets & other’ consisted of candies, baked sweets, chips, snacks, and junk foods.
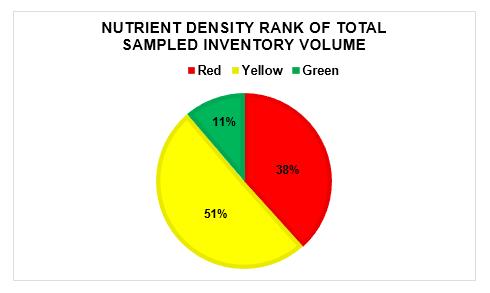
Three hundred seventy-two unique labeled food items were entered into the database. Our inventory sampling contained a total of 102,933.5 servings of food. Of this total volume of servings, 91.6 % were labeled items and 8.4 % were fresh/frozen non-labeled items. Figure 1 displays the ranking of the total sampled inventory volume based on nutrient density scores. Approximately half of the total inventory volume ranked Yellow for nutrient density and 11% ranked Green. Of the foods ranked Green, 2794 servings were packaged foods and 8685 servings were non-labeled foods.
In our analysis of the Riverwest Food Pantry food inventory we differentiated between items with nutrient facts labels and those without labels (non-labeled foods). Of the 372 labeled items inventoried, 209 items ranked Red, 134 ranked Yellow, and 29 ranked Green. Labeled pantry foods accounted for 92% of the total volume of the sampled inventory. Only three percent of the total labeled inventory volume ranked Green for nutrient density, and the remaining inventory ranked Yellow (55%) and Red (42%).
The non-labeled inventory were all whole foods and therefore received a nutrient density rank of Green. These foods made up 8% of the total inventory volume and included fresh/frozen fruits and vegetables, beef, pork, and poultry. Half of the non-labeled inventory volume was fresh fruits and vegetables. Animal products accounted for 55% of the total non-labeled inventory volume, and 42% were vegetables and 3% fruits. A majority (86%) of the non-labeled animal products were chicken, with beef cuts making up 8%.
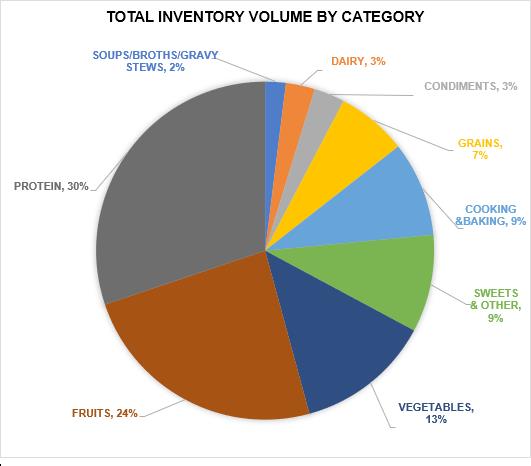
Pantry foods were classified into various categories and subdivisions (Table 1). Figure 2 displays total inventory volume by Category. The graph includes the total servings of both labeled and non-labeled inventory. The categories least represented in the pantry inventory include dairy; condiments; and soups, broth, gravy & stews. At the time of the study, the pantry content of Proteins was the highest (30%) compared to other categories. Collectively, the Fruits and Vegetables categories (packaged, fresh/frozen) accounted for 37% of the total inventory volume. Dairy was three percent of the pantry inventory volume.
There is a seemingly paucity of literature that describes the kinds of foods distributed at food pantries across the country. Most of the existing literature study pantry clients or interventions that have been implemented at food pantries [1,16,17, 27,28]. To the best of our knowledge, this study is one of the first to characterize and assess the quality of a large volume of food distributed to pantry-users. In addition, the community-academic partnership represents the needs and the interests of the local setting. The results showed that much of the sampled inventory ranked Yellow for nutrient density, which indicates that one serving of a given food contained about 10-25% DV of the 4 nutrients to limit and less 10-25% DV of the 3 nutrients to encourage. Items with low nutrient density scores ranked Red, however, this does not necessarily signify that a given Red item cannot be incorporated in moderation into a healthy balanced diet. Rather it means that one serving of a Red food is not rich in the target nutrients to encourage or is excessively rich in the nutrients to limit. Nutrient density data are best utilized relatively to compare like-items within the same subdivision or category- such as comparing two different kinds of tomato soups.
In a systematic review of 35 publications about the role of food banks to address food insecurity, the authors concluded that although food banks play an essential role in the provision of emergency food, many are limited in the provision of sufficient amounts of nutrient-dense foods [29]. They also wrote that providers of emergency foods (i.e. food banks) are restricted in their ability to offer adequate quantities of dairy, vegetables, and fruits. This finding is consistent with our study results which showed that collectively fresh fruits and vegetables accounted for only 6% of the total sampled pantry inventory volume.
Packaged foods are generally highly processed. Thus, it is not surprising that only a small volume (3%) of the total labeled inventory was found to be nutrient rich/ranked green. On the other hand, about half of the fresh/frozen foods were fruits and vegetables. A CDC report from 2013 noted that adults in Wisconsin have a slightly greater average intake of vegetables versus average intake of fruits [30]. The DGA 2010 and DGA 2015 suggest that Americans increase their consumption of fruits and vegetables, and our results showed that about a third of the total sampled inventory volume at this pantry was fruits and vegetables. Overall, proteins accounted for approximately a third of pantry inventory volume which is encouraging given the DGA recommends increasing intake of lean proteins [15,31].
The nutrient parameters used to evaluate food quality were selected based on current science-based dietary recommendations from Dietary Guidelines for Americans 2010. New Guidelines for 2015 were released after the development and implementation of the study. The nutrients of interest in this study were also identified as under-consumed in the 2015 DGA and calcium, potassium, dietary fiber, and vitamin D were highlighted as nutrients of public health concern. Like previous editions, the current guidelines encourage Americans to pursue a lifestyle that promotes healthy eating and drinking patterns that include a diversity of nutrient dense foods [31,32]. Although this study was based on the 2010 DGA recommendations, our endpoints and overall assessment captured the content of nutrients that are relevant to addressing the public health nutrition concerns outlined in the DGA 2015. Finally, multiple factors influence food pantry operations and the results of this study may not be generalizable to all US food pantries. However, the experience of the team indicates that Riverwest food pantry operates similarly to other food pantries in Milwaukee, and may share characteristics with others across the country.
This study is an example of a community-engaged research approach to assessing the nutritional quality of foods at an urban food pantry. We have created a reproducible and sustainable system to evaluate nutrient quality of food items, particularly those with nutrition fact labels. The findings highlight the diversity and variability of products that are available at food pantries and distributed to those in need. It is important to note that though this project was developed out of a community-academic partnership, Riverwest food pantry retained co-ownership of the tool which makes this evaluation sustainable. The information learned from this study is currently being used to inform educational initiatives to improve food and nutrition literacy for pantry users and staff. Nutrient density scores will assist in comparing similar items and aid pantry leadership in identifying nutrient dense alternatives to request as donations and purchases. Furthermore, this study illustrates the importance and value of food labels. Nutrient Fact labels are a powerful tool that can be used to help all Americans including pantry-users learn more about the foods we eat and make more informed food decisions that move us toward better adherence with dietary recommendations [24,32].
There is a great need for hunger relief agencies to evaluate their current food inventories to better understand their impact and identify areas for growth. Rather than placing the onus on clients to make healthy choices, pantries need to take a public health approach by making “the healthy choice the easy choice” and making changes to the types and kinds of food offered. Finally, food pantries and food banks need to both connect to community and national food purveyors to advocate for nutrient dense foods for those with the greatest need and for where health disparities continue to exist. Continued studies are instrumental to further explore food insecurity and food assistance participation as mediators of health outcomes, especially as it relates to lifestyle-related conditions including obesity, diabetes, and hypertension.
The team would like to acknowledge the efforts of Jessica De Santis of the Medical College of Wisconsin, Community Engagement Core for her editorial support of this project.

![]()

 |
| Figure 1:Flow diagram of volunteers |
 |
| Figure 2: Total Inventory Volume by Category |
CATEGORIES |
SUBDIVISIONS |
||||||||||||
Grains |
Pasta Rice Bread Cereals |
||||||||||||
Soups, Broths, Gravy, & Stews |
|
||||||||||||
Protein |
Peanut Butter/ Nut Butters |
||||||||||||
Dairy |
Milk Cheese Yogurt |
||||||||||||
Fruits |
|
||||||||||||
Vegetables |
|
||||||||||||
Cooking & Baking |
|
||||||||||||
Sweets & Others |
|
||||||||||||
Condiments |
|
||||||||||||
Table 1: Categories and subdivisions for pantry inventory |
|||||||||||||


