Open Access
Research Article
Max Screen >>
ISSN: 2393-9060
Copyright: © 2018 Tseng AA. This is an open-access article distributed under the terms of the Creative Commons Attribution License, which permits unrestricted use, distribution, and reproduction in any medium, provided the original author and source are credited.
Related article at Pubmed, Google Scholar
RepublicCorrelation formulas are developed to estimate the dietary and total greenhouse gas emissions (GHGEs) from Group of Twenty (G20) and the world in 2014 and 2017 using personal meat consumption as the required input. Among the 43 states involved in G20, the 28 states of the European Union (EU28) are considered as a whole. Based on 47,381 dietary survey samples, a formula is developed to establish the relationship between the meat consumption and GHGEs from human dietary and total activities. The present study finds that, in 2014, the daily dietary GHGE per capita of G20 members varies widely from India’s 4.122 kgCO2e to Australia’s 8.876 kgCO2e while the contribution of the dietary to the total GHGE changes from Canada’s 11.8% to India’s 60.8%, where the world average is 33.1%. Also, from 2014 to 2017, the annual growth rate of the total GHGE varies from 0.016% in Japan to 3.279% in Saudi Arabia. All results attest that there are big rooms for the huge dietary and total emitters to improve their efforts in reducing GHGEs.
Keywords:Greenhouse Gas Emission; Group of Twenty; Dietary Behavior; Meat Consumption; World
Recently, relying on computer models and large scientific data, Hawken has led a team to analyze 80 potential solutions that can substantially decrease the atmospheric greenhouse gases (GHGs) [1]. Based on the amount of GHGs that can potentially be avoided or removed from the atmosphere, Hawken’s team ranks the solution of Plant-rich Diet to be No.4 and can have 66.11gigaton (Gt) reduction of carbon dioxide equivalent (CO2e) over a thirty-year period from 2020 to 2050. The ranking is global and comparing to a reference condition where a world has very little changes and the solution of Plant-rich Diet is based on that 50% of world’s population reduces their meat consumption overall with a diet limited to a healthy 2500 calories per day. The solution can annually reduce 2.20 GtCO2e of greenhouse gas emissions (GHGEs), which certainly is a huge number since the total global GHGE in 2014 is 48.9 GtCO2e as reported by World Resources Institute (WRI) [2]. Here, CO2e is a measure of the equivalent amount (in kg, Mt, or Gt) of CO2 for a given mixture of GHGs for an equal effect on global warming. The food system is a major contributor to global GHGEs, which are produced at all stages in the system [3]. In 2006, Tukker and Jansen reported that GHGEs from food consumption accounted for approximately 31% of total GHGEs in the EU-25 [4]. Also, according to Garnett, the GHGE associated with the food system rises to up to 30% when additional emissions from fuel use, fertilizer production, and agriculturally induced land use change are included [5]. Furthermore, Fiala assessed that the emission from meat production is accounting for between 15% and 24% of the total GHGEs [6]. As estimated by Friel, et al. 80% of agricultural emissions arise from the meat production sector [7]. Thus, based on the Fiala’s estimation, the GHGEs from food consumption, including meat and plane-based, contribute between 18.75 and 30.0 % of total GHGEs. Furthermore, Li, et al. studied the food chain systems in China, beginning with agricultural production and ending with consumption and waste disposal [8]. They projected that, based on existing trends, the GHGEs increases from 1.585 GtCO2e in 2010 to 2.505 GtCO2e in 2050, which represents a 58% increase within 40 years. However, although the GHGE can grow with rising food demand, the growth can be counterbalanced by eating more plant-based food. This can cause the GHGEs to fall to 1.118 GtCO2e by 2050, a 30% reduction compared with the level in 2010. Despite being one of the major causes of anthropogenic GHGEs, the GHGEs data from food consumption or dietary GHGEs seldom get attention and are rarely reported promptly by government agencies, although the dietary GHGE data is essential in managing the total GHGEs and in reducing dietary GHGEs. Consequently, the purpose of this article is to develop correlation formulas to estimate the dietary GHGEs and total GHGEs using meat consumption as the major input data. The formula reliability is demonstrated by comparing formula predictions with published data using other approaches. The dietary GHGE and its contribution to the total GHGE from Group of Twenty (G20) and the world are also studied to illustrate the simplicity and versatility of the formula developed.
In addition, the global dietary and total GHGEs would be evaluated to serve as the benchmark for the comparison with that of G20 members. The correlation formula is further enhanced to predict the global dietary and total GHGEs from 2017 to 2025 by assuming that the global dietary or human behavior follows the current trend without major changes as those recommended by Hawken [1]. Noteworthy that meat consumption is related to socioeconomic conditions, including living standards, diet, livestock production, and consumer prices and the meat production has significant environmental and economic consequences for the earth [9]. Meat is also a major commodity and meat consumption data are currently provided by Organisation for Economic Co-operation and Development and are used in the present study [10]. As a result, to use the meat consumption as a major parameter to correlate GHGEs should be reasonable and convenient.
As posted in WRI’s website, Friedrich et al. indicated that the top three GHG emitters: China, the European Union (EU), and the United States (USA), contribute more than half of the total global emissions, while the bottom 100 countries only account for 3.5 percent and the world can’t successfully tackle the climate change challenge without significant action from these countries [11]. The membership of the G20 consists of 19 individual countries plus the EU, where the EU is a political and economic union of 28 states [12,13]. Since France, Germany, Italy, and United Kingdom (UK), are members of both G20 and EU. Collectively, G20 members involve 15 states and the 28 states of EU28. The 15 states are Argentina, Australia, Brazil, Canada, China, India, Indonesia, Japan, South Korea, Mexico, Russia, Saudi Arabia, South Africa, Turkey, USA, where the 28 states of EU are considered as a single entity, i.e., EU28, in the present evaluation as shown in the first column in Tables 2 and 3. Clearly, the top three GHG emitters: China, EU28, and USA, are indeed included and considered in the present analysis. Furthermore, the states involved in G20 account for approximately 85% of the gross world product, about 80% of world trade, and near two-thirds of the world population; thus G20 members are not only the major GHG emitters but also the major economies. The most updated GHGE data for G20 members are available for the year of 2014. Thus, in the present analysis, the total dietary GHGE (GHGEtd) in 2014 is first evaluated. The ratio of GHGEtd to GHGEt in 2014 and GHGEtd in 2017 are then calculated. Both the data of the ratio in 2014 and GHGEtd in 2017 are then used to estimate the total GHGEs in 2017 using the formula developed in the present article. The formula is also adopted to predict the global dietary and total GHGEs from 2017 to 2025. Understanding the amount of dietary and total GHGEs from the major emitters is essential in developing an effective strategy for reducing the GHGEs in order to mitigate the global warming challenges. Furthermore, the world is projected to hold 9.6 billion people by 2050, a 27%-increase from 2017 [14]. Sustainably feeding this exploding population and simultaneous reduction of total GHGE become the great challenge to government decision makers since strategies must be developed to sustainably increase food production and to concurrently reduce agriculture’s impact on climate, ecosystems, land, and water. This needs to ensure that agriculture supports inclusive economic and social development. Since the annual total GHGE data from OECD are usually three to four years behind, the present formula developed can estimate the current updated GHGEs (three to four years earlier), which should be critical to the decision makers [10].
Based on a 47,381-participant survey, the dietary GHGE data reported by Scarborough et al. are analyzed in this section [15]. A set of correlation formulas is then developed to quantify the dietary and total GHGEs. The survey data are managed into five dietary groups: vegan (2,041 samples), vegetarian (15,751 samples), low-in-meat eater (9,332 samples), medium-in-meat eater (11,971 samples) and high-in-meat eater (8,286 samples). The low-in-meat eaters consume meat less than 50 g daily while the high-in-meat eaters consume meat more than 100 g/day. Both vegans and vegetarians eat no meat. Although vegans avoid all animal products, vegetarians can consume dairy products and eggs.
The dietary data for the five groups considered are summarized in Table 1 in the 2nd and 3rd columns for the daily meat consumption per capita (MCd) and the daily dietary GHGE per capita (GHGEdd) respectively. Here, the sampling interval (SI) is controlled with the statistical significance at the 5% level while the confidence interval (CI) is in 95%. As indicated in Table 1 three places are marked with “?” because more data are needed in these places for the correlation analysis to be performed; these are not provided by the source article of Scarborough et al. [15]. Firstly, the upper bound of the sampling interval (SI) for the high-in-meat eaters is not specified (? mark in the 2nd row of 2nd column). Secondly and thirdly, we cannot have two GHGE values for the initial condition (IC) or at MCd=0 in a correlation analysis; as shown in Table 1 (? marks in the 5th & 6th rows of 2nd column), MCd=0 for both vegan and vegetarian groups.
To determine the appropriate values for the three additional data required, we perform two cases of correlation analyses with different assumptions. The correlation results for the two cases are then used to judge which assumption is the most appropriate for predicting GHGEdd.
In Case 1, we assume that the MCd range for the high-in-meat group is from 100 g to 150 g having an SI of 50 g, which is same as that of the medium-in-meat and low-in-meat, as indicated in the 2nd column of (Table 1). Two ICs: IC-1 and IC-2 are evaluated, where IC-1 is based on the vegan data, i.e., at MCd=0, GHGEdd=2.89 kgCO2e, while IC-2 is from the vegetarian data, at MCd=0, GHGEdd=3.81 kgCO2e.
The correlation results are shown in Figure 1, where the solid and dotted lines represent the results with IC-1 and IC-2, respectively. The correlation coefficients, R2, are also displayed in the Figure, where R2=1 means a perfect match of the two variables correlated. As shown, both correlation curves fit the data very well, since the associated R2s are all higher than 0.96. The correlation with IC-2 (dotted line, vegetarian data) is slightly better since its R2 is about 3% higher than that of the vegan data (IC-1). However, the correlation curves outside the region of MCd>125g, do not agree with each other very well, and the associated trendlines appear to diverge from each other, which implies that the assumptions made in Case 1 are not appropriate and the MCd range needs to be reconsidered with one IC. The appropriate assumptions for MCd and IC are analyzed in the next subsection.
In Case 2, the mean GHGEdd for the vegan group, i.e., 2.89 kgCO2e, is singled out as the IC (at MCd=0). Consequently, the mean GHGEdd for vegetarians, i.e., 3.81 kgCO2e, should not be the IC. To determine what is the corresponding MCd value for GHGEdd=3.81 kgCO2e for the vegetarian group, a parameter called equivalent meat consumption (MCe) is introduced. The corresponding MCe for the vegetarian group is determined by considering the GHGEdd difference between the vegetarian and the vegan group, i.e., 0.92 kgCO2e (=3.81-2.89). The 0.92 kgCO2e should be the GHGEdd due to the additional consumption of eggs and/or dairy products minus the GHGEdd due to less consumption of plant-based food. Applying the MCe parameter, it can be found that GHGEdd = 2.89 kgCO2e at MCe=0, and GHGEdd=3.81 kgCO2e at MCe=41.73 g [Figure 16]. Thus, MCe [g]=MCd [g]+41.73 g for MCd>0. Also, in Case 2, two SIs: SI-1=50g and SI-2=100g, for the high-in-meat group are selected for the analysis. The corresponding MCe range for SI-1 condition is 141.73 The correlation results for Case 2 are depicted in Figure 2, where the dotted and solid lines represent the results based on SI-1 and SI-2 conditions, respectively. As shown in the figure, both correlations fit the data points extremely well, since the corresponding correlation coefficients (R2) are higher than 0.99, almost perfect. As shown in Figure 2, the dotted-line correlation curve (based on SI-1) almost monotonically increases with MCe. In general, an increase of MCe can cause a reduction of plant food consumption based on the same amount of food-energy (calories) diets. As a result, the increase rate of GHGE should be gradually reduced to counter the reduction of plant food consumption. Thus, the linear increase of GHGEdd with MCe shown in the dotted line of Figure 2 (using SI-1 condition) does not reasonably reflect the true correlation of MCe to GHGEdd. It is believed that using the SI of 50 g (SI-1) is not large enough to cover all the sampling data for the high-in-meat group because many of the survey participants consume more meat than the range (more than MCd>150 g) considered in SI-1. Consequently, as shown in Figure 2, the growth rate of the solid-line curve (based on SI-2) is gradually decreasing as MCe increases; the solid-line curve provides a more reasonable prediction of GHGEdd for the range considered. Also, the R2 of the solid-line curve (SI-2 condition) is higher than that of the dotted-line curve (SI-1 condition), which means that Case 2 with SI-2 condition provides more accurate correlation than that of SI-1 condition. Furthermore, by reviewing the raw survey data, very few survey participants consume meat more than 200 g (MCe = 241.73g). As a result, the correlation of Case 2 with SI-2 condition should be adopted as the correlation formula to quantify the relationship between GHGEdd and MCe. The main criteria for non-inclusion were obesity, history of cardiovascular disease, hypertensive crisis and non-contact subjects.
As indicated in the analysis presented in the precedent sections, the correlation result of Case 2 with SI-2 condition shown in Figure 2 is adopted to form the formulas to quantify the dietary GHGEdd using MCd as the input. Since MCe [g] = MCd [g]+41.73 [g], the correlation formulas can be found as [16]:
for MCd>0 (meat-eater groups), To estimate dietary GHGEdd in 2014 and 2017, the corresponding meat consumption data is required. In addition to securing the meat consumption data for G20 members and the world considered, this section also presents the evaluation of the total GHGE. The input data of meat consumption in retail weight in 2014 and 2017 can be found from the data provided by OECD which were tabulated in kg of retail weight for the “Big-Four” livestock, i.e., beef/veal, pork, poultry, and sheep [10]. The total weight of the annual meat consumption (MCa) in kg/capita for the fifteen G20 states and the average of the 28 states of EU are listed in the 2nd column of Table 2 for 2014. In the present study the 28 states of EU (EU28) are considered as a whole and as a single entity; the four states in EU28, which are overlapped with those of G20 members, are included in EU28. Only 15 states of G20 plus EU28 and the world are studied. The meat consumption data reported by OECD is in kg/capita of annual consumption (MCa) and is need to be converted to daily meat consumption/capita (MCd) in g, which is required by Eq. (1a). As an example, in OECD data, the MCa of Argentina is 82.8 kg and the MCd of Argentina becomes 226.85 g, i.e., 82.8 kg x 1000/365, where there are 365 days in the year of 2014. Following the same procedure, the MCd for the other 14 states, EU28, and the world can be calculated and are listed in the 3rd column of Table 2. Using the calculated MCd as an input to Eq. (1a), the corresponding GHGEdd can be found and listed in the 4th column of Table 2.
Following the same procedure presented in the preceding subsection, the values of MCa, MCd, and GHGEdd for 2017 can be obtained for the15 states of G20 plus EU28 and the World and are listed in the 2nd, 3rd and 4th columns of Table 3, respectively. As shown in Table 2, in 2014, the personal dietary GHGE varies noticeably from 4.122 kgCO2e for an average person in India to 8.8766 kgCO2e for an average Australian in 2014. The maximum personal dietary GHGE is more than twice larger than the minimum one. In 2107 the situation is not changed much. The largest emitter in G20 members in 2017 is also more than twice larger of the smallest one; only the USA becomes the largest emitter, in which an average American emits 9.154 kgCO2e daily. This implies that there is a reasonably big room for the high emission states to develop less-emission technology for food production and for the heavy meat-eater countries to promote vegan or vegetarian diets to mitigate their dietary GHGEs. In 2014, the EU28 and global averages are 7.780 and 6.069 kgCO2e, respectively, while in 2017, the EU and global averages are 7.922 and 6.086 kgCO2e, respectively. The EU’s GHGE is 28.2% and 30.2% higher than that of the world, in 2014 and 2017, respectively. The increase rate of EU is higher than that of the world. In general, the EU28 group can be considered to have more advanced economies and food waste as compared to that of a world average state. Thus this may also imply that more advanced economics or more food-waste states can cause more dietary GHG emissions. In this section, based on the values of the personal dietary GHGEs obtained in the preceding section, the total dietary (GHGEtd) and the total GHGE (GHGEt) for G20 members and the World can be evaluated by providing additional data on population. The calculated 2014 GHGEtd are also compared with GHGEt (or GHGEwri) reported by an international organization to establish a formula to predict the future total GHGEs of the G20 members and the World in 2017and beyond. The population data for the 15 G20 States and the world in 2014 can be found from the data provided by UN Population Division and are listed in the 5th column of Table 2 [14]. Since UN population data are not available for all members of EU, the EU28 population provided by European Commission is adopted and also listed in the 5th column of Table 2 [17]. The total dietary GHGEs (GHGEtd) in 2014 for G20 members and the World are calculated by multiplying the number of GHGEdd and the associated population and are summarized in the 6th column of Table 2. As indicated in the Table, in 2014, the GHGEtd of China and India were 3529.54 and 1946.55 MtCO2e, respectively, while the sum of GHGEtd for of all G20 members are10,793.9 MtCO2e. Obviously, China and India are the two biggest dietary emitters and the two’s combined GHGEtd is more than 50% of that from the rest 41 states combined. For the sake of comparison, the total GHGE (GHGEt) for the 15 G20 States, the EU28 and the World provided by the World Resources Institute are reported in the 7th column of Table 2 [2]. There are two types of WRI data reported: Total GHGEs Excluding Land-Use Change and Forestry and Total GHGEs Including Land-Use Change and Forestry. As required by the UN Climate Change Secretariat, the GHG inventory sector should cover the emissions (or reduction) of GHGs resulting from direct human-induced land use, land-use change, and forestry activities. Thus, the data listed in Table 2 include the Land-Use Change and Forestry activities [2]. The ratio (Radt) of the total dietary of GHGE (GHGEtd) to GHGEt is evaluated and listed in the 8th column of Table 2, which vary from 0.118 for Canada to 0.608 for India. After examining the WRI data and the breakdown for the five different sectors, it could be found that although the energy sector in both Canada and India was the largest emission sector and constitutes about 70% of the total GHGE, the agriculture sector of India contributed 19.7% of its total GHGE while the agriculture sector in Canada only emitted 7.1% of its total GHGE [18]. This implies that the effectiveness or productivity of the agriculture sector can have a great impact on the dietary GHGE. It is noteworthy that the energy and agriculture sectors of the USA contributed 88.9% and 5.6% of its total GHGE in 2014. This also implies that, although to improve the efficiency of the agriculture sector is important, the largest GHGEtd reduction should come from the reduction of energy consumption in producing and processing of food. The wide variation of the Radt ratio among the G20 members implies that the food system in eachG20 member is greatly influenced by not only the dietary behavior and socioeconomic conditions of the people in each state, but also the technology used in producing and processing food [9]. Note that the Radt ratio is going to be used as a weighting function for the predictions of the total GHGE in 2017 and beyond.
To estimate the total dietary emissions of G20 members and the world in 2017, again, the associated populations in 2017 are required. Since the UN population data is updated only to 2015, the required 2017 population data are estimated by using the annual growth-rate data provided by UN and listed in the 5th column of Table 3 for the 15 G20 states and the world. As an example, Argentina’s population in 2017 shown in Table 3 is estimated to be 44.238 million, which is equal to 43.418 x (1+0. 94%)(1+0. 94%), where 43.418 and 0.94% are the population in 2015 in million and the average annual growth rate from 2015 to 2020, respectively [14]. The Eurostat does provide the population for EU28 in 2017 and its value is conveniently used and listed in Table 3 [17]. The total dietary GHGEs (GHGEtd) in 2017 can then be calculated by multiplying the population in the 5th column of Table 3 and the corresponding GHGEdd in the 4th column of Table 3. The calculated GHGEtd are summarized in the 6th column of Table 3. The total emission, GHGEt in 2017 can be extrapolated from the GHGEt in 2014 and the GHGEtd in 2017 by the following formula: (GHGEt)2017=(GHGEtd)2017(GHGEwri)2014/GHGEtd)2014=(GHGEtd)2017/(Radt)2014 (2) where the subscript outside the parentheses denotes the specific year of the data being based on; (Radt)2014is the ratio of (GHGEtd)2014 to (GHGEwri)2014. By substituting the data of (GHGEtd)2017 and (Radt)2014, which are respectively listed in the 6th column of Table 3 and the 8th column of Table 2, into Eq. (2), (GHGEt)2017 can be calculated and are depicted in the 8th column of Table 3. By comparing (GHGEt)2017 to (GHGEwri)2014 shown in the 7th column of Table 2, the annual growth rate of GHGEt (GR)14-17 from 2014 to 2017 can be found and listed in the 9th column of Table 3. The results indicate that, from 2014 to 2017, the annual growth rate of GHGEt in these G20 members are from 0.167% in Japan to 3.279% in Saudi Arabia, which attests that there is urgency for all states involved to commit truly national efforts in the reduction of GHGEs, since all states should have a negative emission growth-rate to reach the goal set by the Paris Agreement [18].
Furthermore, the world emission grows from 48.892.4 to 50686.5 GtCO2e with an annual growth rate of 1.209%, while the annual growth rates of the three biggest emitters: EU28, China, and USA are respectively 0.903%, 0.451, 1.794%, which indicates that USA’s efforts on the GHGE reduction are much worse than the world average and other biggest emitters, while the efforts committed by China, EU28 and India should be continuous and speed up their efforts to meet their final goals to have a negative growth rate. Based on the world or global emission data presented in Table 2 and Table 3, the dietary GHGEtd in 2014 and 2017 represents 33.1% of the total GHGEt. According to Garnett (2011), the GHGE associated with the food system rises to up to 30% when additional emissions from fuel use, fertilizer production, and agriculturally induced land use change are included [5]. By comparing with the 30% of the total GHGEs reported by Tukker & Jansen and Garnett, respectively, the present evaluation of 33.1% is 10% higher than that reported by Garnett [4,5]. In a study by Vermeulen et al. his results indicate that, the GHGE for food systems releases from 9.8 to 16.9 GtCO2e, which is consistent with the present estimation, which is 16.167 GtCO2e [19]. Also mentioned earlier, Fiala’s assessment on the emission from meat production can be converted to that of food production, in which the GHGEs from meat and plane-based food contribute between 18.75 and 30.0% of total GHGEs [6]. Based on the comparison presented above, the present prediction agrees with other published results within 10%, which is reasonably good, although the present evaluation is more close to the upper-bound values of the cited studies. OECD (2017) has studied the trend of the meat consumption of many different states and has predicted the global meat consumption (MCa) from 2017 to 2025 as listed in the 2nd column of Table 4 [10]. The global dietary (GHGEdd) and total (GHGEtd) GHGEs from 2017 to 2025 can be calculated from Eqs (1a) and (2), respectively, using the MCa data and the population data by UNPD (2017), which is listed in the 5th column of Table 4; the results of GHGEdd and GHGEtd are respectively presented in the 3rd and 5th columns of Table 4 [14]. As shown in Table 4, GHGEdd and GHGEtd are monotonically increasing from 6.086 kgCO2e and 16,761.1 MtCO2e in 2017 to 6.138 kgCO2e and 18.240.2 MtCO2e in 2025, respectively. Since Eqs (1) and (2) only consider the effects of changing diets and population but do not consider the technology improvement in producing the human food, it is not surprising that GHGEs are monotonically growing as the meat consumptions and population, which are monotonically increasing. If the food production technology has reasonable improvement, the future GHGEdd and GHGEtd can have reasonable reductions. Using Eq. (2) and (Radt) in the 8th column of Table 2, GHGEt from 2015 to 2025 can be estimated from the results of GHGEtd just calculated. The results are listed in the 6th columns of Table 4. Again as indicated in Table 4, the estimated results of GHGEt are monotonically increasing from 50.687 GtCO2e in 2015 to 55.153 GtCO2e in 2025. Both the GHGEtd and GHGEt increase with an average annual growth rate of 1.16%. The results of GHGEtd and GHGEt presented in this section intend to provide the current trend of GHGEs for a reference condition where a world has very little changes as indicated by Hawken (2017) [1]. If the world can commit much more efforts and resources to cope the global warming challenge by improving green-energy related technology and reducing the energy consumption, the future GHGEt can be greatly lower as estimated by Hawken (2017). Also, having a sizable change in the human dietary behavior by switching to more plant-based food can help to mitigate GHGEs. Otherwise, if the current trend continues, it would be inevitable to exceed the 2C limit imposed by the Paris Climate Agreement in a near future [1,18]. Correlation formulas are developed based on a dietary survey with 47,381 participants to estimate the greenhouse gas emissions (GHGEs) from human meat consumption and total activities for the 15 states of G20, the EU, and the world. The correlation results show that the daily dietary GHGE per capita in 2014 varies widely from 4.12 kgCO2e in India to 8.88 kgCO2e in Australia, while the global average is 6.07 kgCO2e. The maximum dietary GHGE is more than twice higher than the minimum one, which implies that there is a reasonably large room for the heavy GHG emitters to mitigate their dietary GHGEs by improving their food production technology and switching to more plant-based diets as indicated by Hawken and Li et al. [1,8]. In 2017, the total GHGE (GHGEt) among the G20 members varies from 387.9 MtCO2e in Turkey to 11,758.4 MtCO2e in China. The wide variation of the GHGEt suggests that the food system in each country considered is greatly influenced by not only the dietary behavior of the people but also its socioeconomic conditions. As a result, for the development of an effective strategy or green technology to reduce the GHGEs, the impact of the socioeconomic and technological conditions on the dietary and total GHGEs should be essential and worthwhile for further study. The ratio of dietary GHGE to the total GHGE (Radt) in 2014 is calculated. The ratio among the G20 members varies from the lowest 11.8% in Canada to 60.8% in India, while the world average is 33.1%, which is within 10% agreement with other results obtained by using different approaches. This demonstrates that the correlation formulas developed are reasonable reliable, although the present prediction can better be considered as an upper-bound estimation. The growth rates of the total GHGEs from 2014 to 2017 are estimated. The results indicate that, from 2014 to 2017, the total GHGEt changes among the G20 members are from Russia’s 0.312% to Saudi Arabia’s 3.279%. The whole world is found to emit 1.209% more GHGs, increasing from 48,892 in 2014 to 50,686 MtCO2e in 2017. These results attest that there is urgency for all states involved to commit truly national efforts in the reduction of GHGEs, since every state in the world should have a negative emission growth-rate to reach the goal set by the Paris Agreement. Furthermore, the annual growth rates of the three biggest emitters: EU28, China, and USA are respectively 0.903%, 0.451, 1.794%, which indicates that USA’s efforts on the GHGE reduction are much worse than the world average or other big emitters, while the efforts committed by EU28 and China should be continuous to improve their efforts to have a negative growth rate. The results of GHGEtd and GHGEt presented in this section intend to provide the current trend of GHGEs for a reference condition where a world has very little changes as indicated by Hawken [1. If the world can commit much more efforts and resources to cope the global warming challenge by improving green-energy related technology and reducing the energy consumption, the future GHGEt can be greatly lower as estimated by Hawken [1]. Also, having a sizable change in the human dietary behavior by switching to more plant-based food can help to mitigate GHGEs. Otherwise, if the current trend continues, it would be inevitable to exceed the 2C limit imposed by the Paris Climate Agreement in a near future [18]. As mentioned earlier, meat consumption is related to socioeconomic conditions and is characterized by high production costs and associated with higher incomes. Thus, the meat consumption should have significant economic and environmental consequences and is used to correlate GHGEs should be theoretically reasonable. Furthermore, if the current trend is persistent, the present study predicates that the global dietary and total GHGEs increase monotonically from 2017 to 2025 with an annual growth rate varying between 0.992% and 1.272%. It is believed that the new green technologies to every sector of industry have to be developed and the managing plan and technology to reduce human energy consumption have to be implemented or improved. Certainly, switching the dietary behavior to have more plant-based diets can greatly help in mitigating the GHGEs, again, as indicated by Hawken’s and Tseng’s estimation [1,16]. More dietary surveys are recommended to be conducted to provide data with more dietary groups with smaller sample interval, i.e., more than the five groups and smaller than 50-g sample interval considered; so that more accurate and reliable correlations can be developed. Mathematically, the national GHGE is a geographical and temporal variable, depending on the specific country and year considered. As suggested by the form of Eq. (2), the geographical effect is managed by the change of the ratio, Radt, while the temporal effect is handled by the changes of MCa. The current approach in developing Eq. (2) is similar to the simplest first-order forward scheme of the finite difference method, where the effects of geographical and temporal are also separately treated and each effect is taken care by a set of finite difference approximations. To improve the reliability of the correlation developed, the ratio, Radt, should be updated every few years or improved by using a non-linear extrapolation. This ratio may also need to be further improved to include time-effect predictability by compiling more data on both technological improvements and socioeconomic changes in each states considered so that the prediction can be more accurate and reliable.
The authors acknowledge the generous funding by Czech Ministry of Education, Youth and Sports under the National Sustainability Programme I (Project LO1202). This funding and an earlier funding (Project No. HEATEAM-CZ.1.07/2.3.00/20.0188) also provide the Government Endowed Chair professorship to the first author (AAT) from 2012 to 2015 at Brno University of Technology (BUT) to initiate the subject presented in this article. Correlation Formulas are developed to estimate dietary and total greenhouse-gas emissions. The dietary and total greenhouse-gas emissions of G20 and the world in 2014 and 2017 are evaluated. The formulas predicate that the global total GHGEs increase monotonically from 50,686 GtCO2e in 2017 to 55.159 GtCO2e in 2025, respectively. It has been shown that these formulas could provide benchmark information for strategy development for reducing GHGEs in order to mitigate the global warming problems.Correlation Formulas between Personal Meat Consumption and Dietary Emission
Calculation of the Body Mass Index (BMI)
GHGEdd= -2.0x10⁻⁵ (MCd +41.73)2 + 0.0264 (MCd+41.73) + 2.8664, (1a)
for MCd = 0 and MCe > 0 (vegetarian group),
GHGEdd = 3.81, (1b)
and for MCd = 0 and MCe = 0 (vegan group),
GHGEdd = 2.89, (1c)
where GHGEdd is in [kgCO2e]; MCe and MCd are in [g] of retail weight.Results and Discussion on Dietary Greenhouse Gas Emissions
Meat Consumption and Personal Dietary GHGE in 2014
Personal Dietary GHGE in 2017 and Discussion
Results and Discussion on Total Emissions in 2014 and 2017
Population and Total Dietary GHGE in 2014
Total Dietary Emissions (Ghgetd) Of G20 Members and World in 2017
Results on Total Emissions (Ghget) of G20 Members and the World in 2017
Comparison and Discussion of Present Estimation of Dietary Emissions with Other Results
Results and Discussion on Dietary and Total Emissions of the World from 2017 To 2025
Conclusion
Acknowledgments
Author Contributions

![]()

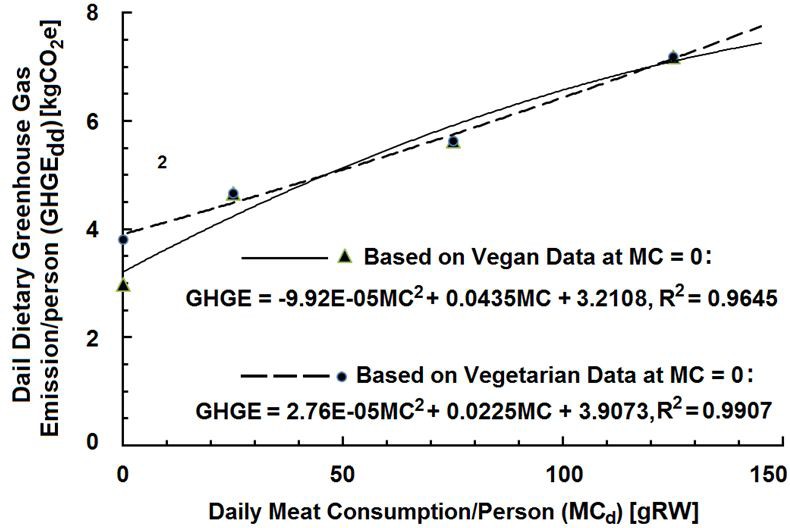 |
| Figure 1:Correlation of dietary emission with daily meat consumption (MCd) for Case 1 |
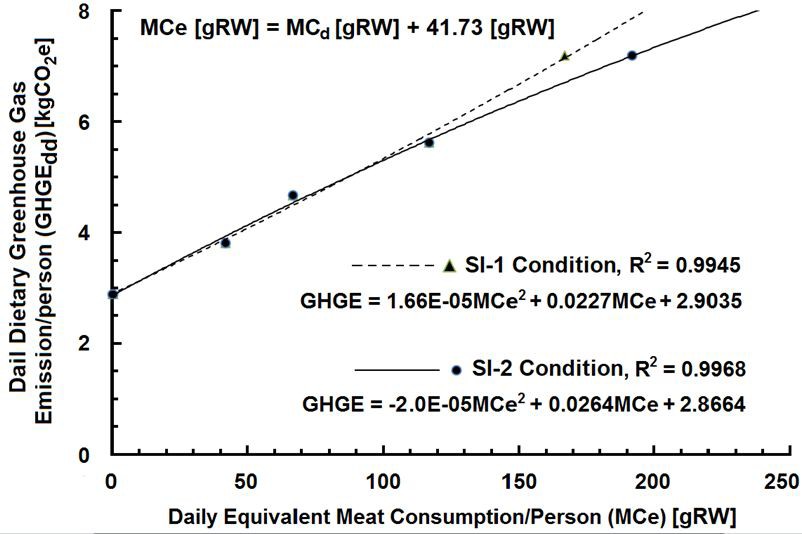 |
| Figure 2: Correlation of dietary emission with equivalent meat consumption (MCe) for Cases 2 |
Dietary group |
Original SI1 for MC 2 [g] |
Mean GHGE 3 & 95%-CI4 |
MCe5 range for Case2 with SI-2 condition |
Mean of MCe [g] |
Mean GHGEdd [kgCO2e] |
||||||||
High-in-meat |
100<MCd<? |
7.16<7.19<7.22 |
141.73<MCe<241.73 |
191.73 |
7.19 |
||||||||
Medium-in-meat |
50<MCd<100 |
5.61<5.63<5.65 |
91.73<MCe< 141.73 |
116.73 |
5.63 |
||||||||
Low-in-meat |
0<MCd<50 |
4.65<4.67<4.70 |
41.73<MC< 91.73 |
66.73 |
4.67 |
||||||||
Vegetarian |
0? |
3.79<3.81<3.83 |
41.74 |
41.73 |
3.81 |
||||||||
Vegan |
0? |
2.83<2.89<2.94 |
0 |
0 |
2.89 |
||||||||
1Sampling interval; 2Daily meat consumption in [g]; |
|||||||||||||
2014 |
MCa by OECD1 [kg] |
MCd [g] |
GHGEdd by Eq.(1) [kgCO2e] |
Population by UNPD2 [000] |
GHGEtd by Eq.(1) [MtCO2e] |
GHGEwri by WRI4 [MtCO2e] |
Radt = GH- GEtd/GHGEwri |
||||||
Argentina |
82.8 |
226.85 |
8.5142 |
42,982. |
133.574 |
443.26 |
0.301 |
||||||
Australia |
91.5 |
250.68 |
8.8760 |
23,475. |
76.0531 |
523.21 |
0.145 |
||||||
Brazil |
76.6 |
209.86 |
8.2425 |
204,213. |
614.375 |
1,357.18 |
0.453 |
||||||
Canada |
67.9 |
186.03 |
7.8417 |
35,605. |
101.910 |
867.00 |
0.118 |
||||||
China |
50.2 |
137.53 |
6.9563 |
1,390,110 |
3529.54 |
11,600.63 |
0.304 |
||||||
India |
2.80 |
7.6712 |
4.1218 |
1,293,859 |
1946.55 |
3,202.31 |
0.608 |
||||||
Indonesia |
11.2 |
30.685 |
4.6733 |
255,131. |
435.189 |
2,471.64 |
0.176 |
||||||
Japan |
35.2 |
96.438 |
6.1322 |
128,163. |
286.863 |
1,322.05 |
0.217 |
||||||
Korea, S. |
55.2 |
145.75 |
7.1130 |
50,368. |
130.767 |
631.60 |
0.207 |
||||||
Mexico |
46.1 |
126.30 |
6.7377 |
124,222. |
305.496 |
729.10 |
0.419 |
||||||
Russia |
59.4 |
162.74 |
7.4282 |
143,761. |
389.780 |
2,030.14 |
0.192 |
||||||
Sa. Arabia |
49.5 |
135.62 |
6.9193 |
30,777. |
77.7288 |
583.37 |
0.133 |
||||||
S. Africa |
47.8 |
130.96 |
6.8290 |
54,540. |
135.945 |
527.22 |
0.258 |
||||||
Turkey |
29.1 |
79.726 |
5.7778 |
77,031. |
162.451 |
366.61 |
0.443 |
||||||
USA |
91.2 |
249.86 |
8.8639 |
317,719. |
1027.93 |
6319.02 |
0.163 |
||||||
EU28 |
66.6 |
182.47 |
7.7799 |
507,0013 |
1439.71 |
3,624.82 |
0.397 |
||||||
World |
34.1 |
93.425 |
6.0691 |
7,298,453 |
16167.8 |
48,892.37 |
0.331 |
||||||
1based on [10]; 2based on [14]; 3based on [17]; 4based on [2] |
|||||||||||||
2017 |
MCa by OECD1 [kg] |
MCd [g] |
GHGEdd by Eq.(1) [kgCO2e] |
Population by UNPD2 [000] |
GHGEtd by Eq.(1) [MtCO2e] |
Radt =GHGEtd/ GHGEwri |
Predicted GHGEt [MtCO2e] |
Growth Rate, |
|||||
Argentina |
88.7 |
284.74 |
8.762 |
44,238.1 |
141.48 |
0.3013 |
469.495 |
1.935 |
|||||
Australia |
94.6 |
259.18 |
8.999 |
24,422.8 |
80.224 |
0.1454 |
551.905 |
1.796 |
|||||
Brazil |
78.6 |
215.34 |
8.331 |
209,063. |
635.75 |
0.4527 |
1404.40 |
1.147 |
|||||
Canada |
70.1 |
192.05 |
7.945 |
36,600.0 |
106.14 |
0.1175 |
902.990 |
1.365 |
|||||
China |
50.3 |
137.81 |
6.962 |
1,407,947 |
3577.5 |
0.3043 |
11758.4 |
0.451 |
|||||
India |
3.2 |
8.77 |
4.149 |
1,338,012 |
2026.0 |
0.6079 |
3333.07 |
1.343 |
|||||
Indonesia |
11.3 |
30.96 |
4.680 |
263,664. |
450.36 |
0.1761 |
2557.82 |
1.149 |
|||||
Japan |
36.4 |
99.73 |
6.201 |
127,387. |
288.31 |
0.2170 |
1328.70 |
0.167 |
|||||
Korea, S. |
55.9 |
153.15 |
7.252 |
50,958.9 |
134.88 |
0.2070 |
651.472 |
1.038 |
|||||
Mexico |
47.7 |
130.68 |
6.824 |
129,007. |
321.31 |
0.4190 |
766.836 |
1.696 |
|||||
Russia |
60.7 |
166.30 |
7.493 |
143,859. |
393.44 |
0.1920 |
2049.21 |
0.312 |
|||||
Sa. Arabia |
54.1 |
148.22 |
7.159 |
32767.6 |
85.628 |
0.1332 |
642.656 |
3.279 |
|||||
S. Africa |
50.2 |
137.53 |
6.956 |
56,625.9 |
143.78 |
0.2579 |
557.588 |
1.884 |
|||||
Turkey |
30.4 |
83.288 |
5.854 |
80,430.3 |
171.86 |
0.4431 |
387.854 |
1.895 |
|||||
USA |
98.6 |
270.14 |
9.154 |
324,488. |
1084.2 |
0.1627 |
6665.19 |
1.794 |
|||||
EU28 |
69.6 |
190.68 |
7.922 |
511,5233 |
1479.0 |
0.3972 |
3723.86 |
0.903 |
|||||
World |
34.4 |
94.25 |
6.086 |
7,544,836 |
16761.1 |
0.3307 |
50686.5 |
1.209 |
|||||
1based on [10]; 2based on [14]; 3based on [17]. |
|||||||||||||
year |
MCa by OECD1[kg] |
GHGEdd by Eq.(1) [kgCO2e] |
Population by UNPD2 [million] |
GHGEtd by Eq.(1) [MtCO2e] |
GHGEt by Eq.(2) [MtCO2e] |
Annual GHGEt growth rate |
|||||||
2017 |
34.4 |
6.086 |
7515.284 |
16,761.1 |
50,686.5 |
1.203% |
|||||||
2018 |
34.6 |
6.098 |
7597.176 |
16,909.2 |
51,134.4 |
1.272% |
|||||||
2019 |
34.8 |
6.109 |
7678.175 |
17,121.6 |
51,776.7 |
1.248% |
|||||||
2020 |
34.8 |
6.109 |
7758.157 |
17,300.0 |
52,316.1 |
1.042% |
|||||||
2021 |
34.9 |
6.115 |
7837.029 |
17,492.2 |
52,897.5 |
1.107% |
|||||||
2022 |
34.9 |
6.115 |
7914.764 |
17,665.7 |
53,422.2 |
0.992% |
|||||||
2023 |
35.1 |
6.127 |
7991.397 |
17,870.2 |
54,040.4 |
1.149% |
|||||||
2024 |
35.2 |
6.132 |
8067.008 |
18,056.1 |
54,602.7 |
1.036% |
|||||||
2025 |
35.3 |
6.138 |
8141.661 |
18,240.2 |
55,159.3 |
1.016% |
|||||||
1based on [10]; 2based on [14]. |
|||||||||||||


