Open Access
research Article
Max Screen >>
ISSN: 2393-9060
Copyright: © 2015 Möller K. This is an open-access article distributed under the terms of the Creative Commons Attribution License, which permits unrestricted use, distribution, and reproduction in any medium, provided the original author and source are credited.
Related article at Pubmed, Google Scholar
Obesity is well associated in various chronic diseases such as type 2 diabetes, hyperinsulinemia, dyslipidemia and atherosclerosis. Thus, for persons with obesity and diabetes, food with low GI are recommended in order to lower the glycemic response. The aim of this study was to examine the glycemic index (GI) and glycemic load (GL) of two formula diets, which are carbohydrate-rich (HC) or protein-rich (HP). Twenty healthy volunteers aged 25.8 ± 5.8 years (body mass index: weight/height2 =23.8 ± 2.4 kg/m2) randomly received either a reference food or amounts of the test food with equal carbohydrate content (45.9 g glucose / Portion) in three visits with at least 6 days between each intervention; resulted in a portion size of 76.2 g HC and 147.1 g HP. In order to determine plasma glucose and insulin concentrations, seven blood samples were collected (basal, 15, 30, 45, 60, 90 and 120 min after intake of the test foods). Satiety was reported on a visual analog scale during the test phase of two hours. In relation to glucose, a GI of 66.9 ± 41.8 was measured for HC formula diet and 7.1 ± 7.2 for HP formula diet. The GL of the HC serving portion was found to be 22.8 ± 14.3 and for HP 1.8 ± 1.9. This result indicates that HC can be classified as a medium GI food (55 - 69) and HP as low GI food (<55). In addition, self-reported hunger and satiety levels were more pronounced with HP compared to glucose (p<0.05). The GI and GL of the HP formula diet seemed to be more favorable and achieved good effects in view of a low glycemic response.
Keywords: Glycemic index; Glycemic load; Formula diet; High carbohydrate; High protein; Cross-over study
List of abbreviations: ANOVA: Analysis of variance; BMI: Body Mass Index; GI: Glycemic Index; GL: Glycemic Load; HC: High Carbohydrate Formula Diet; HP: High Protein Formula Diet; IAUC: Incremental Area under the Curve; VAS: Visual Analogue Scale; PFC: Prospective Food Consumption
Obesity has emerged as major global health problem. Approximately 1.9 billion adults are considered to be overweight and over 600 million were obese [1]. It has been well established that obesity is associated with commonly occurring disorders such as hypertension, type 2 diabetes, hyperinsulinemia, dyslipidemia and atherosclerosis [2]. Strategies for weight loss are considered with achieving a negative energy balance. Numerous nutritional approaches and diets with different proportion of proteins, carbohydrates and lipids, which may lead to energy restriction, are being investigated [3-5]. Formula diets as meal replacements have been accepted as useful therapeutic strategies for weight loss and weight maintenance [6].
Furthermore, it has been proposed that the glycemic response of foods, which relates to its glycemic index (GI) and glycemic load (GL), can influence weight control [7,8]. The GI is a tool that can be used to classify carbohydrate-containing foods according to the glycemic response [9]. The term GL was introduced to quantify the overall glycemic effect of food with respect to its specific carbohydrate content in typically consumed quantities [10]. Diets with a high GI and high GL are connected with the development of coronary heart diseases [11-13]. This association appears to be stronger in participants with higher Body Mass Index and possibly those with type 2 diabetes [13,14]. The high glycemic response may lead to increased appetite, overeating and increased body mass and body fat [15]. Contrary, recent studies suggested that low GI foods reduces hunger and results in a lower energy intake compared with high-glycemic index foods which finally leads to a positive weight management [16-18]. Moreover, diets with a low GI may help to control insulin secretion, postprandial glycaemia and to reduce triglycerides [19,20]. Therefore, diets with a low glycemic response are an effective opportunity for weight management and glycemic control. They represent a useful tool in the therapy of overweight and obesity [21]. The GI is defined as the incremental area under the blood glucose curve (IAUC) after consumption of 50 g available carbohydrate from a test food. GI values are expressed as a percentage to the glycemic response observed after ingestion of the same amount of carbohydrates from a reference food (glucose) taken by the same subjects on a separate occasion [9,22]. The GI of a food is depending on the rate of ingestions. A high GI is caused by carbohydrates degraded quickly during ingestions [23]. Therefore, glucose response is fast and high, whereas low GI is associated with complex carbohydrates due to their delayed and/or limited ingestions. A GI value is considered as high >70, medium (55
This study was conducted to determine the GI of two different formula diets (meal replacements) - a carbohydrate-rich and a protein-rich – and describe the postprandial glucose metabolism. Additionally, self-reported postprandial satiety was measured.
To determine the glucose and insulin effects of the formula diets, this randomized, crossover trial was conducted at the Institute of Food Sciences and Human Nutrition at Leibniz University of Hannover. Three visits were separated by 6 days wash-out phases. The study protocol was approved by the Ethical Committee of the Medical Chamber of Lower Saxony (Arztekammer Niedersachsen) on 21th November 2013. Written informed consent was obtained from all subjects according to the guidelines for Good Clinical Practice.
Healthy, non-smoking, non-diabetic men and women were enrolled. The inclusion criteria for participation were an age between 18 and 50 years and a body mass index (BMI) between 18 and 28 kg/m2. Exclusion criteria were gastrointestinal disorders, suffering from diabetes, taking medications for any chronic disease conditions, being pregnant, breastfeeding, or having intolerances or allergies to any of the foods tested. In order to minimize fluctuations in fasting blood glucose and postprandial glucose response, subjects were instructed to maintain a 12 h overnight fast after consuming a delivered standard dinner (instant pasta dish), prior to each visit [26]. Additionally, subjects were instructed to avoid alcohol or excessive exercise during the previous day.
Two different formula diets were investigated in the study. Nutritional compositions are shown in Table 1. The formula diet classified as a carbohydrate-rich formula diet (HC) contained approximately 24% protein, 49% carbohydrate, 25% fat, and 2% fiber relating to the recommended preparation. The main components were isomaltulose (65%), soy protein isolate (26%), oligofructose (6.7%) and xanthan (1.3%). The macronutrient composition of the diet classified as protein-rich formula diet (HP) was approximately 38% protein, 34% carbohydrate and 28% fat. Here, the main components soy protein isolate (33%), whey protein isolate (32%) and fructose (32%) are contained. In order to ensure the comparability, a glucose solution was used as reference food because hereby all test foods had to be drunk. Each preparation was given as portions providing 50 g of available carbohydrates. This resulted in a portion size of 45.9 g glucose, 76.2 g HC and 147.1 g HP. The powders of all test foods were dissolved in 300 ml water.
At each visit, fasting blood samples were taken to determine the baseline value (glucose and insulin); anthropometric parameters were also measured. After the first draw of fasting blood, subjects received the test foods to be investigated and the reference food in a randomized order. The subjects were instructed to consume the test foods within 5 minutes, together with 250 ml of water. Subsequent blood sample were taken 15, 30, 45, 60, 90, and 120 min after consumption. After 60 and 90 minutes, 250 ml of drinking water was consumed. Additionally, subjects filled in a visual analogue scale (VAS) questionnaire at 15, 30, 45, 60, 90, and 120 min to assess the postprandial satiety.
Anthropometric measurements were taken at each visit. BMI was calculated as weight (kg)/height2 (m²). Fasting blood samples were collected by venipuncture of an arm vein using sealed Blood Collection Tubes and System S-Monovettes® (Sarstedt, Germany). After each draw, the blood samples were immediately cooled to 4-6 °C in order to prevent breakdown of the blood glucose in the blood collection tubes. The blood samples were refrigerated and sent to external laboratories (LADR laboratory, Hannover, Germany) for the measurement of clinical parameters. The blood glucose concentration was measured in 2.4 ml of venous sodium fluoride whole blood. Measurements were performed by using the hexokinase method, an ultraviolet (UV) enzymatic (in vitro) assay (Beckman Coulter, Inc.). The insulin concentration was measured in 2.7 ml of serum and determined by immunoassays (cobas®, Roche Diagnostics, Mannheim, Germany). HbA1c was measured in EDTA whole blood using ion exchange chromatography (Bio-Rad Laboratories, Germany) which is by means of high-performance liquid chromatography (HPLC).
VAS questionnaire was based on five lines of 100 mm in length with words anchored at each end, reporting the most positive and the most negative rating of each question as described elsewhere [27]. Subjects were asked about the desire to eat, hunger, satiety, and prospective food consumption (PFC). Quantification was done by measuring the distance (mm) from the left end of the line to the mark.
GI measurement was in accordance with ISO 26642, Food Products – Determination of the glycemic index and recommendation for food classification [25]. The IAUC for blood glucose and insulin response as well as satiety values were calculated geometrically using the trapezoid rule, the area below the baseline was ignored [28]. To calculate the IAUC, the raw data of glucose and insulin concentration were used and determined for each subject as well as for the three test foods. To calculate glucose and insulin concentrations as well as satiety values at the various time points, the raw data were adjusted for baseline value. The GI for each test food was calculated as follows: GI=(IAUC test food/IAUC glucose)*100. The GL is defined as the product of the GI of a food and the amount of available carbohydrates in a serving portion. The GL was calculated as follows: GL=(GI * available carbohydrate in one serving portion size (g))/100. The final reported GI and GL was shown as mean value ± standard deviation for the test food.
Normality of variables was tested by Kolmogorov-Smirnov test. In case of normal distribution, analysis was performed by using multiple comparisons with analysis of Variance (ANOVA) and Post hoc test (Bonferroni); in case of abnormally distributed data Kruskal-Wallis-Test followed by Mann-Whitney U-Test was used. Differences were considered significant at p<0.05. Analysis was carried out using the Statistical Package for Social Sciences SPSS 21 software (SPSS Inc., Chicago, IL, USA).
Nine healthy men and eleven women (BMI 23.8 ± 2.4 kg/m2; age 25.8 ± 5.8 years) were enrolled in the study. Baseline characteristics are shown in Table 2. Parameters of glucose metabolism (fasting glucose, fasting insulin) were within the reference range for all subjects and did not provide any signs of physiological impairment. Due to the crossover study design, baseline levels were not significantly different between the treatment groups. The data of all 20 subjects were included in the glucose metabolism and GI as well as satiety evaluation.
The mean GI calculated for HC was 66.9 ± 41.8, for HP 7.1 ± 7.2 and for glucose as reference 100 ± 0 (Table 3). The mean GL value for HC was 22.8 ± 14.3 and for HP 1.8 ± 1.9. GI of the test foods were statistically significant different (p<0.001, Post hoc test) whereby GI of HC and HP were significantly lower (p<0.001, Post hoc test) than for glucose. Furthermore GI and GL of HC was significantly higher (p<0.001, Post hoc test) than HP. The maximal blood glucose concentration (cmax) were statistically significant different (p<0.001, ANOVA) between the three test foods, where cmax glucose of the test foods was significantly lower (p<0.001, Post hoc test) after consumption of glucose. The time to reach the maximal glucose concentration (tmax) was 27.0 ± 10.4 min for HC, 18.0 ± 6.2 min for HP and 24.0 ± 10.1 min for glucose. The time to reach the maximal glucose concentration (tmax) between the treatment groups were significantly different (p=0.011, ANOVA). In general, tmax glucose was significant higher after consumption of HP than HC (p=0.038, Mann-Whitney U test) and glucose (p=0.003, Mann-Whitney U test). The blood glucose curves after glucose and test food consumption are shown in in Figure 1. The cmax insulin was significantly higher for HC (Post hoc test p<0.001) and for HP group (post hoc test p=0.002) compared to glucose. Serum insulin curves after test food consumption showed different courses (Figure 2). No abnormal findings were seen in the subjects' glucose metabolism, which reconfirms that subjects were healthy.
With regard to the satiety assessment, in all satiety variables (desire to eat, hunger, satiety, and prospective food consumption) significant differences (p<0.05) between the treatment groups were found. The mean average hunger IAUC and satiety IAUC showed that HP led to the greatest feelings of satiety and the slightest feelings of hunger (IAUC satiety 4475.3 ± 4020.4 mm*h, IAUC hunger 435.9 ± 745.4 mm*h) over the 120 min post-ingestion period, followed by HC and glucose. After consumption of HP, hunger and satiety were significantly different to glucose (Post hoc test for satiety p=0.003; Mann-Whitney U test for hunger p=0.005). The minor desire to eat as well as the minor prospective food consumption was found in the HP group, followed by HC and glucose. The results for postprandial hunger and satiety score are summarized in Table 4 and Figure 3A and 3B. The graphs showed that feelings of satiety persists about 120 min and was not achieved baseline. In either case glucose produced slightest satiety which persists only short term.
The purpose of this study was to determine the glycemic response of two formula diets in a healthy population. The calculated GI and GL of HP formula diet (7.1 ± 7.2 and 1.8 ± 1.9) was considerably lower compared to HC formula diet (66.9 ± 41.8 and 22.8 ± 14.3). Therefore, only the HP formula diet can be classified as a low GI food (<55) and low GL food (≤10). Though close to 70, the HC formula diet has to be classified as medium GI (55 to 69) and high GL (≥20) food product [22,29]. This difference in calculated GI and GL of HC demonstrate that the relationship between both is not straightforward and GL is dependent upon portion size [29]. A lower GL might be achieved by a smaller portion size of HC formula diet. However, these findings are in accordance with measured GI values for meal replacement and weight management products such as formula diets or bars ranging from 5 to 73 for GI and 1 to 26 for GL [30].
Several food factors have been identified that influence absorption of glucose and therefore potentially the GI of a food. Some of these factors include: the food-matrix, processing, macronutrient and fiber content [23,24]. Carbohydrate ingredients such as glucose, maltodextrin or sucrose are predominantly rapidly digested carbohydrates which induce a relatively high glycemic and insulinemic response. The possibility to modify the glycemic impact of foods is by substitution rapidly digested carbohydrates by low glycemic carbohydrate alternatives [31]. The ingredient isomaltulose in HC formula diet constitutes such an alternative carbohydrate. With a calculated glycemic index of 32, is isomaltulose a low glycemic carbohydrate [28] and a natural reducing disaccharide compound of α-1,6-linked glucose and fructose. Studies have shown that isomaltulose intake decreases the postprandial rise in plasma glucose and insulin levels in healthy [31] and overweight subjects [32]. In addition, the ingredient fructose in HP formula diet provides an alternative carbohydrate, which does not acutely raise blood glucose, nor stimulate insulin secretion [33]. Accordingly, in the present study HC and HP formula diet attributed slower rates of postprandial response than the digestion of glucose. Nevertheless, the significant higher cmax glucose concentration after consumption of HC indicates a markedly glucose response compared to HP, which might be caused by containing isomaltulose, a source of glucose, in HC formula diet.
Further, the presence of indigestible carbohydrate such as fiber in food products may lower postprandial glycaemia and has been shown to reduce GI of a meal [34]. Therefore, it could has been assumed, that the presence of ingredients such as oligofructose in the HC formula diet may influence the glycemic response and may also contribute to a lower GI. Oligofructose, an inulin-type of fructan, is a non-digestible fully soluble and fermentable carbohydrate, with known prebiotic properties [35]. Accordingly, it has been shown that the IAUC for plasma glucose concentration was significantly lower after consumption of fructan compared to a totally digested carbohydrate [36]. Therefore, fructan also modulates the postprandial glucose response and could be a useful tool for controlling glucose homeostasis [36]. However, the oligofructose content of the HC formula diet was insufficient to contribute a low GI.
In contrast, the low GI and GL of HP formula diet might be partly attributed to its ingredients as whey protein isolate and soy protein isolate. Studies have shown that the addition of whey to meals stimulates insulin production, which in turn affects blood glucose clearance [37-39]. Accordingly, the significant higher cmax insulin and lower cmax glucose concentration after consumptions of HP formula diet indicates enhanced insulin release and reduced postprandial blood glucose compared to other test foods. However, the GI and GL were calculated by measured glucose, therefore the lacking of glucose source in HP formula diet apart of fructose might be a further reason for low GI.
Low glycemic foods are considered as favorable diet to contribute a prolonged feeling of satiety [40]. Further, short-term studies suggested that low-glycemic index diets could delay hunger and decrease subsequent energy intake compared with high glycemic index foods [41]. There was a larger IAUC for subjective feelings of satiety after intake of HP formula diet compared to HC formula diet. Consistently, the IAUC hunger was smaller after intake of HP formula diet. Therefore, both contrary questions referring to hunger and satiety seem to be good assessable. In the regulation of food intake also postprandial glucose and insulin levels may play certain roles, which suggest that high insulin concentration indicates satiety [42]. Therefore the analyzed data by VAS appears to agree with measured postprandial blood glucose and insulin concentration to a large extent. However, the larger volume of HP formula diet could possibly associate with decreased hunger and increased satiety [43]. In addition, the lower volume of HC formula diet portion could accelerate transit through the stomach and intestine and may lead to reduced stimulation satiety signals [44,45].
Nutritional macronutrients can influence satiety as well. A hierarchy of macronutrient satiating effects has been observed that protein being the most satiating followed by carbohydrates and fat at least [46]. It has been shown that soy protein and whey protein products enhance satiety [47,48] which may reduce energy intake [49]. Moreover evidence suggests that the consumption of fructan such as oligofructose is associated with lowered subjective hunger ratings and tendency to increases the concentration of satiety hormones [50]. Based on the nutritional ingredients of both formula diets it would be expected that HC as well as HP formula diet have the same satiating effect. The present results, however, confirm higher satiating effects by higher protein content in a diet.
Some research has shown that diets based on low glycemic foods have beneficially influence on body weight and body composition [7,51]. Providing a comparable energy intake, low glycemic index food diets may stimulate more weight loss in obese people than high glycemic index diets [51]. In contrast to this, we demonstrated no difference after consumption of low glycemic formula diet and moderate glycemic formula diet on weight loss and energy intake [52]. Our results suggest that the macronutrient compositions of meal replacements are less crucial for the efficacy of formula diets. Therefore, the most important factor influencing weight loss caused by HC and HP formula diet can be attributed to a reduced energy intake [52].
The present data show that the protein-rich formula diet is a low-GI and low-GL food and the carbohydrate-rich formula diet can be classified as moderate-GI and high-GL food. In view of postprandial glucose metabolism HP formula diet might be useful for meal replacements in diets to induce lower blood glucose and insulin response.
With regard to the favorable effects of low glycemic response food, the HP formula diet achieved good effects in view of a low glycemic response.
The provision of the test products by Certmedica International GmbH (Aschaffenburg, Germany) is kindly acknowledged. The authors are solely responsible for the design and conduct of the study, collection, management, analysis, and interpretation of the data, as well as preparation of the manuscript. All authors had full access to the data and take responsibility for its integrity. All authors have read and agree with the manuscript as written. We would like to thank the participants who contributed their time to this project.

![]()

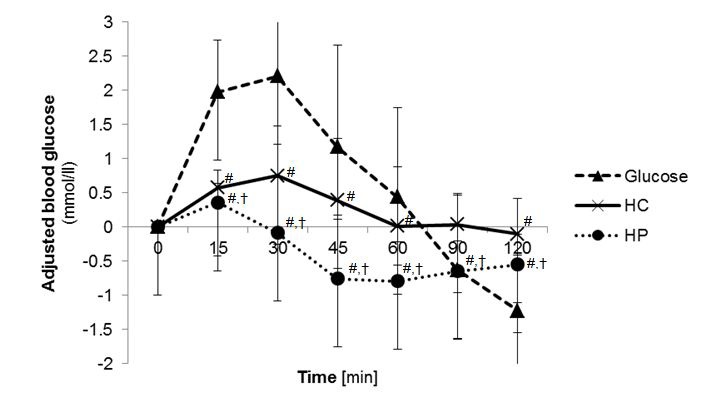 |
| Figure 1: Postprandial blood glucose concentration 2 h after test food consumption (n=20); adjusted to baseline; [#] p<0.05 compared to glucose; [†] p<0.05 compared HC with HP; (Analysis with ANOVA followed by Bonferroni); (HC: high carbohydrate formula diet; HP: high protein formula diet) |
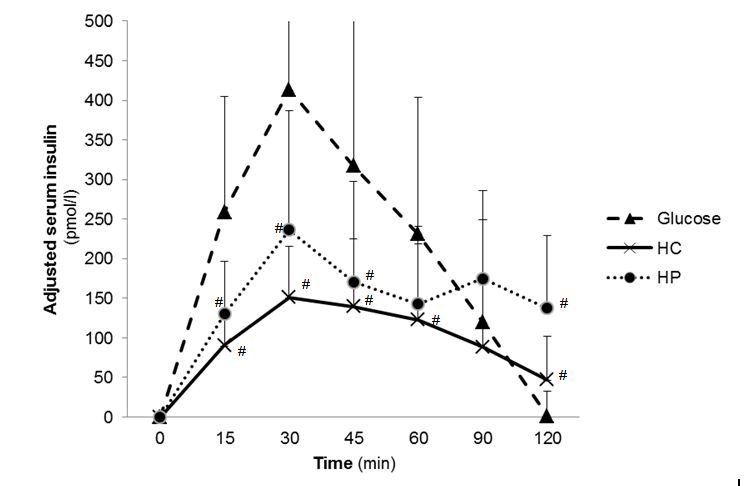 |
| Figure 2: Postprandial serum insulin concentration 2 h after test food consumption (n=20); adjusted to zero-value; [#] p<0.05 compared to Glucose; [†] p<0.05 compared HC with HP (Analysis with ANOVA followed by Bonferroni); (HC: high carbohydrate formula diet; HP: high protein formula diet) |
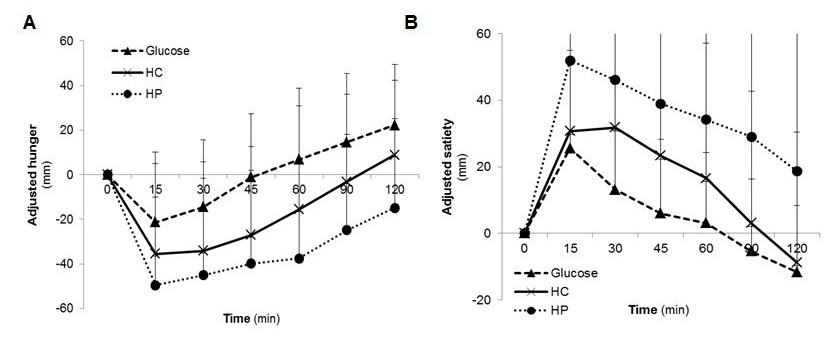 |
| Figure 3: Postprandial A) hunger and B) satiety scores during 2 h after test food consumption (n=20); adjusted to baseline (HC: high carbohydrate formula diet; HP: high protein formula diet) |
| Nutritional values | Glucose | HC | HP | |||||
| per 100 g |
per portion# (45.9 g) | per 100 g |
per portion# (76.2 g) | per portion# (76.2 g) | per 100 g |
per portion# (147.1 g) | per serving size ** | |
| Energy [kcal] | 367 | 12.5 | 371.4 | 283.1 | 313 | 364 | 535.5 | 311 |
| Carbohydrate [g] | 91.8 | 50.0 | 65.5 | 50.0 | 34.1 | 34.0 | 50.0 | 26.0 |
| from Sugar [g] | 91.8 | 50 | 64.0 | 48.8 | 33.6 | 33.0 | 48.5 | 25.6 |
| Protein [g] | 0 | 0 | 22.5 | 17.2 | 16.9 | 56.4 | 82.9 | 29.2 |
| Fat [g] | 0 | 0 | 0.03 | 0.02 | 7.8 | 0.2 | 0.3 | 9.8 |
| Total fiber [g] | 0 | 0 | 7.4 | 5.6 | 2.2 | 0 | 0 | 0 |
| # Portion providing 50 g of available carbohydrates, dissolved in 300 ml water; * serving size as recommended preparation: 300 ml milk (1.5% fat) + 30 g carbohydrate-rich powder + 5 g vegetable oil; ** serving size as recommended preparation: 300 ml milk (1.5% fat) + 34 g protein-rich powder + 5 g vegetable oil Table 1: Nutritional composition of the three test foods (Glucose. HP: high protein formula diet; HC: high carbohydrate formula diet) |
||||||||
| m=9, w=11 | Mean ± SD | Min. - Max. |
| Age [years] | 25.8 ± 5.8 | 20 - 44 |
| Weight [kg] | 76.3 ± 16.7 | 51.8 – 116.9 |
| BMI [kg/m²] | 23.8 ± 2.4 | 20.2 - 28.6 |
| Glucose [mmol/l] | 79.0 ± 5.3 | 71 - 92 |
| Insulin [pmol/l] | 7.8 ± 5.7 | 2.0 - 29.0 |
| Abbreviations: SD: Standard deviation; Min: Minimum; Max: Maximum; BMI: Body Mass Index; n: number of subjects; m: men; w: women Table 2: Characteristics of subjects at baseline (n=20) |
||
| Glucose | HC | HP | p | |
| GI | 100 ± 0 | 66.9 ± 41.8# | 7.1 ± 7.2#,† | <0.001* |
| GL | 100 ± 0 | 22.8 ± 14.3 | 1.8 ± 1.9#,† | <0.001* |
| IAUC0-2h Glucose [mmol/l*min] | 269.3 ± 219.2 | 222.3 ± 232.5 | 10.7 ± 17.0#,† | <0.001* |
| cmax Glucose [mmol/l] | 2.6 ± 1.1 | 1.0 ± 0.5# | 0.5 ± 0.5# | <0.001* |
| IAUC0-2h Insulin [pmol/l*min] | 26086.9 ± 17383.5 | 14357.5 ± 10978.7# | 18402.1 ± 9776.2 | 0.022* |
| cmax Insulin [pmol/l] | 434.8 ± 224.4 | 183.9 ± 80.9# | 248.2 ± 145.8# | <0.001* |
| tmax Insulin [min] | 32.25 ± 8.8 | 35.3 ± 14.0 | 29.3 ± 10.3 | 0.245** |
| mean ± standard deviation; GI: glycemic index; GL: glycemic load; HC: high carbohydrate formula diet; HP: high protein formula diet; [*] ANOVA followed by Bonferroni post hoc analysis; [**] Kruskal-Wallis Test followed by Mann-Whitney U test; [#] p<0.05 compared to Glucose; [†] p<0.05 compared HC with HP; c<sub>max</sub> adjusted to zero-value Table 3: Glycemic index, postprandial glucose and insulin concentrations during 2 h after test food consumption (n=20) |
||||
| Glucose | HC | HP | p | |
| IAUC desire to eat [mm*h] | 1755.1 ± 2142.9 | 853.3 ± 1422.7 | 856.1 ± 1796.9# | 0.037** |
| IAUC hunger [mm*h] | 1646.6 ± 1933.8 | 1038.1 ± 1903.6 | 435.9 ± 745.4# | 0.023** |
| IAUC satiety [mm*h] | 1244.6 ± 1331.3 | 2604.1 ± 2848.2 | 4475.3 ± 4020.4# | 0.004* |
| IAUC PFC [mm*h] | 1583.9 ± 1892.2 | 596.4 ± 994.7# | 517.2 ± 992.6# | 0.015** |
| Appetite Score [mm*h] | 1398.4 ± 1558.7 | 678.4 ± 1120.7 | 561.9 ± 1158.8# | 0.019** |
| mean ± standard deviation; GI: glycemic index; IAUC: incremental area under the curve; HC: high carbohydrate formula diet; HP: high protein formula diet; PFC: prospective food consumption; [*] ANOVA followed by Bonferroni post hoc analysis; [**] Kruskal-Wallis Test followed by Mann-Whitney U test; [#] p<0.05 compared to Glucose Table 4: Postprandial satiety scores during 2 h after test food consumption (n=20) |
||||


