Open Access
Research
Max Screen >>
ISSN: 2348-9812
Copyright: © 2014 Mohamed A. Makhyoun. This is an open-access article distributed under the terms of the Creative Commons Attribution License, which permits unrestricted use, distribution, and reproduction in any medium, provided the original author and source are credited.
Related article at Pubmed, Google Scholar
C12H20N6NiO6S2 or NiL2(SCN)2](NH4)2.2H2O, where L is 2-hydroxy-pyridine-N-oxide, has been prepared and characterized using elemental analyses, IR, UV and visible spectrometry, magnetic moment measurements, thermal analyses and single crystal X-ray analyis. The results indicate that the complex reacts as a bidentate ligand and is bound to the metal ion via the two oxygen atoms of the ligand (HL). The activation energies, ΔE*, entropies ΔS*, enthalpies ΔH* and order of reactions have been derived from differential thermo-gravimetric (DTA) curves. Based on inhibition zone diameter measurements, the complex exhibited significant antibacterial activity against both Staphylococcus aureus and Escherichia coli. It also exhibited significant antifungal activity against Candida albicans, but no activity was found against Aspergillus flavus. The crystal structure of the Ni(II) complex [C12H20N6NiO6S2], Mr = 467.17, was determined from Cu Kα X-ray diffraction data, λ = 1.54178 Å, at 100 K using direct methods. The crystals are monoclinic, space group P21/n with Z = 4 and a = 8.9893(2) Å, b = 17.6680(5) Å, c = 12.5665(3) Å, β = 108.609(1)°. In parallel with this study corresponding results were derived for the crystal structure determined independently from synchrotron X-ray diffraction data, λ = 0.61990 Å, at 100 K. The unit cell parameters derived in this experiment are a = 9.000(2) Å, b = 17.700(4) Å, c = 12.590(3) Å, β = 108.61(3)°. Both studies show 4 O and 2 N atoms coordinating Ni in a distorted octahedral arrangement. Each of the Ni 2-hydroxy-pyridinium-N-oxide moieties is highly planar and the S=C=N-Ni ligands are approximately linear. The crystal structure is characterised by a number of strong hydrogen bonds.
Keywords: 2-Hydroxy-pyridine-N-oxide derivatives; Infrared; Ultraviolet; DTG (Differential thermo-gravimetric); TGA (Thermo-gravimetric ); DTA (Differential thermal analysis ); X-ray crystal structure: Cu Kα and synchrotron data; Biological properties
Compounds containing N-oxides and sulphur possess important biological activity [1,2]. Compounds containing sulphur, as well as their metal complexes exhibit numerous biochemical applications [3-5]. 2-Hydroxy-pyridine-N-oxide (HOPNO) [6] and 2-mercaptopyridine-N-oxide (HSPNO) [7,8] have been described as new and efficient transition-state analog (TS-analog) inhibitors for the mushroom tyrosinase enzyme. 2-Hydroxy-pyridine-N-oxide derivatives have been shown to remove iron from human transferrin and horse spleen ferritin at pH 7.4 at levels higher than those caused by desferrioxamine [8]. The intraperitoneal and intragastric administration of 2,4-dihydroxypyridine-N-oxide to iron-loaded 59Fe-labelled mice caused an increase in 59Fe excretion comparable to that caused by intraperitoneal desferrioxamine. These results increase the prospects for the use of these chelators as probes for studying iron metabolism and in the treatment of iron overload and other diseases of iron imbalance [8]. 2-Hydroxy-N-oxide is also now used as a wood preservative to prevent fungal decay and insect attack [9]. Moreover, pyridine N-oxide derivatives are also employed in the oxidation of alkyl halides to aldehydes, due to the relative ease of deoxygenation compared to deoxygenation of tertiary amine oxides [10].
The organic ligand 2-hydroxy-pyridine-N-oxide (HOPO) was purchased from Aldrich and used without further purification. Analytical grade nickel chloride, absolute ethanol, distilled water, dimethyl formamide (DMF) and dimethyl sulfoxide (DMSO) were purchased from the El-Gomhoria Company, Alexandria and used without further purification.
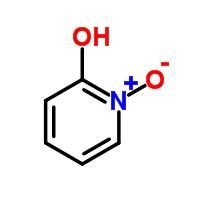
Synthesis of the Ni(II) complex-[NiL2(SCN)2].2NH4.2H2O:To a solution of 2-hydroxy-pyridine-N-oxide (I) (HL) (0.11 gm i.e. 1 mmol in 10 mL hot ethanol), a solution of NiCl2.6H2O (0.24g i.e. 1 mmol in 10 mL ethanol) was added with constant stirring.
Solid NH4SCN (0.5 gm) was added and the reaction mixture was refluxed on a water bath for 2 h, cooled and left at room temperature for 48 h. The isolated crystals were then filtered off, washed several times with EtOH followed by Et2O and recrystallized from H2O. The lustrous green crystals were filtered off, washed several times with Et2O, dried under vacuum and kept over P4O10. This procedure did, however, unexpectedly leave the hydrated water intact, an effect reported previously, for example by Agarwal and Rastogi [11]. The reaction scheme is shown in Figure 1.
The Fourier transform infrared (FT-IR) spectra of the ligand and solid nickel(II) complex were recorded on a Perkin Elmer 2000 FT-IR spectrometer. Data were collected at a resolution of 4 cm-1. The solid sample was measured as a KBr pellet in the 4000–370 cm-1 spectral range. Nujol mull electronic UV-Vis spectra were recorded in the 190-900 nm range. The spectrophotometer measurements in the visible and ultraviolet regions were made with a Thermo scientific Evolution 300 UV-visible spectrophotometer. Absorbance was calibrated using a standard solution of CoCl2 or K2CrO4. The absorption spectra of the solutions were measured using 1.0 cm silica cells. Molar magnetic susceptibilities, were determined with a JEOL (JES-FE2XG) ESR spectrometer at room temperature (298 K) using Gouy's method, and corrected for diamagnetism using Pascal's constants, and Hg[Co(SCN)4] as a calibrant. The metal ion content was determined using a computer controlled 850-Fisher Jarrell ash atomic absorption spectrophotometer. The analyses of C, H, and N were performed using an Elementar Vario El (III) elemental analyser. Thermal analyses (TG, DTG and DTA) were carried out in an N2 atmosphere with a heating rate 10 °C min-1 using a Shimadzu TGA 50H and a DTA 50 thermal analyzer. The Shimadzu instrument which uses a single light source and one optical system does not require calibration.
Antimicrobial screening tests were conducted at the Microanalytical Centre, Faculty of Science, Cairo University. The antimicrobial activity of the test samples was determined using a modified Kirby-Bauer disc diffusion method [12]. The synthesized compound was dissolved to prepare a stock solution of 1 mg/mL using DMSO. Stock solution was aseptically transferred and two-fold diluted to provide solutions of different concentrations. The antibacterial and antifungal activities were determined by measuring the diameters of the inhibition zone (mm) with DMSO as a control. The cultures were routinely maintained on nutrient agar (NA) and incubated at 37 °C. Bacterial or fungal inoculates were obtained by diluting stock bacterial or fungal culture suspensions (100 mL volumes of growing cultures in NA broth at 37 °C overnight) and were spread uniformly onto NA plates. Solutions of the tested compound and reference drugs were prepared by dissolving 10 mg of the compound in 10 mL of DMSO. Approximately, 0.1 mL of each sample was pipetted into a well (depth 3 mm) made in the centre of the agar. Sterile 8 mm discs were impregnated with test compound. The disc was placed onto the plate. Each plate had one control disc impregnated with solvent. The plates were incubated at 37 °C for 18-48 h. Standard discs of tetracycline (antibacterial agent; 10 μg/disc) and amphotericin B (antifungal agent; 10 mg/disc) served as positive controls for antimicrobial activity while filter discs impregnated with 10 μl of solvent DMSO were used as a negative control.
Crystals formed when the refluxed reaction mixture was cooled and left at room temperature for 48 h. They were filtered off, washed several times with EtOH followed by Et2O and then recrystallized from H2O. The lustrous green crystals were filtered off, washed several times with Et2O, dried under vacuum and kept over P4O10. Crystal sizes varied from (0.18 – 0.50) x (0.15 – 0.50) x (0.14 – 0.30) mm3.
Cu Kα Structure: A crystal with dimensions 0.18 x 0.15 x 0.14 mm3 was used for data collection. Intensity data were collected using monochromated Cu Kα radiation, λ= 1.54178 Å, on a Bruker Prospector diffractometer, and processed with the SAINT data processing program [13,14]. The diffractometer was equipped with an Oxford Cryosystems Cryostream Controller 700 [15], enabling the data to be collected at 100 K. The crystal showed no significant variation in intensity during the course of data collection. A total of 11142 reflections was collected which reduced to 3448 independent reflections (R(int) = 0.0455). The structure was solved using SHELX-86 [16] and refined using SHELX-97 [17] implemented on the WinGX [18] system of programs. Hydrogen atoms were refined in riding mode with tied isotropic temperature factors. The chemical formula and atom numbering are shown in Figure 2. Figure 3a is an Ortep [19] plot rendered by RASTER 3D [20] excluding the NH4+and H2O solvates. Figure 3b shows the distorted octahedral coordination of the Ni atom by 2 N atoms and 4 O atoms drawn with MERCURY [39]. Table 1a summarizes the essential crystal and X-ray analysis refinement data.
Synchrotron Structure: The crystal used for data collection was 0.30 x 0.50 x 0.50 mm3 and was mounted on a SPINE standard pin in 30% glycerol. Intensity data were collected on the macromolecular crystallography (MX) beamline I02 at Diamond Light Source. In order to optimize data collection, the beamline was operated at 20 keV giving λ= 0.61990 Å. Intensity data were measured using a Pilatus 6M detector at a distance of 179.5mm and processed with the Xia2 with the 3dii option [21–28] and scaled using the XPREP software from Bruker (www.bruker.com). As an MX beamline, I02 is equipped with an Oxford Instruments cryojetXL cryostream. Data were collected at 100 K. A total of 29239 reflections were collected which reduced to 5011 independent reflections (R(int) = 0.0205). The structure was solved and refined as described above for the Cu Kα data. Table 1b summarizes the essential crystal and X-ray analysis refinement data.
The chelating properties of 2-hydroxy-pyridine N-oxide (HL) (I), behaving as a heterocyclic analog of hydroxamic acids, have been reported previously by potentiometric and spectrophotometric methods for several divalent and trivalent metals. Divalent metal ions such as magnesium (II), calcium (II), cobalt (II), nickel (II), copper (II), and zinc (II)] have also been used in chelation studies, the nickel (II) ion being chosen for the present study.
The NiL2(SCN)2.(NH4)2.2H2O complex was formed as result of the reaction between 2-pyridinol-N-oxide and NiCl2 salt in the presence of NH4SCN. Analytical data for the organic compound and the complex are presented in Table 2. Figure 2 shows the chemical scheme derived from the X-ray analysis.
The FTIR absorption bands of the Ni(II) complex have been compared with those of the free ligand (Table 3) in order to determine the bonding sites in the complex. The ligand exhibits an absorption band at 3331 cm-1 due to the presence of an OH group. The nitroso group is located at 1446 cm-1 [29]. The N-O bending frequency of the aromatic nitroso group is assigned to the band at 842 cm-1 [30,31]. The δ O---H-O mode of vibration is identified as the band at 1548 cm-1 for nitroso and OH groups. In the Ni(II) complex, a band at 3467 cm-1 was attributed to νH2O; the OH groups were eliminated during this process as revealed by IR (this corresponds to these groups coordinating with the Ni(II) ion). Strong bands at 2082 and 2148 (Table 3) were assigned to the ν(SCN) group [32]. The NH4+ ion shows a band at 3214 cm-1 resulting from a NH4+ anti-symmetric stretching vibration and another strong absorption band at 1394 cm-1 resulting from an NH4+ bending vibration. The other bands in the region between 1450 and 1600 cm-1 arise mainly from pyridine ring vibrations.
[NiL2(SCN)2].(NH4)2 2H2O possesses d-d transition bands at 400 nm, a broad band centred at 690, 920 and 1110 nm, respectively as a result of 3A2g → 3T1g(P), 3A2g → 1Eg + 3T1g(F), 3A2g → 3T2g, transitions, respectively, in an octahedral structure [33]. This was confirmed by a magnetic moment value of 3.6 B.M.
The TGA thermal behaviour of [NiL2(SCN)2].(NH4)2 2H2O complex was studied (Figure 4) and revealed that the complex decomposed in three steps. The first between 52-287 °C with DTG = 72.84 °C, 110.50 °C and 254.16 °C where 2H2O, 2NH4+, 2SCN and 2CH=NO moieties were lost (found: 59.148%; calc. 58.652%). The second process occurred between 287-329 °C, with DTG = 307.12 °C, is due to the loss of a CO (carbon monoxide) molecule, (found: 6.789%; calc: 5.994%). The third step starts at 329 and ends at 575 °C with DTG = 352.67 and 524.41 °C assigned to the decomposition of CH2=CH2 + CH2 + CH.CH=CH2 moieties and left with a residue of NiO (found 16.646 %; calc: 15.990%). The DTA of this complex shows four endothermic peaks below 350 °C namely at 77.84, 110.45, 256.66 and 309.96 °C, attributed to the loss of 2H2O , 2NH4+, 2SCN , 2CH=NO and CO moieties and an exothermic peak at 527.31 °C.
The thermodynamic parameters of the decomposition processes of [NiL2(SCN)2].(NH4)2 2H2O complex, namely, activation energy Ea θ, enthalpy of reaction (ΔHθ), entropy (ΔSθ) were evaluated by employing the Horowitz-Metzger equation [34].
The order of chemical reactions (n) was calculated via the peak symmetry method, Kissinger [35]. The asymmetry of a peak or trough, As, was calculated as follows:
As =0.63 n2 where n = 1.26 (a/b)1/2
Where a and b are derived from the DTA curve as indicated in Figure 4.
The values of collision factor, Z, also known as the frequency factor [34] were hand calculated using the relation [36]:
Z= (Eaθ / RTm) β exp (Eaθ/RTm)
where R is the molar gas constant, β is the heating rate (kAs-1), Tm is the maximum temperature for an exothermic transition or the minimum temperature for an endothermic transition in the DTA outputs. See reference [34] equation 91 .
The entropies of activation ΔSθ are calculated from:
Z = (kTm/ h) exp ΔSθ/R
Where k is the Boltzmann constant and h is Planck's constant.
The change in enthalpy (ΔHθ), taking place at any peak temperature, Tm is given by: (ΔSθ) = ΔHθ/ Tm.
Measurements of Δt were made on the curve (Figure 5) corresponding to different temperatures. Based on least squares calculations, the ln(Δt) ν. 1000/T plots for the complex, gave straight lines from which the activation energies were calculated according to the method of Piloyan et al.[37]. The slope is of the Arrhenius type and equals -Ea θ / R.
The following conclusions can be drawn from the DTGA data:
The activation energy ΔEaθ = 59.814 kJmol-1 for the endothermic peak and 330.066 kJmol-1 for the exothermic trough. Thus, the final decomposition step where NiO is formed needs more activation energy than the preceding step. The appearance of fractional orders in the endothermic and exothermic peaks suggests that the reaction proceeds via a complicated mechanism. The change of entropy, ΔSθ, values were -0.22 and -0.23 kJ K–1 mol-1 for both thermal transitions and are nearly of the same magnitude indicating that the transition states are more ordered than the reactants [38]. The calculated ΔHθ, were found to be -59.10 and -121.89 kJmol-1, respectively. The values of the collision number, Z, (5.202 and 7.313 s-1) showed a direct relation to ΔEaθ.
The [NiL2(SCN)2].(NH4)2 2H2O complex was found to be effective against E.coli (gram (-)) and S. aureus (gram (+)) bacteria, where its inhibition zone diameters were found to be 21 and 28 mm/mg sample, respectively. Also, it was found to be effective against C. albicans fungus, where the inhibition zone was found to be 20 mm/mg sample.
[Note: The molecular geometry of both the Cu Kα and synchrotron X-ray structures is presented, values in square parentheses [ ] apply to the structure determined from synchrotron data.]
Ni Coordination: The 4 O and 2 N atoms (Figure 3b) coordinated to Ni form a distorted octahedral arrangement. The 3 axial bond angles have an average value of 171.4(1.3)° [171.4(1.3)°] and the 12 equatorial bond angles an average value of 89.8(5.1)°[(89.8(5.1)°] ideal values 180° and 90°, respectively).
Pyridine Rings A1 and A2: The pyridine rings are both highly planar. Average bond lengths:
C-C = 1.383(14) Å [1.384(15) Å], C-N = 1.377(1) Å [1.376(3) Å]. Average bond angles: C-C-C = 120.1(6)° [119.8(1.1)°], C-C-N = 119.7(9)° [119.7(9)°] and C-N-C = 120.8(2)° [ 120.6(2)°].
Ni-O-N-C-O Rings: These two rings are also highly planar.
Average bond lengths:
C-O = 1.305(1) Å [1.303(5) Å], N-O = 1.338(7) Å, [1.3387(1) Å],
Ni-O = 2.05(4) Å [2.05(4) Å].
Average bond angles:
O-C-N = 119.0(3)° [ 118.9(1)°], C-N-O = 118.1(2)°, [ 118.1(6)°],
O-Ni-O = 80.0(5)°, [ 80.1(5)°].
Fused Ring Systems A1B1 and A2B2: Both fused ring moieties A1B1 and A2B2 (Figure 2), respectively are highly planar with esd's from their ring planes of 0.05 Å [0.05 Å] and 0.09 Å [0.09 Å ], respectively and interplanar angle 75.64(3)° [79.35(3)°].
Thiocyanate: In the S = C = N - Ni ligands average bond lengths are:
S-C = 1.650(8) Å [1.650(5) Å], C=N = 1.157(1) Å [1.159(1) Å],
N-Ni = 2.065(9) Å [2.064(11) Å].
With average bond angles of:
S-C-N = 179.1(6)°, [179.3(7)°], C-N-Ni = 173(7)° [ 173(7)°] the S = C = N - Ni ligands are approximately linear .
Least Squares Planes:
(i) A1B1N(4)C(12)S(1): This system is highly planar comprising 13 atoms having an rms deviation of the 13 fitted atoms of 0.11 Å [0.11 Å].
(ii) A2B2N(3)C(11)S(2): Also comprises 13 atoms and is highly planar with an rms deviation of the 13 fitted atoms of 0.22 Å [0.22 Å].
Planes (i) and (ii) are approximately perpendicular with an interplanar angle of 87.12 (1)° [ 87.25 (1)°].
Hydrogen Bonding: The crystal structure is characterized by a number of strong hydrogen bonds listed in Table 4. Figure 6 shows selected hydrogen bonds in this scheme drawn with MERCURY [29].
The structural studies described here are distinguished by having been undertaken with two independent data sets measured (1) on a university diffractometer (Bruker Prospector with a microfocus source) and (2) on a CMOS flat plate detector with synchrotron radiation. The data in Table 1a and Table 1b indicate that both analyses are very high quality. It is of interest to summarize here the overall differences between these two results. The data in Table 5a gives an overview of the basic data qualities. This shows that the synchrotron data set is superior in the 4 categories: resolution, number of reflections, number of symmetry independent reflections measured and internal R factor R(int). As a result the final refinement R-factor R1 is also superior. Table 5b indicates the effect of this superiority on the values of a selection of the molecular geometry types of the refined structures. The synchrotron data values are significantly superior in all cases. This result may be important for future structural studies where selection of the best method, for example to distinguish or determine subtle bonding characteristics is a prime factor.
The study described here successfully synthesized and characterized the Ni(II) Complex of 2-hydroxy-pyridine-N-oxide designated in full as: Ammonium (Δ/Λ)-cis,cis,cis(bis(isothiocyanato)(bis(2-pyridinolate-1-oxide)-κ2O,O')nickelate(II) dehydrate.
Crystallographic data (excluding structure factors) for the structures reported in this paper have been deposited with the Cambridge Crystallographic Data Centre as supplementary publication nos. CCDC-974796 and 974797. Copies of available material can be obtained, free of charge, on application to the Director, CCDC, 12 Union Road, Cambridge CB2 1EZ, UK (fax: +44-(0) 1223-336033 or e-mail: teched@chemcrys.cam.ac.uk).

![]()

Identification code |
Ni Complex 13 |
|
Empirical formula |
C12 H20 N6 Ni O6 S2 |
|
Formula weight |
467.17 |
|
Temperature |
100(2) K |
|
Wavelength |
1.54178 Å |
|
Crystal system |
Monoclinic |
|
Space group |
P21/n |
|
Unit cell dimensions |
a = 8.9893(2) Å |
= 90°. |
b = 17.6680(5) Å |
= 108.609(1)°. |
|
c = 12.5665(3) Å |
= 90°. |
|
Volume |
1891.50(8) Å3 |
|
Z |
4 |
|
Density (calculated) |
1.641 Mg/m3 |
|
Absorption coefficient |
3.945 mm-1 |
|
F(000) |
968 |
|
Crystal size |
0.18 x 0.15 x 0.14 mm3 |
|
Theta range for data collection |
4.48 to 68.24°. |
|
Index ranges |
-10<=h<=10, -20<=k<=21, -15<=l<=15 |
|
Reflections collected |
11142 |
|
Independent reflections |
3448 [R(int) = 0.0455] |
|
Completeness to theta = 66.60° |
99.8 % |
|
Absorption correction |
Semi-empirical from equivalents |
|
Max. and min. transmission |
0.6081 and 0.39725 |
|
Refinement method |
Full-matrix least-squares on F2 |
|
Data / restraints / parameters |
3448 / 2 / 292 |
|
Goodness-of-fit on F2 |
1.011 |
|
Final R indices [I>2sigma(I)] |
R1 = 0.0330, wR2 = 0.0823 |
|
R indices (all data) |
R1 = 0.0412, wR2 = 0.0867 |
|
Largest diff. peak and hole |
0.573 and -0.358 e.Å-3 |
Table 1a: Crystal and structure refinement data using conventional Cu X-ray source
Identification code |
Ni Complex 13 |
|
Empirical formula |
C12 H20 N6 Ni O6 S2 |
|
Formula weight |
467.16 |
|
Temperature |
100(2) K |
|
Wavelength |
0.61990 Å |
|
Crystal system |
Monoclinic |
|
Space group |
P21/n |
|
Unit cell dimensions |
a = 9.0000(18) Å |
= 90°. |
b = 17.700(4) Å |
= 108.61(3)°. |
|
c = 12.590(3) Å |
= 90°. |
|
Volume |
1900.7(7) Å3 |
|
Z |
4 |
|
Density (calculated) |
1.632 Mg/m3 |
|
Absorption coefficient |
0.821 mm-1 |
|
F(000) |
968 |
|
Crystal size |
0.30 x 0.50 x 0.50 mm3 |
|
Theta range for data collection |
1.80 to 25.12°. |
|
Index ranges |
-12<=h<=12, -23<=k<=23, -17<=l<=17 |
|
Reflections collected |
28469 |
|
Independent reflections |
5011 [R(int) = 0.0205] |
|
Completeness to theta = 25.12° |
98.0 % |
|
Max. and min. transmission |
0.7908 and 0.6844 |
|
Refinement method |
Full-matrix least-squares on F2 |
|
Data / restraints / parameters |
5011 / 0 / 325 |
|
Goodness-of-fit on F2 |
1.118 |
|
Final R indices [I>2sigma(I)] |
R1 = 0.0220, wR2 = 0.0587 |
|
R indices (all data) |
R1 = 0.0220, wR2 = 0.0587 |
|
Extinction coefficient |
0.0342(12) |
|
Largest diff. peak and hole |
0.467 and -0.490 e.Å-3 |
Table 1b: Crystal and structure refinement data using Synchrotron X-ray source
Compound |
%C Found (calculated) |
%H Found (calculated) |
%N Found (calculated |
%S Found (calculated) |
%Ni Found (calculated) |
2-hydroxy-pyridine-N- oxide (HL) |
54.437 |
4.189 |
11.989 |
- |
- |
[NiL2(SCN)2].(NH4)2 2H2O |
29.05 |
5.14 |
17.28 |
13.800 |
13.73 |
Table 2: Analytical data for the ligand and [NiL2(SCN)2].(NH4)2 2H2O complex.
Compound |
νH2O |
ν OH |
ν CH |
δO…HO |
ν N-O |
ν SCN |
νNH4+ |
δ NO |
ν NH4+ |
ν M-O |
2-hydroxy-pyridinum-N- oxide (HL) |
3331 |
2973 |
1446 |
880 |
||||||
[NiL2(SCN)2.]. 2NH2 .2H2O |
3467 |
2987 |
1548 |
1568 |
2148 |
3214 |
883 |
1394 |
457 427 |
Table 3: IR band assignments (cm-1) for the ligand and Ni(II) complex.
D-H...A |
d(D-H) |
d(H...A) |
d(D...A) |
<(DHA) |
N(6)-H(6F)...O(5) |
0.91(4) |
2.06(4) |
2.965(3) |
172(3) |
N(6)-H(6E)...O(2)#1 |
0.94(4) |
1.92(4) |
2.823(3) |
162(3) |
N(5)-H(5F)...S(2)#2 |
0.91(3) |
2.38(3) |
3.281(2) |
171(3) |
N(5)-H(5E)...N(1) |
0.94(4) |
2.68(4) |
3.511(3) |
149(3) |
N(5)-H(5E)...O(4) |
0.94(4) |
1.87(4) |
2.783(3) |
164(3) |
N(5)-H(5D)...O(5) |
0.97(3) |
1.98(3) |
2.818(3) |
143(3) |
N(5)-H(5C)...S(1)#1 |
0.94(4) |
2.42(4) |
3.312(2) |
158(3) |
O(5)-H(5A)...N(4)#2 |
0.81(3) |
2.67(3) |
3.400(2) |
150(4) |
O(5)-H(5A)...N(3)#2 |
0.81(3) |
2.41(3) |
3.038(2) |
135(4) |
Symmetry transformations used to generate equivalent atoms: #1 x+1/2,-y+1/2,z-1/2 #2 x+1,y,z
Table 4: Hydrogen bond geometry [Å and °].
Data Collection |
Resolution Achieved |
Total Number of Reflections Measured |
Number of Symmetry Independent Reflections |
R(int) |
R1 for I>2s(I) |
Conventional Laboratory Diffractometer |
1.00Å |
11,142 |
3448 |
0.0455 |
0.0330 |
Diamond Synchrotron Pilatus |
0.73 Å |
28,469 |
5011 |
0.0205 |
0.0220 |
Table 5a: Comparison of Data and Refinement Parameters
Data Collection Method |
Typical Bond Length esd's Å |
Typical Bond Angle esd's o |
|||
C – C |
S – C |
Ni –O |
C - C - C |
O – Ni - O |
|
Conventional Laboratory Diffractometer |
0.003 |
0.002 |
0.002 |
0.2 |
0.06 |
Diamond Synchrotron Pilatus |
0.001 |
0.001 |
0.0008 |
0.1 |
0.03 |
Table 5b: Comparison of Molecular Geometry esd's
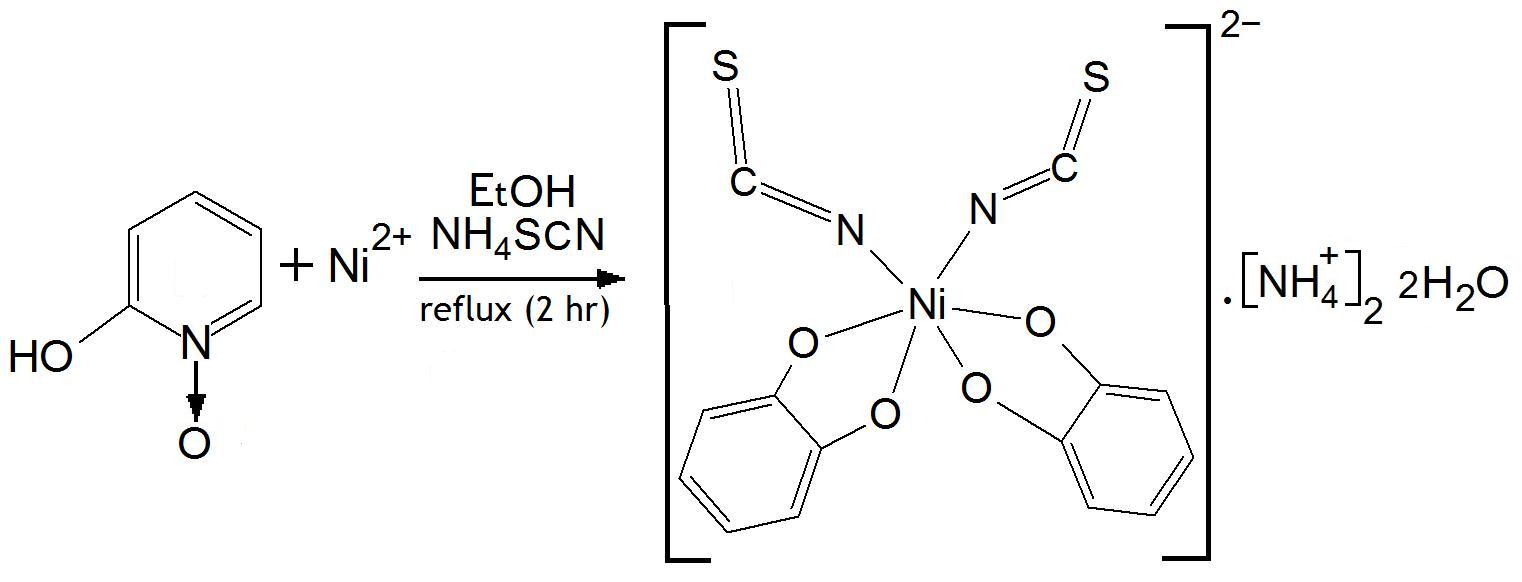 |
| Figure 1: Scheme for the synthesis of the Ni(II) complex: [NiL2(SCN)2].(NH4)2 2H2O. |
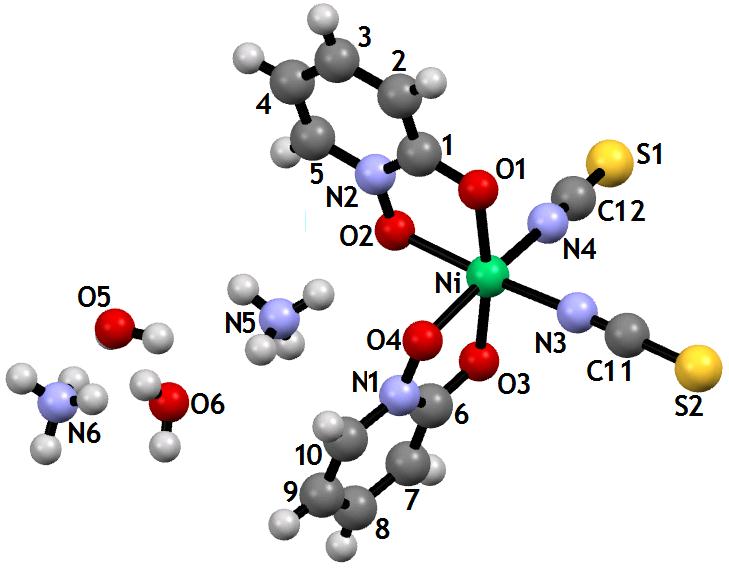 |
| Figure 2: MERCURY [39] plot derived from the X-ray structure of the Ni(II) complex: [NiL2(SCN)2].(NH4)2 2H2O. The atom numbering used in the two X-ray structure analyses is shown. |
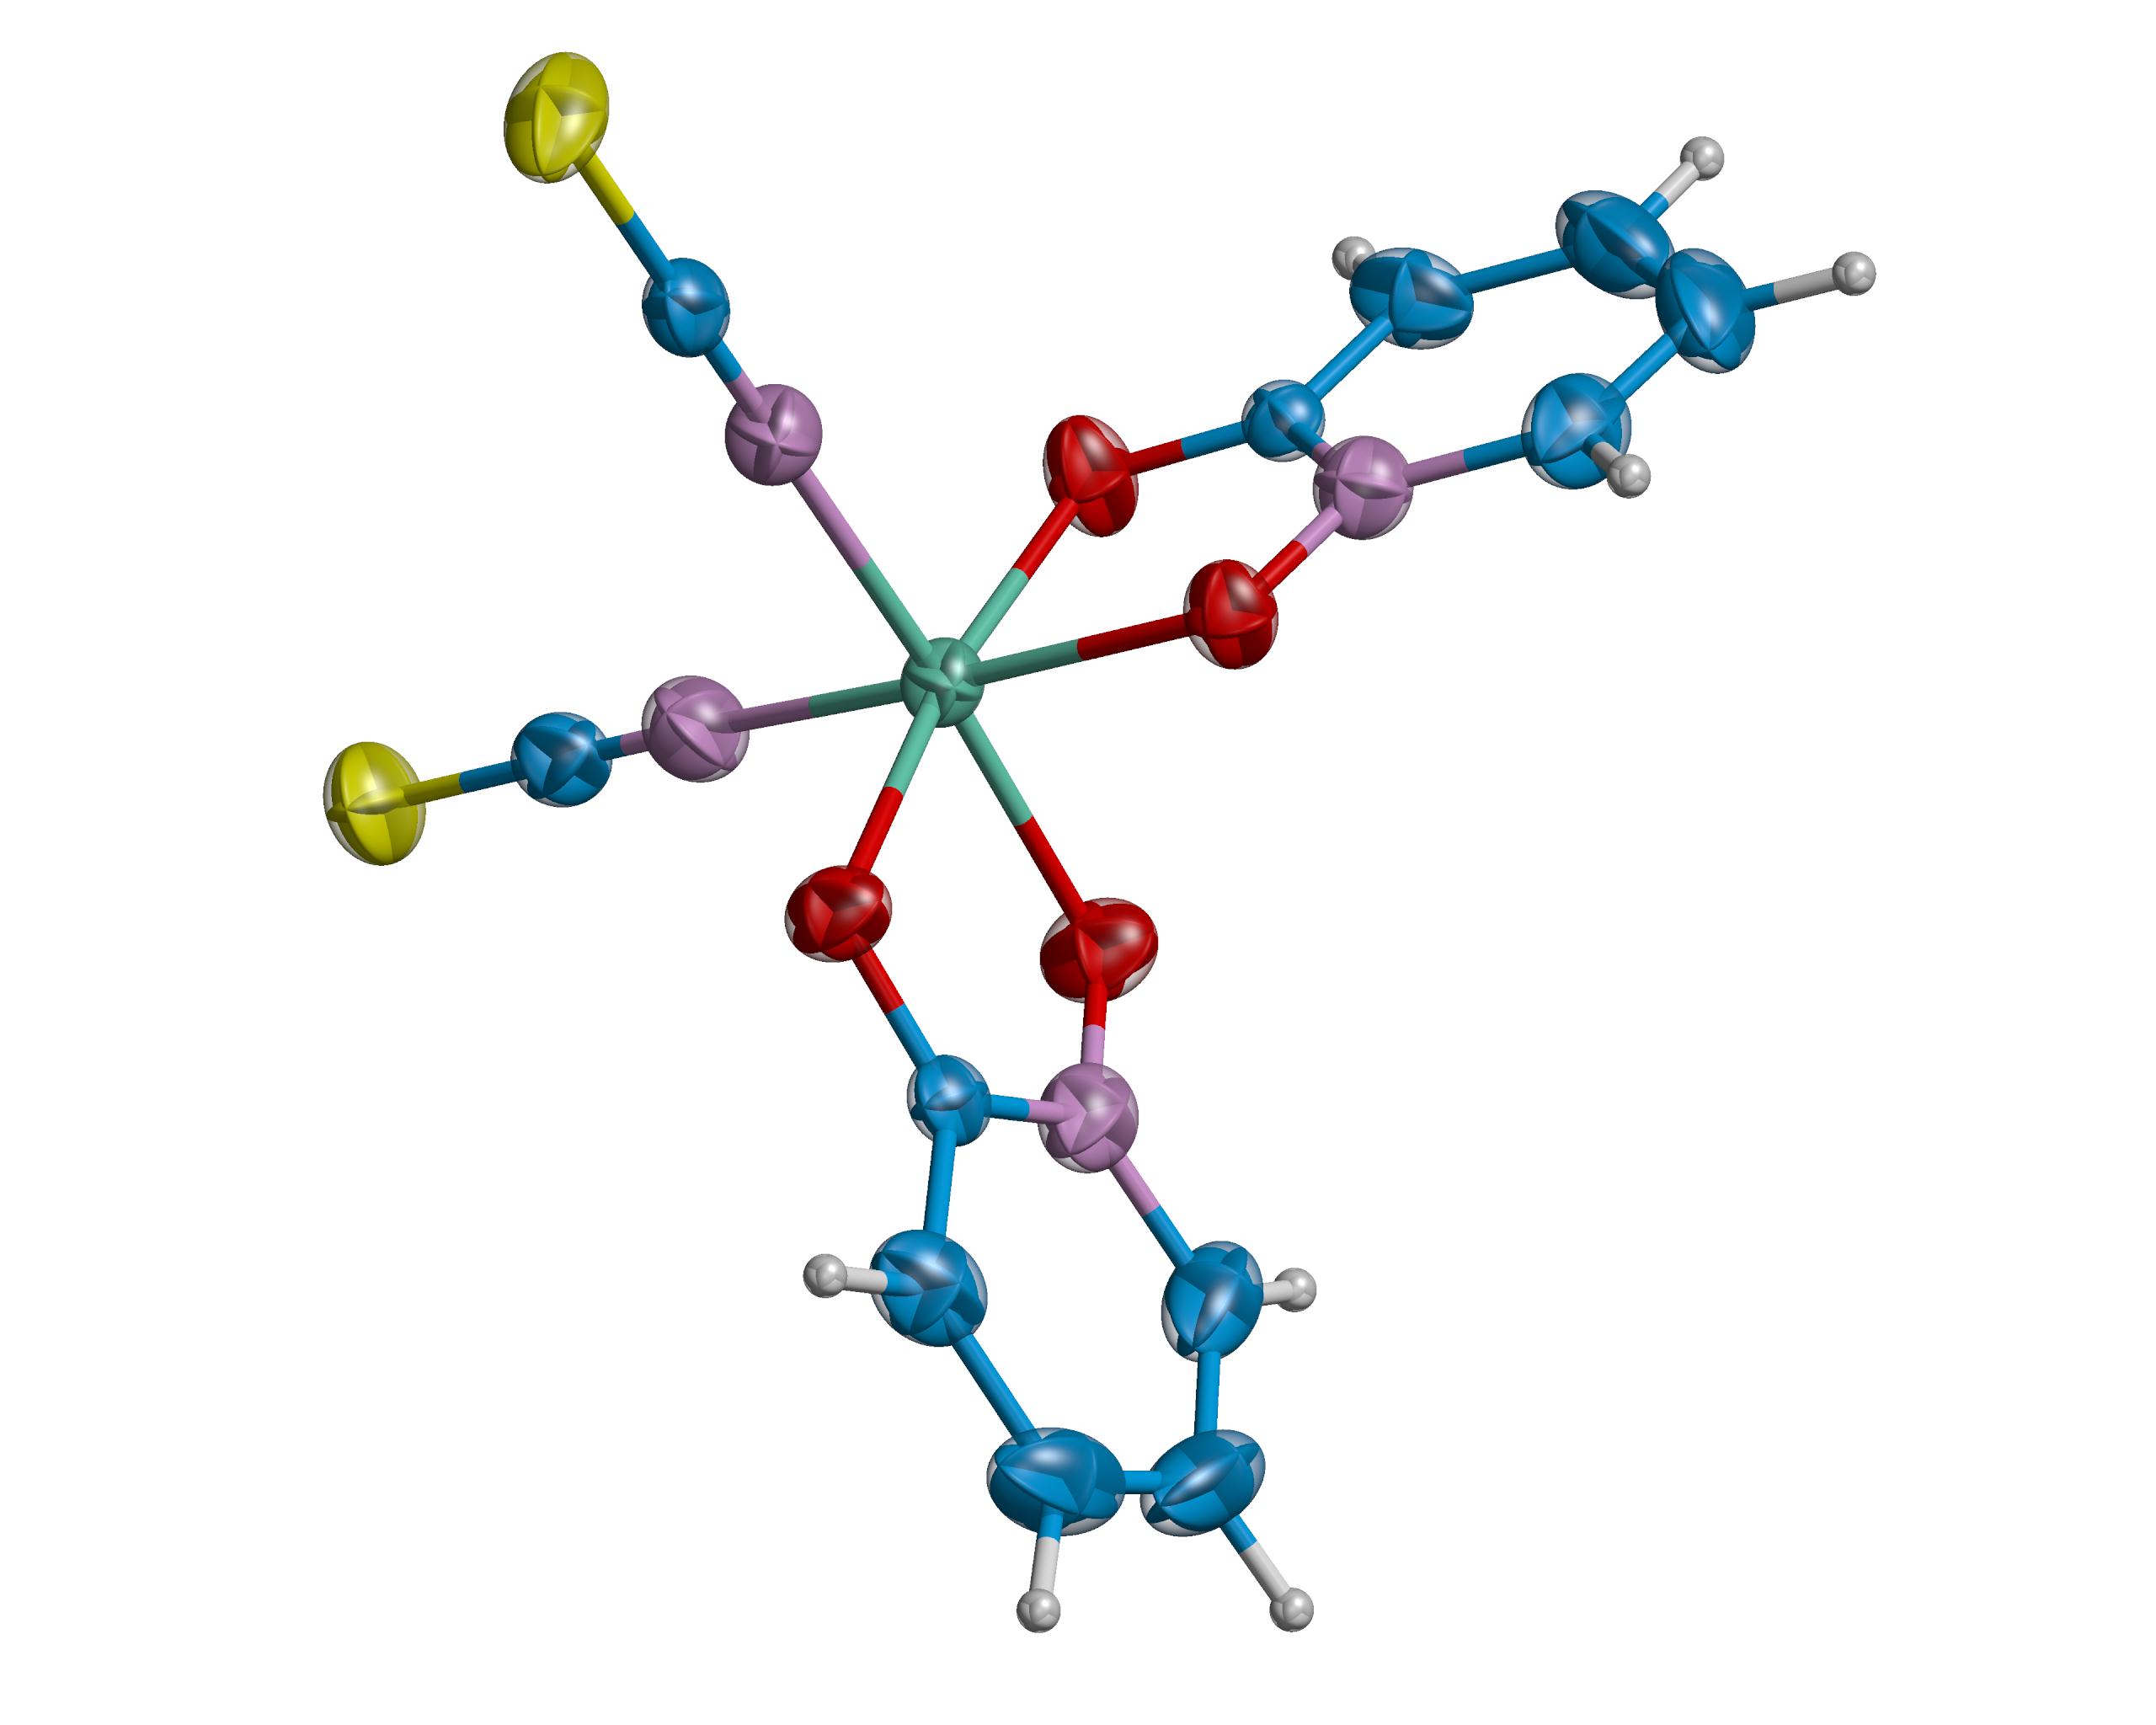 |
| Figure 3a: Ortep [19] plot rendered by RASTER 3D [20] excluding the NH4+ and H2O solvates. Thermal ellipsoids are drawn at 95% probability. |
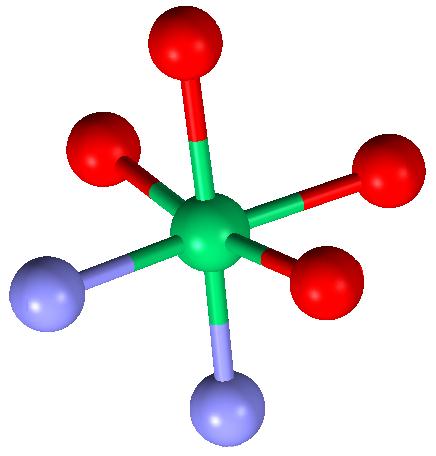 |
| Figure 3b: Distorted octahedral coordination of the Ni atom (green) by 2 N atoms (blue) and 4 O atoms (red) drawn with MERCURY [39]. |
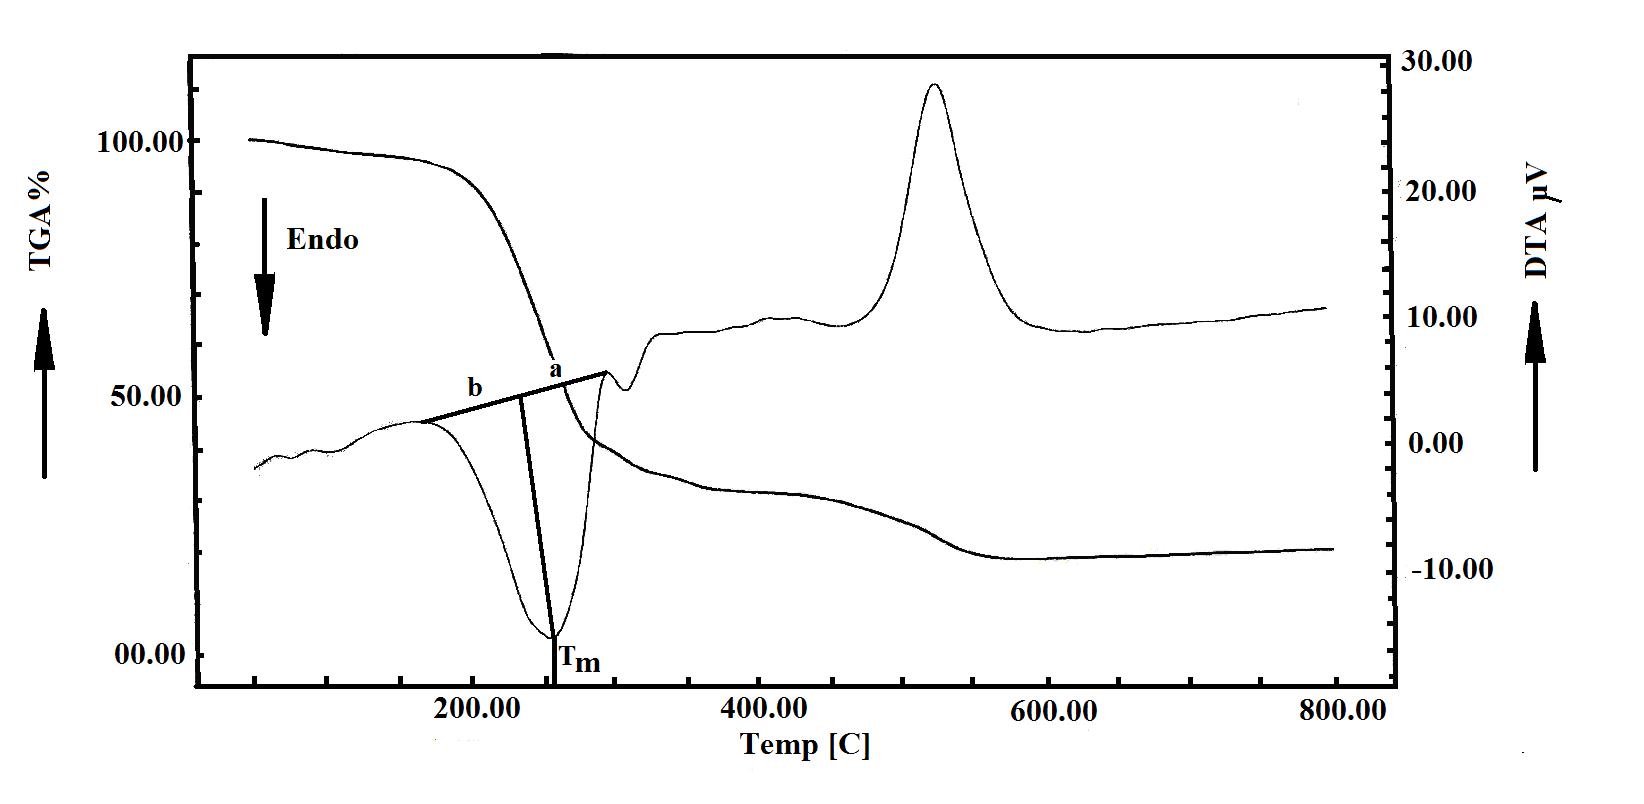 |
| Figure 4: TGA and DTA curves of [NiL2(SCN)2].(NH4)2 2H2O. The a and b parameters used in the calculation of the asymmetry As of an endotherm trough on the DTA curve are indicated. The asymmetry of an exotherm peak can be derived using a comparable method. |
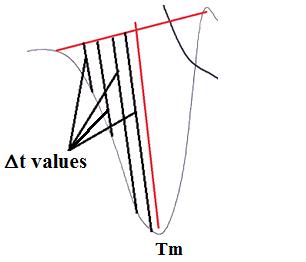 |
| Figure 5: Measurements of Δt values made on the DTA curve corresponding to different temperatures. |
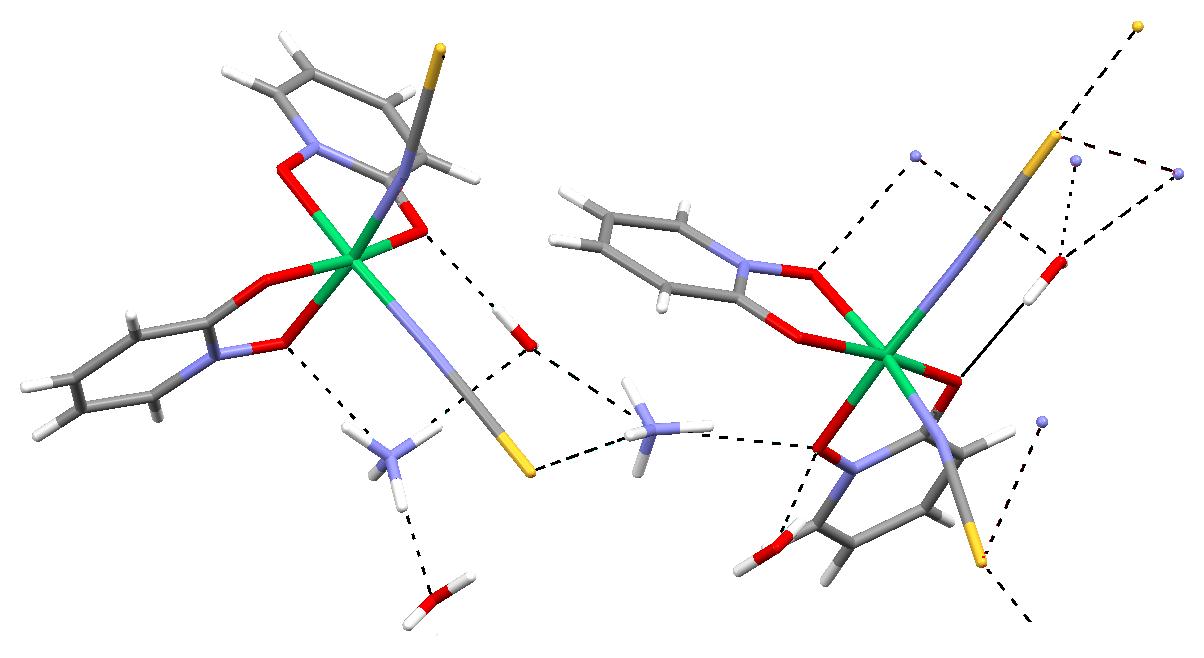 |
| Figure 6: Selected H-bonds in the crystal structure. Drawn with MERCURY [39]. See also Table 4. |


