Open Access
Research Article
Max Screen >>
ISSN: 2348-9804
Copyright: © 2021 Ariff S. This is an open-access article distributed under the terms of the Creative Commons Attribution License, which permits unrestricted use, distribution, and reproduction in any medium, provided the original author and source are credited.
Related article at Pubmed, Google Scholar
This investigation studies the potential use of infrared (IR) sensing technology to answer key questions of scalding. In particular, scalding incidents are frequently plagued by conflicting recollections, uncertain details, and litigation. Questions often relate to how a scalding spill occurred, how hot the liquid was, the direction of liquid flow, and the connection between burn patterns and spill patterns. Flow patterns, among others are sometimes, challenging to determine after a spill incident. Nevertheless, IR technology can be used for event reconstruction and can help identify the typical burn patterns that result from spills. Here, IR imaging is applied to common scald situations. The IR imaging provides temperature information that is continuous in both space and time and can be used with currently available burn models to predict burn depths and patterns. The IR images are used to generate a burn-depth map superimposed on the patient’s body. This study shows that IR imaging leads to reproducible results that can be used to predict burn-depth patterns based on situation specific spills.
Keywords:Burn; Scald; Burn Patterns; Accidental Spill; Intentional Scalding
Over the past nearly 100 years, there have been numerous studies that relate burn depth to exposure temperature and duration (the exposure duration between the heated liquid and tissue). Among the pioneering works include a series of studies that applied known temperature water flow to human and porcine skin [1-5]. In [1], the physical processes of heat transfer within skin is provided and surface heat fluxes are related to skin temperatures. In [2], heated water was applied to porcine and human skin and the resulting physiologic response (burn extent) was recorded. Next, a temperature-time relationship was provided for complete necrosis of the epidermal layer. The temperature-time information provided by [2] is still commonly used today. Study [3] discussed the physiology of burn injuries and their classification. In [4-5], a method was developed to classify the extent of burn injuries using a rate-reaction model. That rate-reaction model is still commonly employed today.
The resulting burns were evaluated and burn injury criteria were developed from those evaluations. Later, other researchers performed similar studies that related exposure temperature and time with somewhat different burn injury parameters [6-14] but in general, the results were similar. In [6,8], microscopic observation of living tissue was undertaken for samples exposed to various thermal exposures. Temperatures and exposure times associated with thermal injury and microcirculation damage were quantified. In [7,9,10], modifications to the injury model set forth in [5] are provided. While those modifications show some improvement in limited situations, the values quantified in [5] are still the most commonly used injury parameters, particularly for burn injuries caused by hot liquids. Study [12] used modern computational techniques to test the accuracy of the burn injury parameters from [5] and provided a motivation for the use of simulation in burn injury studies. Study [13] was similar to the above referenced manuscripts however, it developed burn criterion when skin is exposed to a hot flame. Lastly, [14] provided a comprehensive assessment of injury parameters for various tissue types, and animals. In fact, [14] is, in our opinion, the most complete repository for such information.
Using the above referenced burn-injury parameters, it became possible to perform predictive calculations of burn depth, provided the exposure temperature and duration is known. This information, however, is frequently unknown, particularly for accidental spills. It is, however, possible to use burn depths to determine, a posteriori, spill temperatures, at least in some situations. For instance, when hot water is sprayed or spilled upon a skin surface, a temperature-duration-burn depth relationship is obtained. Using either empirical relationships or numerical simulation, it is possible for researchers to perform case-specific determinations for the unknown quantity (amongst temperature, time, and burn depth), provided the other two parameters are known [15-32]. In [15], a description of an accurate finite element analysis model is provided. In [16], a combination of experiments and simulations were described. The experiments dealt with temperatures in various beverage containers after they were filled with hot liquid and then left to cool. In addition, experiments were performed to measure the temperature of a skin surface after a spill had occurred. Then, with this information available, burn depths were calculated. It appears that [16] was the first study of burn depths associated with beverage spills of various volumes and temperatures. Studies [17,18] discuss the application of computational methods for predicting skin temperatures and subsequent burn injuries. The methods of [17,18] are still relevant today for modern day computations.
Abraham JP [19] was, to our best knowledge, the first study that looked at the burn extent caused by hot metallic surfaces with boiling. In that study, the contact between skin and the hot surface was very short, however, the temperatures of the metal surfaces was sufficiently hot to cause intra-tissue boiling.
Torvi and Dale [20] developed a numerical model that was capable of calculating temperatures within skin when the skin is exposed to high temperature radiant heat. The source of heat in this study was a fire.
Both [21] and [22] provide numerical simulations to estimate temperatures within tissue following a spill and relate the intra-tissue temperature to the burn depth. These studies were important because typically only surface temperatures are measured and used for burn estimation.
The review article [23] provides a comprehensive summary of the science of burn modeling, including physiological processes, blood flow, intra-tissue temperatures and burn depth. Not only does [23] provide foundational knowledge, but it also discusses practical applications of burn injury modeling.
More recent developments using numerical modeling are provided by [24-28] with a number of these papers from the researchers Nh and Chua. There, parametric variations were applied using a numerical model and the impact on burn depth.
A series of studies by the present authors [29-31] were intended to archive burn injury situations and to compare the predictions from numerical simulation with literature observations of burn depth. Last in this group is [32] which is a more recently developed numerical approach that can be used for burn situations that involve high flux radiant heat flow.
Importantly, some research has elucidated the timewise temperature decrease of a spill (both during the spilling process as well as afterwards) [16,30]. These studies, while important, do not convey spill pattern information. That is, they relate temperature, duration, and burn depth but they do not report on the geometrical pattern of the flowing liquid and consequent burns. Burn pattern knowledge is important is assessing how burns occurred and whether they were accidental or intentional.
Another body of research has focused generalized on burn patterns (but not on temperatures or burn depths). For example, [33] discussed the appearance of clearly demarked borders from burns wherein victims are forcibly submerged under hot liquid. Unfortunately, [33] misapplied the burn criteria from [1-5], a common error that has discussed in [34,35]. In a more recent study, [36] reviewed the available literature and recommended a systematic approach for medical investigations regarding burn patterns. It is noteworthy that in [36], a correct use of the Henriques-Moritz data is provided.
Reference [37] studied body locations that are typically more representative of intentional and unintentional injuries. They report that burns with clearly defined borders, burns that are confined to the buttocks and upper legs (front and back), burns with “zebra striping” or a “doughnut hole” burn wherein the center of the buttocks is spared but the surrounding tissue is damaged, are potential indicators of intentional scalding. Burns higher on the body, including the chest, head and face are atypical for intentional burns.
Case studies were presented in [38] with representative examples of burn injuries. That studied showed situations wherein accidental burns can have the appearance of intentional injuries. The authors also noted that proper caregiver education and plumbing maintenance can reduce accidental burn injuries, particularly in children. In some instances, burn injuries can be confused with other medical afflictions, as noted by [39]. There, a number of burn-mimicking diseases are provided so that readers can be made more aware of misdiagnosis.
The purpose of the present paper is not to differentiate accidental from purposeful injuries. On the other hand, the abuse-literature at least has discussed typical burn patterns that are more likely to arise when the injuries are purposeful. Very little information is available on burn patterns that occur under accidental conditions, for example, with spills of hot liquid. The one relevant study that was found on accidental spill patterns was [40]. In that study, dyed liquid was thrown at a subject who was wearing white clothing. The resulting color patterns provided insights about the impact location on the victim’s body. A benefit of this study is that the dyed pattern provided an archive of the water impact. This method, however, is unable to distinguish temperatures on the victim’s clothing and skin. In particular, no information was available about the spatial distribution in temperatures or in the timewise temperature changes. Such information is necessary to predict the depth of burns and is of critical importance for burn pattern prediction.
For the present study, IR technology will be used to determine not only the patterns of liquid flow, but also the variation of temperatures within the spill zone and the decrease in temperature over time. This information will be combined with already existing burn-injury models to predict the patterns of burns and their depths. In this study, common and typical accidental spills will be considered and generalizations will be formed based on the resulting imaging. It will be shown that IR imaging can be used to provide case-specific burn pattern information for an incident.
The present investigation couples experimental measurements of surface temperatures and flow patterns with previously published burn injury calculation methods. In the study, the following spill situations were considered:
Scenario 1 – Hot liquid (12 oz, 355 ml) spilled directly onto the lap of an adult male Scenario 2 – Hot liquid (12 oz, 355 ml) spilled directly onto the lap of an adolescent Scenario 3 – Hot liquid (12 oz, 355 ml) spilled directly onto the chest of an adult male Scenario 4 – Hot liquid (12 oz, 355 ml) spilled directly onto the chest of an adolescent
For each scenario, the duration of the spill (the time required for all liquid to leave the cup), was approximately 1 second. Also, each experiment used a 12 ounce (355 ml) receptacle and each scenario utilized a single layer of thin cotton clothing.
The liquid was heated in a high-quality isothermal water heater and the temperatures were verified using OMEGA HH801B sensor with type E thin-gauge thermocouples (accuracy +/- 1 oC). It was found that the temperature of the hot water bath was uniform and within 1 oC of the thermocouple measurements.
Great care was taken to ensure that the spills were sufficiently cool so that there was no possibility of injury to the subjects. Not only were multiple temperature measurements made with individually calibrated temperature sensors, but also the temperatures were well below the values that would lead to injury. Furthermore, the temperature recordings were made with well mixed liquids so that no thermal stratification had occurred. This is important because natural convection will occur in liquids such that the upper layers of liquid are warmer than lower layers. Consequently, temperatures made, for instance, in the bottom layers, will likely be an underestimate of the true average.
Additionally, as will be shown later in this paper, the initial low temperature spill images (40-50 oC) are converted to a dimensionless format. These dimensionless temperatures are then utilized to estimate the spill temperatures when the liquid is in the range of 80-100 oC. Such an extrapolation was necessary to ensure the safety of the participants.
Infrared imaging was taken using a FLIR ONE IR camera and before the above-referenced scenarios were studied, the accuracy of the IR camera was compared with temperature measurements made with thin-gauge thermocouples. It was found that the temperatures measured by the IR camera were always within ~ 1 oC of measurements made by thermocouples (most often within 0.5 oC). Calibration measurements were made of temperatures in the cup before the spill occurred as well as temperatures on the surface after the spill occurred. The thermocouples/IR camera temperature recordings were consistently in good agreement with each other.
The choice of a thin single layer of cotton was motivated by the desire to minimize the temperature difference across the clothing. In fact, for thick clothing, there can be a significant temperature difference between the outer surface of the clothing and the surface of the skin. The IR camera measures surface temperatures (temperatures of the outer surface of the cloth) while thermocouples can be placed at the skin-clothing interface. A test was performed to relate the cloth temperature to the skin surface temperature – it was found that they were in excellent agreement (less than 1 oC). Consequently, IR camera-obtained temperatures of the clothing following a spill can be used as the skin-surface temperature, at least with a thin layer of porous clothing.
For each of the above-referenced scenarios, replicate experiments were performed to ensure that both the patterns and temperatures are consistent. To demonstrate the reproducibility of spill patterns, the following images are prepared.
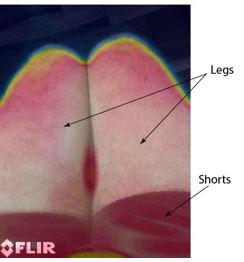
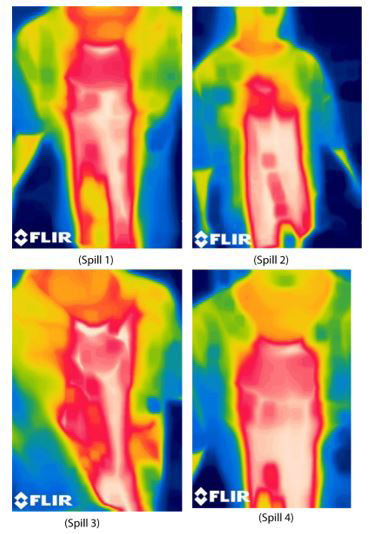
In Figure 1, a photograph of the subject’s legs is shown with a semi-transparent overlay of temperature contours (temperature scales are not included in this image because the purpose of this study is to demonstrate the reproducibility of spill patterns). Next, Figure 2 shows the resulting IR images immediately after a spill of ~ 12 oz (355 ml) onto the subject’s legs. The four images of Figure 2 utilized different liquid temperatures that ranged between 40-50 oC, revealing that the IR patterns were not dependent upon the temperature of the liquid. Based on Figure 2, it is apparent that there are strong similarities between spills, regardless of the spill temperature. From this observation, it is seen that any one figure is representative of the others – consequently, discussions will be based on representative IR images.
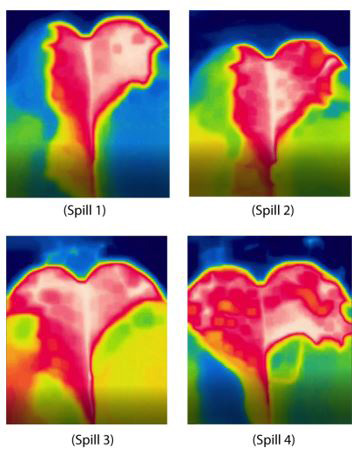
To continue the exploration on reproducibility of water patterns, the following images (Figures 3 and 4) were prepared. For these images, the spills were performed on the chest of a subject; the subject was wearing a thin cotton shirt (similar to that discussed earlier) to ensure a very small temperature difference between the exterior of the shirt and the skin-shirt interface. Each of these spills used approximately 12 oz (355 ml) of liquid. The four parts of the figure correspond to just before the spill, and then 1, 5 and 10 seconds after the spill. In these figures, it is first noticed that very quickly following the spill incident, the liquid pattern reaches a slowly changing state. In fact, even 10 seconds and longer after the spill reveal only very slight changes in the temperature patterns.
Next, replicate experiments were performed to assess the repeatability of chest spills. The results are shown in Figure 4. There, four different spills were performed, again on the investigator’s chest, and with similar liquid volumes and temperatures. It is noteworthy that while slight differences exist between the spills, there is great similarity amongst the patterns. This observation means that representative images can be chosen for study provided that a particular spill scenario is amenable to representative images. While we have shown the repeatability for two spill scenarios (liquid onto unclothed legs of a seated person and spills onto the clothed chest of a standing person); similar repeatability tests for the other scenarios provided similar outcomes. Those other repeatability experiments will not be shown here, for brevity’s sake.
Later in this paper, thermal imaging will be provided for representative images of the four mentioned scenarios with the understanding that the representative images are sufficiently similar to other spill occurrences to warrant their use.
With the reproducibility of the IR images now demonstrated, attention is turned to the results of the investigation.
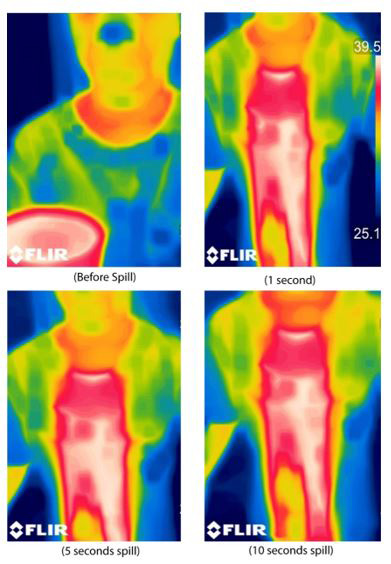
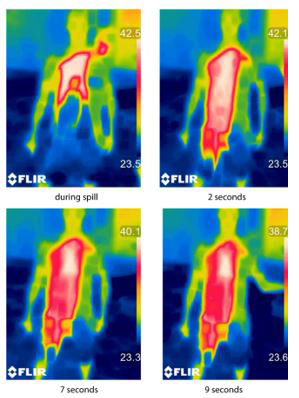
Spills patterns on the lap of a seated subject: The first set of results to be displayed correspond to spills on the lap of a seated individual. In the following, a series of IR photographs will provided that qualitatively display the patterns of spilled temperatures. In the first image (Figure 5), a series of four photographs is provided. The first photograph is an IR image of a seated adult male (wearing shorts with no other leg coverings). The second image is taken during the spill and the IR image shows the hot liquid that has pooled upon the lap of the subject, with some remnant hot liquid still flowing downwards from the receptacle. The third and fourth images were taken some time after the spill, as annotated. It should be noted that the color scale for each image is different, in fact, the upper and lower bounds of the color scale are dictated by the minimum and maximum temperatures in the image.
For all images, the emissivity was set to 0.9 which is representative of clothing, skin, and water. IR temperatures obtained using this emissivity setting were verified against thermocouple measurements and found to be in excellent agreement.
For the seated-lap situation, the liquid tends to pool and gravitational flow is limited. Also, in this experiment (and in the other images presented in this manuscript), the subject was directed to remain stationary. Of course, in an actual situation, the victim may move following a spilling incident which can change the temperature patterns.
It is noteworthy that the hot zone is confined to a region of the upper legs, and the most elevated temperatures do not extend far from the initial spill incident. Similar results are obtained when the subject is an adolescent, as shown in Figure 6. Again, a series of images is provided that show before, during and after-spill temperatures. There is some flow that occurs, causing water to intrude into the space between the subject’s legs A comparison of Figures 5 and 6 reveal great similarities in the spill patterns, regardless of age/size of the subject.
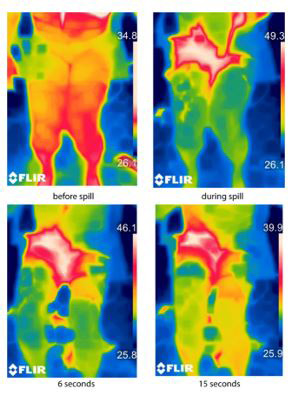
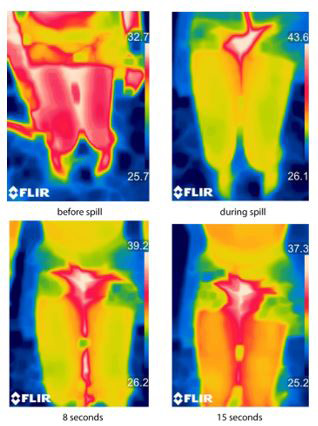
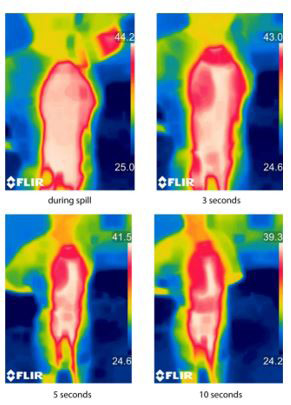
Spills patterns on the chest of a standing subject: Another common area of spills is the chest. While this is particularly common amongst children it can also occur with adults. The scenario that often leads to child chest scalds is the “pull-down” situation wherein a subject pulls a receptacle of hot liquid off of a horizontal surface and the liquid impacts their chest. These “pull down” burns are common with children who reach up to surfaces that they cannot see. In Figures 7 and 8, a series of IR images is provided for both an adult and an adolescent. It is seen that for both ages, a broad width of elevated temperatures emanates from the impact location and extends downwards towards the subject’s waist.
To provide some insight about the reproducibility of the temperature patterns, Figure 9 is presented. In the figure, seven IR temperatures are shown, from seven different spills, on both adolescent and adult chests. As evident from the figure, there is a great deal of similarity between the images, so that any one image can be considered a representative of the others.
A similar level of reproducibility was observed with other spill scenarios (onto the legs or lap of a subject, for example). Duplicative images for those other scenarios are not shown, but the IR patterns obtained from one spill incident are similar to the patterns of other similar spill incidents.
With the qualitative pattern of temperatures now disclosed, it is time to turn attention to the burn depths associated with the different spill scenarios and the development of burn-depth maps. The technique that will be used to connect temperatures and burn depth was presented in [16] and the same approach will be used here. One issue to acknowledge is that the spill temperatures from [16] were far hotter than those of the present study. In fact, the present IR images were obtained with temperatures that were sufficiently low to ensure safety of the participants. But in an actual scald situation, the temperatures would be well above those shown thus far. So, it remains to be shown that the rate of cooling of liquid following a spill is similar, regardless of the initial liquid temperature. To facilitate the comparison of low temperature spills with those of [16], a dimensionless temperature is defined as:

Here, T(t) is the time-varying temperature of the subject, Tsurface is the temperature of the subject prior to the spill, and Tspill is the temperature of the liquid at the time of the spill incident. When recast into this dimensionless format, the results for all cases can be compared with the dimensionless cooling rate from [16]. The universal nature of the temperature decay is evident from the Figure 10 and this temperature decay result can be used to determine the burn depths. As noted earlier, validation measurements, made with thermocouples attached to the subjects’ skin were in very good agreement with IR images of the exterior temperature of the clothing (approximately 1oC temperature difference or less). Based on this observation, the IR-imaged temperatures will be used as a close approximation of the skin temperatures for the purposes of burn-depth estimates.
With the spill patterns and temperatures now available from IR imaging, the next step in the analysis is to relate those temperatures to burn-depth estimates. Here, we use the approach taken in [16].
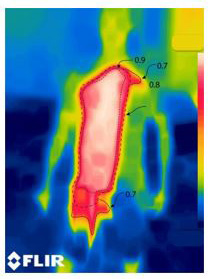
The first set of results that are shown correspond to a spill on the lap of an adolescent. Figure 11 provides the IR image immediately after the spill, with values of g noted in the contours. As evident from the image, there is a large centrally located region with temperatures near the spilled temperature of the liquid (γ~ 1) At locations that are more removed from the impact site, the γ values decrease.
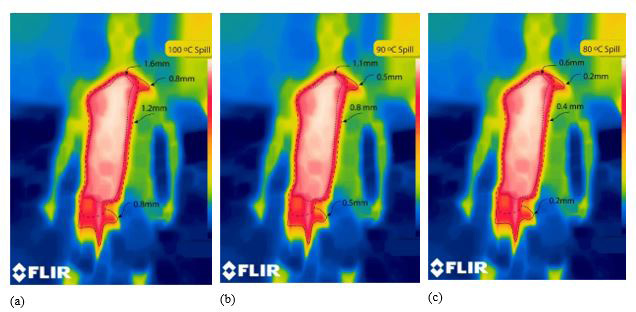
With a map of dimensionless temperatures now available, it is possible to develop a predictive map of burn depths for the situation of Figure 11. Of course, the actual burn depths will depend strongly on the initial temperature of the liquid; this dependence is reflected in the following images (corresponding to initial spills of 100 oC, 90 oC, and 80 oC). These temperatures were selected because they represent common scald temperatures, particularly from hot-liquid spills. Injurious burns can occur at temperatures below these values, however such spills are not shown for sake of brevity. In Figure 12, the annotations in the figures indicate the iso-burn-depth contours, expressed in mm. Briefly, deep burns occur in a centralized region at the location of spill impact. There is also a peninsula of burn the extends downwards (from the groin toward the knees of the subject) that experiences high temperatures because of the flow of liquid to the crease between the subject’s legs.
Next, results for a spill upon an adolescent’s chest are provided. First, a contour image of the dimensionless temperature, immediately after the spill, is provided (Figure 13). In the following image (Figure 14), the burn depth isolines are shown for three different spill temperatures.
From the figures, the downwards flow of hot liquid because of gravity extends the high-temperature zone from the spill location down to the bottom of the subject’s shirt, thus resulting in an elongated isothermal region which would correspond to a uniform burn depth.
To complete the investigation, similar analysis is carried out for an adult male. In particular, chest and lap spills were recorded and the burn-depth maps are provided. Figures 15 and 16 relate to a lap spill while Figures 17 and 18 are for a chest spill. As before, the first image provides dimensionless temperature results following the spill and the subsequent image shows iso-depth burn contours for three different liquid temperatures.
With respect to the adult lap spill, as expected the hot liquid is confined to the impact location atop the subject’s thighs. There is some gravitational flow that brings hot liquid to the spacing between the legs, so some scalding is expected there (similar to spills on an adolescent lap).
For chest spills, as seen earlier for adolescents, gravitation carries the hot liquid downwards and leads to an elongated hot region and subsequent uniform burn pattern.
Similar burn-depth maps can be prepared for the other spill experiments. On the other hand, because of the high degree of reproducibility from one spill to another, only the already-displayed representative images will be provided. Other IR images give similar results.
From the IR images provided above, it is possible to articulate a generalized description of burn patterns, at least for the spills studied in this paper. First, spill patterns are highly dependent on the location of the spill (lap/legs/chest for example). The similarities held between adult and adolescent subjects. In general, spills to the upper chest of a subject result in a downwards and identifiable gravity flow. Consequently, for chest spills there is a somewhat uniform temperature region wherein the burn depths can be expected to be uniform. At the perimeter of the spill zone, there is a rapid transition from partial thickness burns (burn depths greater than ~ 0.1 mm) and superficial (1st degree) burns. The thin superficial burn region circumscribes the deeper burn zones.
For spills onto a lap, some asymmetry is seen. That is, the burn was more severe on the thigh that was more directly impacted by the liquid. Very soon after the spill, liquid tends to flow to the crease formed between the subject’s legs. Consequently, lap-spill-scalds can also occur on the inner thighs.
These observations agree with the personal experience of the author (J.P. Abraham) who has served as a consultant in burn injuries and identifying the causes of burns, based on their patterns.
A number of issues are disclosed in this study. First, it has been shown that infrared cameras have the ability to capture the surface temperature distribution following the spill of a hot liquid. Furthermore, the experiments are reproducible. While clearly, any individual spill would have its unique volume, spill duration, and trajectory, nevertheless for commonly encountered spills such as those in this study, the resulting skin temperature patterns are quite consistent from one spill to another
The measured temperature patterns were used to determine the expected burn patterns for spills that occur in a lap or on the chest of a subject. For spills onto a lap, the hot liquid gathers between the legs so that more severe burns can be expected there. For chest spills, there is a clearly evident downward flow pattern with a distinct border at the top of the spill and a scalloped burn border at the bottom.
The temperature measurements were also used to quantify the rate of cooling of skin surface following a burn incident. The timewise temperature decrease is very consistent from one spill to another and also excellently match previously published findings from [16].
Finally, the use of dimensionless temperatures allows the IR image patterns to be extrapolated to other temperatures. Consequently, experiments performed at warm but safe temperatures can be used to predict burn patterns at much higher temperatures.
In this study, infrared imaging technology was used to provide useful information about temperatures and burn depths following a spill incident with heated liquid. The IR imaging provided reproducible temperature patterns upon the subject and those images were used to project burn depths.
In addition to being highly reproducible, the IR sensor provided temperature results that were very close to thin-gauge thermocouples that were adhered to the subjects’ skin (between a thin cotton layer of clothing and the skin). The excellent agreement between the IR images and the thermocouples justified the use of IR imaging.
Based on the imaging, burn-depth maps can be created and incident-specific investigations can be performed. Clearly, the entire universe of possible spills were not investigated in this report, the scope was limited to a few common situations. But the usefulness of IR images for case-specific situations has been demonstrated. We recommend that IR imaging be used in burn and scald studies, particularly if there is any question about the genesis of the burn injury.
None of the authors have received any funding for this study. Author J.P. Abraham has served as an expert witness in past burn-injury litigations.
No medical records were used in this study. The IRB process was followed for the inclusion of minors. Temperatures used in the experiments were sufficiently low such that there was no potential for injury. IRB approval was obtained prior to the initiation of the study.

![]()

 |
|
Figure 1: Photograph with overlaid semi-transparent IR image, showing subject’s unclothed legs prior to hot-liquid spills |
 |
|
Figure 2: IR images of seated subject’s unclothed legs following four different spills, showing reproducibility of patterns |
 |
|
Figure 3: Time evolution of a spill pattern, standing subject with a clothed chest, 12 oz (355 ml) of heated liquid |
 |
|
Figure 4: IR images of standing subject’s clothed chest following four different spills, showing reproducibility of patterns |
 |
|
Figure 5: IR images before, during, and after a spill on the lap of an adult male |
 |
|
Figure 6: IR images before, during, and after a spill on the lap of an adolescent |
 |
|
Figure 7: IR images during and after a spill on the chest of an adult |
 |
|
Figure 8: IR images during, and after a spill on the chest of an adolescent |
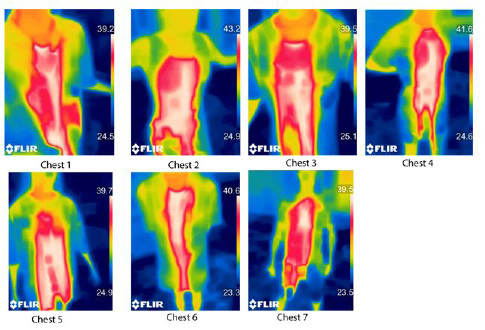 |
Figure 9: IR images of seven different chest spills |
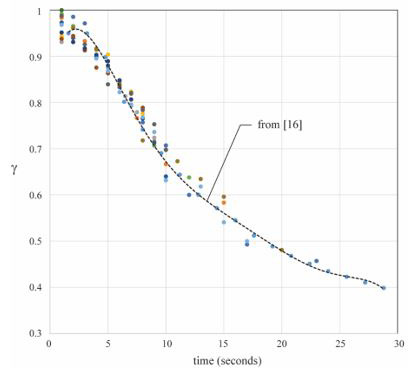 |
Figure 10: Dimensionless cooling rates for spills, datapoints are IR measurements in the current study, dashed line is from [16] |
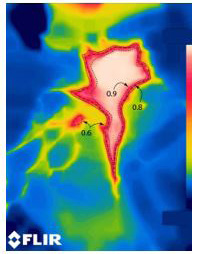 |
Figure 11: Dimensionless temperature map, spill on an adolescent’s lap |
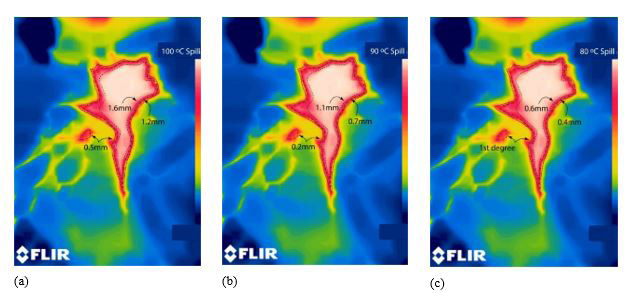 |
Figure 12: Representative maps of burn depths for a spill onto the lap of an adolescent, for spill temperatures of (a) 100 oC, (b) 90 oC, and (c) 80 oC |
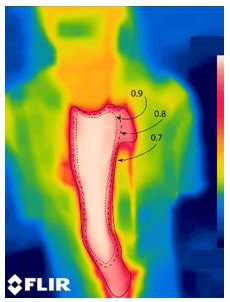 |
Figure 13: Dimensionless temperature map, spill on an adolescent’s chest |
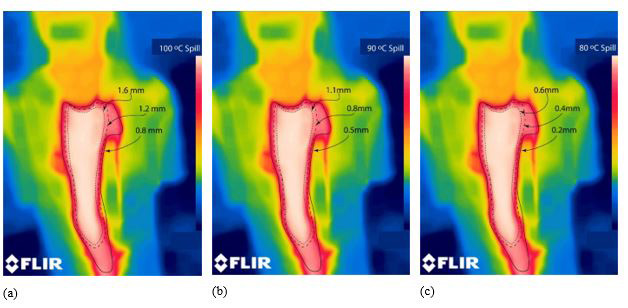 |
Figure 14: Representative map of burn depths for a spill onto the chest of an adolescent, for spill temperatures of (a) 100 oC, (b) 90 oC, and (c) 80 oC |
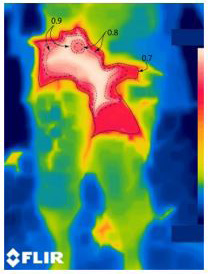 |
Figure 15: Dimensionless temperature map, spill on an adult lap |
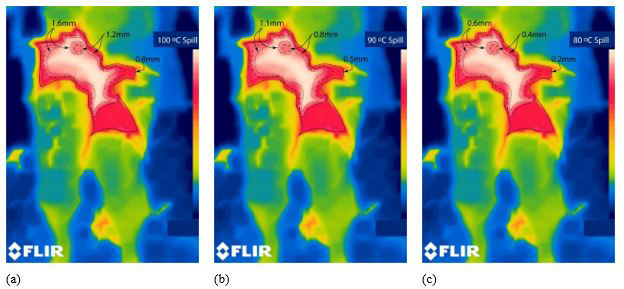 |
Figure 16: Representative map of burn depths for a spill onto the lap of an adult, for spill temperatures of (a) 100 oC, (b) 90 oC, and (c) 80 oC |
|
|
Figure 17: Dimensionless temperature map, spill on an adult chest |
|
|
Figure 18: Representative map of burn depths for a spill onto the chest of an adult, for spill temperatures of (a) 100 oC, (b) 90 oC, and (c) 80 oC |