Open Access
Research Article
Max Screen >>
ISSN: 2348-9804
Copyright: © 2021 Ariff S. This is an open-access article distributed under the terms of the Creative Commons Attribution License, which permits unrestricted use, distribution, and reproduction in any medium, provided the original author and source are credited.
Related article at Pubmed, Google Scholar
Ethyl glucuronide (EtG) and ethyl sulfate (EtS) are markers for screening previous alcohol consumption and indicating recent drinking in cases of suspicion of driving under the influence of alcohol. The aim of the study was to find out the time and value of the formation of alcohol metabolites and clinical signs of alcohol intoxication a short time (up to 2 h) after consuming a certain amount of alcohol. The study involved 49 volunteers (18 male and 31 female) with an average age 41.67 ± 10.61 years. An average of 66.7 ± 44.7 g of pure ethanol was consumed per study subject, i.e. 0.8 ± 0.4 g per kg of body weight. The mean blood alcohol concentration (BAC) value after the first hour was 0.83 ± 0.5 mg/g and after two hours had reduced 0.72 ± 0.55 mg/g. The EtG mean value one hour after drinking alcohol was 0.30 ± 0.22 μg/ml and the EtS level was 0.23 ± 0.17 μg/ml. After the second hour, the EtG value was twice as high as the EtS value (0.61 ± 0.49 μg/ml and 0.30 ± 0.22 μg/ml). From the clinical findings, the highest correlation regarding alcohol intoxication was the presence of nystagmus (93.3%) and balance disturbance in Romberg’s position (87.8%) in the whole group of study participants.
Keywords:Forensic Science; Forensic Pathology; Ethyl Glucuronide; Ethyl Sulfate; Alcohol Intoxication
List of abbreviations: BAC: Blood Alcohol Concentration; EtG: Ethyl Glucuronide; EtS: Ethyl Sulfate; BMI: Body Mass Index; F: Female; M: Male; SD: Standard Deviations
Alcohol consumption is monitored in the context of workplace drug testing, driving under the influence of alcohol, driving licence regranting programmes, alcohol withdrawal treatment, and diagnosis of acute alcohol intoxication or suspected and at-risk pregnancies [1]. In cases of driving under the influence of alcohol, car drivers sometimes claim that they were sober during the accident and used alcohol after the accident happened. The driver’s explanation is often that the drink consumed after the incident was used to calm their nerves. This kind of defence is a well-known problem in forensic toxicology [2-4]. For the indication of recent alcohol intake, specific biomarkers of alcohol consumption, including glucuronide (EtG) and ethyl sulfate (EtS), are used in combination with blood alcohol measurement. The non-oxidative ethanol metabolites EtG and EtS only form in the presence of ethanol. Less than 0.1% of ingested ethanol undergoes a phase II conjugation reaction with uridine 5´-diphosphoglucuronic acid catalysed by uridine diphosphate (UDP)-glucuronosyltransferase to produce EtG [5-7]. Moreover, even less of the ethanol undergoes sulfate conjugation with 3’-phosphoadenosine 5’-phosphosulfate catalysed by sulfotransferase to form EtS [7-9]. Alcohol amounts, depending on the body weight of the participants (0.5-1.0 g/kg ethanol), were consumed in controlled drinking experiments, and EtG and EtS concentrations in blood, urine and saliva were examined [6,10,11]. In the blood, EtG reached its maximum concentration 2.3-5 h after the start of drinking 0.5 g of ethanol per kg of body weight [6,10,11] and 5.5 h after the start of drinking 1.0 g ethanol per kg of body weight [11], which was 2-4.5 h later than for ethanol [6]. The maximum BAC was reached between 0.5-2.0 h [6], between 1.3-2.1 h [10] and 1.5 h [11] after the start of drinking alcohol. In the blood, peak EtS concentration was reached after 2.1-3.9 h after the start of drinking 0.5 g of ethanol per kg of body weight [10]. Differences of times for reaching peak BAC and ethanol metabolite levels were between 0.5-3.5 h for EtG and between 0-2.4 h for EtS [10].
The main aim of the study was to find a relationship between blood alcohol concentration (BAC) and ethyl glucuronide (EtG) and ethyl sulfate (EtS) levels after alcohol consumption with relation to sex, body mass index (BMI) and amount of alcohol consumed. Another aim was to find out the time and value of the formation of alcohol metabolites a short time (up to 2 h) after consuming a certain amount of alcohol. The main difference from other studies was the comparison of alcohol metabolites and ethanol concentration level with clinical signs of alcohol intoxication.
An invitation to participate in the study was published on the homepage of the Estonian Forensic Science Institute and was addressed personally. Forty-nine volunteers participated in the study with a male (M): female (F) ratio of 1:1.72 (M 18, F 31). They all received a study presentation sheet and completed a consent form. The age of study subjects was between 18 and 59 years. The study was performed in five groups with around 10 subjects per group. To participate in the study, it was prohibited to consume alcohol before the study, and exclusion criteria included severe diseases, medication use, pregnancy and breast-feeding. Smoking was not included in the exclusion criteria.
After the study, the subject was monitored for up to four hours after alcohol use. Driving and using mechanised devices was prohibited after the study. The protocol contained data on the subject’s age, sex, body mass and height. The subject’s name was not used in the protocol; their protocol number referred to the subject.
There was a separate protocol for determination of clinical signs of intoxication. The subject’s distinctive behaviour (normal, aggressive, euphoric, animated, indolent or not evaluable) and state of consciousness (clear, disoriented, euphoric, somnolent or vacant), presence of memory disorders (memory remains, partial, absent, does not say) were noted. Of vegetative reactions, pulse, blood pressure, skin colour (pale, normal or flushed), sweating (present or not) and chills (present or not) were recorded. In addition, the presence of eye redness, pupil size (usual, dilated, constricted or different) and reaction to light (normal, slow or absent), nystagmus (not present, horizontal, vertical, mixed- type). Also articulation (clear, slow, fast, muddled, incomprehensible), balance (Romberg’s position, heel-toe walk, finger-nose test and more exact movements) impaired or not and tremor (in fingers, eyelids, tongue or absent) were noted in the protocol.
The first blood sample was taken before alcohol use to exclude the effect of possible prior alcohol use on the results. For up to one hour, individually suitable alcohol (beer, wine or spirits such as vodka, brandy, liqueur or whiskey) was consumed and the strength and amount consumed were noted in the protocol. Some subjects consumed two types of alcohol. The second blood sample was taken one hour after the end of alcohol use and clinical signs of intoxication were noted. The third blood sample was taken two hours after the end of alcohol use and the clinical signs of intoxication were noted. As venous blood was collected three times, a venous cannula was inserted to reduce the pain associated with blood sampling. The tubes were marked with the protocol number and blood sample number, and the blood sampling date and time were added. Transport of samples to the lab took place immediately. If this was not possible, the deep-frozen samples were sent for analysis to the laboratory of the Forensic Chemistry Department of the Estonian Forensic Science Institute. The samples were kept in deep-freeze at -20 oC until analysis.
The sample preparation from whole blood includes protein precipitation with acetonitrile and phospholipid removal with PhreeTM Phospholipid Removal tubes. Urine preparation includes sample dilution (1:10) with LC mobile phase, including internal standards. EtG-d5 and EtS-d5 were used as internal standards. Measurement of EtG and EtS is carried out by liquid chromatography tandem mass spectrometry (Agilent 1260 Infinity, Agilent 6410 QQQ), electrospray ionization (ESI) in negative mode. Column: Agilent Zorbax Eclipse Plus C18 2.1 x 100 mm, 1.8 μm. Mobile phase: 95%A/5%B 0.4 ml/min 40 oC; A: 0.1% formic acid, B: acetonitrile. The transitions were selected as follows: m/z 221.1/85, 221.1/75 and 221.1/57 for EtG; m/z 226.1/85, 226.1/75 for EtG-d5; m/z 125/97, 125/75 for EtS; m/z 130.1/98.1, 130.1/79.9 for EtS-d5. The uncertainties of measurement (k = 2) are: EtG and EtS in blood 20% and in urine 25%. The measurement of ethanol was carried out by a headspace gas chromatograph (Perkin Elmer Auto System XL) with a flame ionization detector, using two columns simultaneously with two detectors. Columns: Elite BAC - 1.10 m, 0.18 mm, 1.00 μm and Elite BAC - 2.10 m, 0.18 mm, 0.63 μm. N-propanol was used as an internal standard. Uncertainties of measurement (k = 2) are: in the range of 0.2-1.5 mg/g 0.05 mg/g and in the range of 1.5-2.5 mg/g 0.06 mg/g. The new methods for EtG and EtS level determination in the forensic laboratory were worked out and validated.
The collected data were analysed with the program Statistica (version 13.0). The data were presented as mean values with standard deviations (SD), percentages, frequency and breakdown tables of descriptive statistics. Variables are not normally distributed; therefore, we used nonparametric statistics. The Kolmogorov-Smirnov test was used to compare two samples. Kruskal-Wallis tests were used to compare the four BAC groups. Spearman’s rank order correlation coefficient (rs) was used to assess correlations between variables. In this study, p-values 0.05 were considered to indicate statistical significance.
The study was approved by the Research Ethics Committee of the University of Tartu No. 275T-3. The procedures were followed in accordance with the Helsinki Declaration of 1975, as revised in 1983.
Forty-nine volunteers (average age 41.67 ± 10.61 years) participated in the study, of whom 18 were male (average age 41 ± 8.47 years) and 31 female (average age 42.06 ± 11.80 years). Baseline ethanol concentration (BAC), EtS and EtG levels had a value of 0.
An average of 66.75 ± 44.75 g of pure ethanol was consumed per study subject, i.e. 0.79 ± 0.42 g per kg of body weight. The amounts consumed by males and females differed statistically significantly: males consumed 101.42 ± 53.63 g and females 46.62 ± 20.83 g, (p = 0.0002). The mean BAC value of the whole study group after the first hour was 0.83 ± 0.5 mg/g, in males 1.15 ± 0.62 mg/g and in females 0.65 ± 0.36 mg/g, (p = 0.025). After two hours, the mean BAC had reduced to 0.72 ± 0.55 mg/g, in males 1.06 ± 0.63 mg/g and in females 0.52 ± 0.38 mg/g, (p = 0.025).
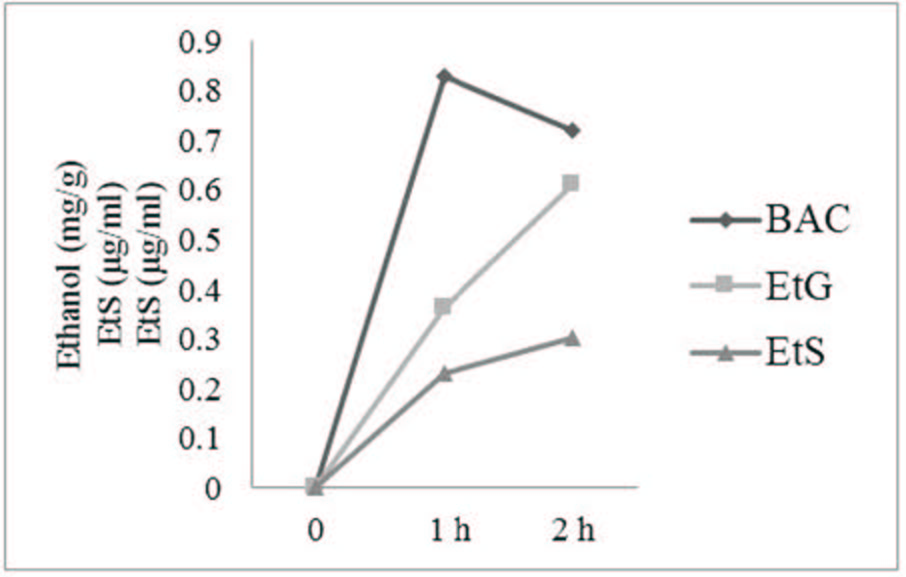
Figure 1 shows a statistically significant and strong positive correlation between the increased values of EtG and EtS for both measurements (after one and two hours) and the amount of pure alcohol consumed (rs = 0.8, p 0.05). The EtG mean value one hour after drinking alcohol was 0.30 ± 0.22 μg/ml and the EtS level after one hour was 0.23 ± 0.17 μg/ml. After the second hour, the EtG value was twice as high as the EtS value (0.61 ± 0.49 μg/ml and 0.30 ± 0.22 μg/ml).
In the study there were two cases (both male) where the BAC increased after two hours. One male had an intoxication level of 2.06 mg/g (pure alcohol amount 1.51 g/kg) and the other 1.35 mg/g (pure alcohol amount 1.25 g/kg). In the same subjects, the values of metabolites increased: in the first subject, after one hour, EtG was 0.75 μg/ml and EtS 0.51 μg/ml and after two hours, EtG was 1.20 μg/ml and EtS was 0.63 μg/ml; in the second subject, after one hour, EtG was 0.28 μg/ml and EtS was 0.22 μg/ml and after two hours, EtG was 0.73 μg/ml and EtS was 0.37 μg/ml.
Looking at the values comparing sex, we observed that metabolite values in males were significantly higher than in females. After one hour, EtS values in males and females differed statistically significantly (p = 0.01), but there was no statistically significant difference in EtG values (Figure 2).
The mean EtG/EtS ratio after one hour was 1.59 ± 0.65 μg/ml, in males 1.55 ± 0.72 μg/ml and in females 1.62 ± 0.61 μg/ml (p = 0.4). The mean EtG after two hours was 0.61 ± 0.49 μg/ml, higher in males 0.86 ± 0.62 μg/ml and lower in females 0.46 ± 0.32 μg/ml (p = 0.02). The EtS values after two hours were 0.30 ± 0.22 μg/ml, 0.43 ± 0.26 μg/ml and 0.22 ± 0.15 μg/ml, respectively (p = 0.006). The mean EtG/EtS ratio after two hours was 2.22 ± 0.87 μg/ml, in males 2.06 ± 0.73 μg/ml and in females 2.32 ± 0.93 μg/ml, and there was no statistically significant difference.
When looking at EtS values over time, we observed that the EtS values in 10 subjects did not increase over time; six females had similar EtS values at the first and second measurement. They had a BAC value of 0.19-0.60 mg/g. At the same time, in four cases (one male and three females), the EtS value was reduced at the second measurement, BAC (0.17-0.49) mg/g.
Females had a relatively weak negative but statistically significant correlation between BMI and the second measurement of BAC/ EtS ratio (rs = -0.4, p = 0.04). In males, a moderately positive but statistically significant correlation between BMI and amount of pure ethanol consumed was observed - subjects with a higher body mass consumed more alcohol (rs = 0.6, p = 0.004).
To compare EtG and EtS values, the subjects were divided into four groups depending on their BAC value (Table 1). No statistically significant difference was found between age, BMI, BAC/EtG and BAC/EtS mean values and different BAC groups (p >0.05). Most of the parameter values presented in the table differ statistically significantly between BAC groups (p 0.05). After two hours, there was no significant difference in EtG values between BAC groups III and IV, but in other BAC groups, the difference was statistically significant. The EtS value increase (Δ EtS) did not show a statistically significant difference between BAC groups II and III; between other BAC groups there was a statistically significant difference. The first EtG/EtS values were statistically significantly different between BAC groups II and III. There were no differences between the other groups. The BAC decrease was statistically significantly different between BAC groups III and I. There were no differences between other groups
In the first group there were 14 subjects, of whom three were male and 11 female, and the mean age was 42.57 ± 12.06 (in males 46.33 and in females 41.55). Male subjects had a mean EtG value of 0.2 μg/ml and an EtS value 0.14 μg/ml. In one male, the EtS value was reduced at the second measurement, while in two cases a small increase occurred. In this group there was a strongly positive and statistically significant correlation between ethanol concentration and EtG (rs 0.7, p = 0.01) and EtS (rs 0.9, p 0.0001) values, i.e. the higher metabolite values were caused by the higher concentration of ethanol. A change in EtG values (difference) (Δ EtG) was associated with ethanol concentration (rs = 0.8, p 0.001) and the correlation was strongly positive and statistically significant. In this group, there was a negative but statistically significant correlation between BMI and the amount of pure ethanol consumed (rs = -0.6, p = 0.04) and BMI and BAC/EtS III ratio (rs = -0.6, p = 0.02).
In this group there were 15 subjects, of whom four were male and 11 female, and the mean age was 43.66 ± 10.14 (in males 43.50 and in females 43.73). No statistically significant associations occurred in EtG values. In the whole group, the change in EtG values (Δ EtG) was positively and statistically significantly correlated with ethanol concentration (rs = 0.5, p 0.04). Age was in relatively strong and statistically significant correlation with EtS results measured both after one and two hours (rs = 0.6, p = 0.02) from alcohol consumption. In BAC group II, a negative but statistically significant correlation between BMI and EtG value was measured after one hour (rs = -0.5, p = 0.04), between BMI and EtG/EtS ratio after one hour (rs = -0.7, p= 0.008) and between BMI and EtG/EtS ratio after two hours (rs = -0.7, p = 0.007). In addition, there was a positive and statistically significant correlation between BMI and BAC/EtG ratio after one hour (rs = 0.6, p = 0.02).
In this group there were 14 subjects, of whose six were male and eight female. The mean age was 39.42 ± 11.12 (in males 36.50 and in females 41.63). We observed that to achieve such BAC, males needed at least 1.16 g/kg and females at least 0.89 g/kg ethanol, which means that females need less ethanol to achieve the same level of intoxication. There was no significant difference in metabolite values between males and females, the mean EtG value in males was 0.56 μg/ml and in females 0.51 μg/ml and the mean EtS value in males was 0.33 μg/ml and in females 0.30 μg/ml. In BAC group III, there was a positive and statistically significant correlation between BMI and amount of pure ethanol consumed. Subjects with a higher body mass consumed more alcohol (rs = 0.7, p = 0.008), between BMI and BAC III (rs = 0.6, p = 0.03), between BMI and BAC/EtG ratio after one hour (rs = 0.5, p = 0.04) and between BMI and Δ EtS (rs = 0.6, p = 0.03). The EtS value was in positive and statistically significant correlation with BAC after the first hour (rs = 0.5, p = 0.04) and after two hours (rs = 0.6, p = 0.03). In males in this group, we observed a strongly negative and statistically significant relationship with age, i.e. the older males had lower EtS values (higher in younger males and lower in older males), both after one hour (rs = -0.9, p 0.001) as well as after two hours (rs = -0.9, p 0.001) from consumption of alcohol.
There were six subjects (mean age 39.83 ± 7.73), of whom five were male (mean age 41.20) and only one 33-year-old female. In the group of males, the EtG value after one hour was 0.93 μg/ml and the EtS value 0.56. μg/ml; after two hours the EtG value was 1.56 μg/ ml and the EtS 0.75 μg/ml. After one hour, the female subject had an EtG value 0.29 μg/ml and an EtS value 0.28 μg/ml (the group’s mean EtG value was 0.83 μg/ml and EtS value 0.51 μg/ml). After two hours, the values were EtG 0.79 μg/ml and EtS 0.47 μg/ml, mean EtG 1.43 μg/ml and EtS 0.7 μg/ml. The median value was 0.75 (two subjects had higher and two lower values). The maximum EtG value after one hour was 1.45 μg/ml and 2.28 μg/ml after two hours. Both after one and two hours, age correlated positively and statistically significantly with EtS (rs = 0.8, p 0.04): EtS values were higher in older males. The amount of pure ethanol in grams was associated with age: the older the males were the greater the amount of ethanol they consumed. BAC was in positive and statistically significant correlation with EtG after one hour (rs = 0.9, p 0.001). EtS had a strong positive and statistically significant correlation with the amount of pure ethanol (rs = 0.9, p 0.001). In BAC group IV, there was a strong negative and statistically significant correlation between BMI and amount of pure ethanol consumed (rs = -0.9, p = 0.004).
One hour after alcohol administration during evaluation of clinical signs, there were noticeable behaviour changes among all subjects. In particular, euphoria was observed in 59.2% (n = 29). The most common findings after one hour were the absence of sweating or chills (n = 49). From the clinical signs of alcohol intoxication, the horizontal nystagmus was the most important finding in 93.9% (n = 46) and balance disturbance, of which 87.8% (n = 42) developed instability in Romberg’s position, 67.3% (n = 33) performed an impaired finger-nose test and 51.0% (n = 25) exhibited impairment during the heel-toe walk. As an additional sign, the presence of flushing in 71.4% of subjects (n = 35) was worth mentioning. In the whole group, two hours after alcohol administration, the most common signs were conjunctival redness in 73.5% (n = 36) and horizontal nystagmus in 77.6% (n = 38). Findings of chills and sweating were the most rare in all groups - sweating occurred one hour after alcohol administration in 12.2% (n = 6) and after two hours in 4.1% (n = 2) of the subjects, and chills did not occur at all. The main clinical findings in the different BAC groups are presented in Table 2.
We performed this study for forensic investigations to prove alcohol consumption by drivers who often claim that they have not consumed alcohol before the accident.
For this reason, we measured EtG and EtS concentrations in blood samples collected from 49 healthy volunteers. The main findings were that the level of metabolites correlated with BAC and there was a significant correlation between EtG and EtS concentrations. This study’s findings were similar to other alcohol and alcohol metabolite studies [11]. Høiseth et al. had shown a strong correlation between initial ethanol concentration on one hand and initial concentrations of EtG or EtS on the other [12]. The mean concentration of BAC decreased two hours after consumption of alcohol in this study, and this was significant in volunteers in BAC group I. The decrease in BAC was statistically significant between BAC groups I and III. There were no differences between other groups. Although the average values of EtG and EtS continued to increase, the EtS values were equal at the first and second measurements or decreased in those who consumed small amounts of alcohol.
However, there could be interindividual differences, as the maximum concentrations of EtG and EtS in the blood revealed wide interindividual variation and at the same time, the metabolite level did not correlate with the blood ethanol level [10]. Earlier studies have also indicated high interindividual variability in EtG and EtS, in urine and serum, even if the dose of alcohol and the time since consumption remained constant [13]. In this study, we found also two cases where ethanol concentration had increased at the second measurement - both were males. One had an intoxication level of 2.06 mg/g (1.51 g/kg) and the other 1.35 mg/g (1.25 g/kg). It was possible that these cases were from metabolism peculiarities or caused by the consumption of different amounts of food during the study.
In accordance with literature data, sex did not have any effect on the concentration–time profiles for both EtG and EtS after 4 or 8 units [14]. In this study, males consumed more alcohol on average; therefore, the metabolite values were significantly higher in males than in females.
Compared to previous studies where participants were between 19-46 years and had body mass index values between 18-29.5 kg/ m2 [6,10], in this study, participants were relatively older with a median age of 43 years (range 18-59) and had bigger body mass index values with a median of 26.0 kg/m2 (range 18.4-46.4). Females had a negative correlation between BMI and the second measurement of BAC/EtS ratio (rs = -0.4, p = 0.04). In males, a positive correlation between BMI and amount of pure ethanol consumed was observed – subjects with a higher body mass consumed more alcohol (rs = 0.6, p = 0.004).
The measurement of alcohol biomarkers is essential, as BAC could be measured during the relatively short time after an accident, and the elevated BAC level at the time of the accident may no longer be detected by conventional BAC measurements [15]. Previous studies indicated that after variable doses of ethanol, EtG first became detectable in serum with a lag time of up to 45 min compared with ethanol concentration.
In this study, the values of EtG and EtS increased for both measurements (after one and two hours) and depended on the amount of pure alcohol consumed.
The maximum EtG concentration showed significant interindividual variations and was reached 3.5-5.5 h after alcohol intake [13,16].
According to literature, the time during which EtG can be detected in serum is up to 8 hours longer compared with ethanol [16], and EtS can be detected in serum for around twice as long as ethanol [10]. This study showed that the EtG mean value one hour after drinking alcohol was 0.30 ± 0.22 μg/ml and the EtS level after one hour was 0.23 ± 0.17 μg/ml. After the second hour, the EtG value was twice as high as the EtS value (0.61 ± 0.49 μg/ml and 0.30 ± 0.22 μg/ml).
Ethyl sulphate (EtS), a direct ethanol metabolite, appears to have potential as a biomarker for recent alcohol consumption [9]. Therefore, it can be used in cases when drivers claim that they consumed alcohol a short time after a traffic accident.
From the clinical findings, the highest correlation regarding alcohol intoxication involved the presence of nystagmus, which was 93.3% of all study participants. In many countries, the limit for drunk driving is a BAC of 0.5 g/kg. Therefore, the study by Karlovšek and Balažic on the association of nystagmus with BAC is important, as the scientists found in their work that nystagmus is a good test to assess alcohol intoxication when BAC is >0.5 g/kg [17], although some cerebellar diseases can give false-positive results [18]. In this study, there was a 100% positive nystagmus finding in BAC groups II and III, where BAC was >0.8 g/kg, but Booker found nystagmus in only 83% of subjects in the absorption phase and 91% of subjects in the elimination phase, with a BAC concentration of >0.15% (150 mg/100 ml) [19].
In addition to nystagmus, balance disorders are considered characteristic to alcohol intoxication, which manifested in the whole study group, above all, in Romberg’s position (87.8%) and in 100% of subjects in BAC group IV (>1.5 mg/g). Other studies indicated that swaying manifests at a BAC of 0.5-0.8 mg/ml [20], which is also compatible with the findings where instability in Romberg’s position occurred in 93.3% of subjects in BAC group II one hour after alcohol consumption.
Based on various studies, redness of the eyes is not a very specific finding of alcohol intoxication, being poorly correlative according to McKnight et al. (r = 0.19) [21]. In this study, redness of the eyes was not strongly associated with the level of alcohol intoxication.
Several investigation methods are recommended for determination of alcohol intoxication for legal purposes and should be taken into account in specific situations. Sometimes it is useful to know the clinical signs of alcohol intoxication.
We found significant and positive relationships between alcohol consumption and biomarker concentrations among the healthy volunteers. The measurement of EtG and EtS in blood could be a helpful assessment tool in cases where the ethanol detected is claimed to be caused solely by a single intake after driving.
Determination of EtG and EtS concentrations allow us to unravel the background of the alcohol intoxication of a driver who caused a traffic accident, which in turn helps to resolve legal problems. The quality of diagnosis of alcohol intoxication in motor vehicle drivers will improve as a result of the study.
The strength of this study was its practical value in the investigation of BAC and alcohol metabolites with clinical signs of alcohol intoxication in forensic science in Estonia.
This work was supported by the Estonian Research Council project performed within the framework of implementation of Support for sectoral R&D (RITA) activity 2 ‘Support for knowledge-based policy formulation’ and by the Estonian Science Foundation (grants number 0098P).

![]()

 |
|
Figure 1: BAC, EtG and EtS values depending on the amount of pure ethanol consumed and the ethanol consumption time |
|
|
Figure 2: BAC, EtG and EtS values in males (M) and females (F) |
Variable |
BAC I |
BAC II 0.50-0.79 |
BAC III 0.80- |
BAC IV |
|
||||
|
mean |
SD |
(N = 15) |
SD |
mean |
SD |
mean |
SD |
p |
Age |
42.57 |
12.06 |
43.67 |
10.14 |
39.43 |
11.12 |
39.83 |
7.73 |
0.56 |
BMI |
25.25 |
7.14 |
27.00 |
4.65 |
29.53 |
7.17 |
26.32 |
4.81 |
0.18 |
BAC 1 h |
0.30 |
0.10 |
0.64 |
0.08 |
1.11 |
0.08 |
1.89 |
0.27 |
<0.001 |
EtG 1 h |
0.12 |
0.07 |
0.22 |
0.07 |
0.53 |
0.24 |
0.83 |
0.45 |
<0.001 |
EtS 1 h |
0.08 |
0.07 |
0.18 |
0.05 |
0.30 |
0.13 |
0.51 |
0.18 |
<0.001 |
EtG/EtS 1 h |
1.70 |
0.83 |
1.34 |
0.49 |
1.78 |
0.63 |
1.54 |
0.42 |
0.24 |
BAC/EtG 1 h |
3.22 |
1.51 |
3.22 |
1.28 |
2.42 |
1.06 |
2.86 |
1.45 |
0.33 |
BAC/EtS 1 h |
4.97 |
2.24 |
3.81 |
0.86 |
3.94 |
1.13 |
4.01 |
1.15 |
0.37 |
EtG 2 h |
0.19 |
0.11 |
0.41 |
0.08 |
0.88 |
0.32 |
1.43 |
0.59 |
<0.001 |
EtS 2 h |
0.09 |
0.06 |
0.24 |
0.07 |
0.40 |
0.13 |
0.70 |
0.19 |
<0.001 |
EtG/EtS 2 h |
2.65 |
1.21 |
1.84 |
0.55 |
2.30 |
0.72 |
1.99 |
0.37 |
0.13 |
BAC/EtG 2 h |
0.91 |
0.64 |
1.32 |
0.32 |
1.26 |
0.44 |
1.39 |
0.43 |
0.21 |
BAC/EtS 2 h |
1.87 |
1.25 |
2.32 |
0.52 |
2.69 |
0.74 |
2.67 |
0.60 |
0.20 |
Δ BAC |
0.14 |
0.05 |
0.11 |
0.03 |
0.09 |
0.06 |
0.09 |
0.08 |
0.16 |
Δ EtG |
0.07 |
0.05 |
0.19 |
0.07 |
0.34 |
0.13 |
0.60 |
0.15 |
<0.001 |
Δ EtS |
0.01 |
0.02 |
0.06 |
0.04 |
0.09 |
0.05 |
0.19 |
0.04 |
<0.001 |
Table 1: BAC groups. BAC, EtG and EtS values results one and two hours after the end of alcohol consumption
Signs |
ALL 1 h/2 h % (N) |
BAC I 1 h/2 h % (N) |
BAC II 1 h/2 h % (N) |
BAC III 1 h/2 h % (N) |
BAC IV 1 h/2 h % (N) |
Nystagmus |
93.9 (46) / 79.6 (39) |
92.6 (13) / 78.6 (11) |
86.7 (13) / 66.7 (10) |
100.0 (14) / 92.9 (13) |
100.0 (6) / 83.3 (5) |
Disturbed Romberg position |
87.8 (43) / 81.6 (40) |
71.4 (10) / 57.1 (8) |
93.3 (14) / 80.0 (12) |
85.7 (12) / 100.0 (14) |
100.0 (6) / 100.0 (6) |
Disturbed heal-toe walking test |
51.0 (25) / 49.0 (24) |
35.7 (5) / 21.4 (3) |
40.0 (6) / 40.0 (6) |
57.1 (8) / 71.4 (10) |
100.0 (6) / 83.3 (5) |
Disturbed finger-nose test |
67.3 (33)/ 44.9 (22) |
64.3 (9) / 35.7 (5) |
73.3 (11) / 40.0 (6) |
78.6 (11) / 78.6 (11) |
33.3 (2) / 33.3 (2) |
Disturbed pupils reaction to light |
77.6 (38) / 59.2 (29) |
64.3 (9) / 50.0 (7) |
66.7 (10) / 46.7 (7) |
71.4 (10) / 57.1 (8) |
66.7 (4) / 83.3 (5) |
Redness of skin |
71.4 (35) / 49.0 (24) |
57.1 (8) / 42.9 (6) |
86.7 (13) / 40.0 (6) |
71.4 (10) / 71.4 (10) |
66.7 (4) / 50.0 (3) |
Redness of conjunctives |
69.4 (34)/ 73.5 (36) |
71.4 (10) / 85.7 (12) |
60.0 (9) / 66.7 (10) |
78.6 (11) / 71.4 (10) |
66.7 (4) / 66.7 (4) |
Table 2: The main clinical findings in different blood alcohol concentration groups


