Open Access
Research Article
Max Screen >>
ISSN: 2348-9804
Copyright: © 2021 Ariff S. This is an open-access article distributed under the terms of the Creative Commons Attribution License, which permits unrestricted use, distribution, and reproduction in any medium, provided the original author and source are credited.
Related article at Pubmed, Google Scholar
Forensic Scientists are required to identify an ever increasing and more complex assortment of drugs and related compounds. A rapid, sensitive and specific thin layer chromatography (TLC), high-Performance liquid chromatography (HPLC) and gas chromatography-mass spectrometry (GC-MS) methods were utilized for the analysis of certain benzodiazepines (BZDs). These drugs were once an occasional problem, today they have become much more common. Due to the structural similarity of the specimens encountered by the forensic laboratory, an array of instruments is needed to correctly identify these substances. Any of the BZDs can be identified by combining the results obtained with different mobile phases. HPLC proposes a cost efficient method with the ruggedness and consistency necessary for forensic testing and consequently is widely used in forensic laboratories today. GC-MS is one of the most commonly used techniques for the identification and quantitation of forensic drug samples. As a “hyphenated” technique, it combines the separation power of a GC with the analyte specificity of a spectroscopic technique, provided that vastly specific spectral data on individual compounds in a complex mixture often devoid of prior separation. We succeeded in the separation of the encountered BZD drug diazepam in the forensic sample. The method was validated for linearity, accuracy, precision and limit of detection. A competent forensic toxicologist relies on their own case experience as well as the unique state of affairs of each case under assessment.
Keywords:Benzodiazepines; Diazepam; Separation; Detection; TLC; HPLC; GC-MS
Benzodiazepines (BZDs) are widely used in pharmacotherapy as antiepileptic, muscle relaxant, hypnotic, and anesthetic inductors. Because of the increasing number of pharmaceutical preparations of BZD, these drugs are frequently encountered in clinical and forensic case work samples involving road traffic offences and/or drug overdoses. BZDs are now among the most commonly-prescribed drugs, which increase their potential for addiction and abuse, and often they are found in combination with other drugs in drug-related fatalities or drug facilitated sexual assault (DFSA) cases. For these reasons, the analysis of BZDs is of great interest to forensic and clinical toxicologists.
DFSA has, in recent years, been classified as either “proactive” or “opportunistic.” Proactive DFSA relates to the covert administration of a substance to the victim where the purpose of the perpetrator is sexual assault. Previous literature indicates an increase in the number of claims of DFSA, which could be due to the advent of drugs, which are easier to administer without the victim’s knowledge and better media coverage leading to increase in awareness [1]. Although BZDs were considered to have low toxicity, the potential of addiction or dependence has still received much attention from time to time [2]. In addition, abuse of BZDs and some related substances was found to be associated with suicide or DFSA. In many cases, the DFSA victims might not report the event and receive medical attention until several hours or days after the incident.
Therefore, a rapid and sensitive analytical method became desirable to analyze the trace residual BZDs and/or metabolites in biological fluids, such as urine, blood and provide valuable information for clinical diagnosis as well as forensic application [3]. The BZDs are the most commonly prescribed class of drugs in the world for the treatment of anxiety and insomnia, particularly for the elders [4]. Alprazolam is of particular interest, because it is being prescribed for treatment of depression and has been implicated in suicidal ingestions [5]. Alprazolam is also a popular drug of abuse. Chlordiazepoxide is used to treat anxiety and acute alcohol withdrawal. It is also used to relieve fear and anxiety before surgery.
Proencaa et al.[6] has presented a fatal case with a 49-year-old female, found dead at home. She had been undergoing psychiatric treatment and was a chronic alcoholic. The autopsy findings were unremarkable, except for multi visceral congestion, steatosis and a small piece of a plastic blister pack in the stomach. The clobazam was responsible for the death [7], probably by respiratory depression. Several methods for the determination of clobazam have been published [8,9]. Gowri Bala Kumari et al. have developed and validated a simple [10], precise and accurate Reversed Phase High-Performance Liquid Chromatography (RP-HPLC) method for rapid assay of clobazam in tablet dosage form. Gazdzik et al. has described a method for simultaneous determination of Clobazam and its active metabolite N-desmethylclobazam in various biological samples by RP-HPLC method with UV detection [11]. The determination of both clobazam and N-desmethylclobazam was performed without derivatization.
Clonazepam, a nitrobenzodiazepine and a scheduled drug, is one of the highly abused drugs in recent times. Idris et al. has developed an analytical methodology for the detection and quantitation of clonazepam in chocolate sample [12]. Several methods have been described for analysing clonazepam [13-15]. AboulEnein and Thiffault have described an accurate and reproducible method for the analysis of flurazepam hydrochloride in pharmaceutical preparations [16]. It was a simple and rapid isocratic HPLC elution method was employed, which requires about 15 minutes to be performed. Dammalapati and Rudra Raju have reported a new [17], sensitive, fast, precise, RP-HPLC method for the determination of flurazepam in (capsule) dosage form.
Dadgar et al. have developed a method for the determination of flurazepam and its metabolites in human blood plasma [18]. Selinger et al. described a sensitive isocratic HPLC method [19], which allows the precise and accurate quantification of flurazepam and four metabolites with a single determination. Mehta had reviewed the methods available to date for the determination of chlordiazepoxide [20], clonazepam, diazepam, and their metabolites in biological fluids. The pharmacokinetics and bioavailability of these compounds and their concentrations in serum in cases of abuse, forensic cases, and drug poisoning or suicidal excessive doses have been reported [21]. Dordevic et al. reported the use of photodiode array (HPLC-PDA) and mass spectrometric (LC-MS) detection for determination and confirmation of midazolam in biological samples in therapeutic or toxic concentration [22].
Nishiyama et al. have reported two cases of overdoses of intramuscular midazolam used as a premedication [23]. Both cases had no resedation or complications, but the accidents happened because of a resident and nurse’s lack of experience with midazolam. The postmortem tissue midazolam concentration reported in a death caused by self-injection of midazolam and sulfentanil. Michalodimitrakis et al. have reported midazolam related death of a 63-year-old man that occurred during endoscopic retrograde cholangiopancreatography [24], after receiving 10 mg of midazolam. The acute intoxication due to midazolam overdose was confirmed by HPLC analysis.
Methods based on HPLC with detection of ultraviolet absorbance have been also presented for BZD analysis [25-27]. Several chromatographic methods have been reviewed by Sioufi and Dubois [28]. HPLC combines many of the advantages of other methods by providing adequate separation of components at room temperature with quantification of the drug and metabolites. Since some 1,4-benzodiazepines are thermally labile, operation at room temperature is particularly advantageous.
Several chromatographic methods for the analysis of BZDs and its metabolite in biological samples have been reported including high-performance liquid chromatography (HPLC) [29], single liquid chromatography ([LC]-MS) or tandem mass spectrometric (LC-MS/MS) detection [30,31], and GC using electron capture or EI-MS (GC/EI-MS) detection [32,33]. GC coupled with negative ion chemical ionization MS (GC/NICI-MS) offers much better sensitivity than the conventional GC/EI-MS technique, and it has been successfully applied for the detection of different analytes in blood samples [34].
The objective of this research is to develop a universal, rapid, precise and sensitive TLC, HPLC and GC-MS methods for the separation and detection of alprazolam, chlordiazepoxide, clonazepam, clobazam, diazepam, flurazepam, nitrazepam and midazolam drugs in bulk powder and in pharmaceutical dosage form as well as in confiscated materials. Hence, the current investigation concluded by representing the significant analytical work that could be used for the BZDs in separation and detection by the aforementioned chromatographic methods in pharmaceutical dosage forms as well as in forensic samples or in the any confiscated materials.
Silica gel G UV254 precoated commercial plates (20×20 cm, 0.25 mm thickness) were supplied by Merck (Darmstadt, Germany). A 10 μL Hamilton syringe calibrated at 0.1 μL intervals was used. Substances were applied to the plates with the aid of 10 μL Hamilton syringe; spots were visualized using a spray gun.
Benzodiazepine drugs viz. (alprazolam, chlordiazepoxide, clonazepam, clobazam, diazepam, flurazepam, nitrazepam and midazolam) were of pharmaceutical grade (India). All of the solvents i.e. methanol (Qualigens Fine chemicals, India), ethyl acetate, ammonium hydroxide (NICE Chemicals, India), ammonia (Merck, India), chloroform (S.D.Fine chemicals, India), toluene (Rankem, India), acetone (Glaxo Laboratories, India), hexane (Loba Chemie, India) and reagents used were of analytical reagent grade. Deionized water was used to prepare all solutions. Freshly prepared solutions were always employed.
Dragendorff’s Reagent
Solution A: Bismuth sub nitrate (Merck, India) of 1.7 gram and 20 mL of glacial acetic acid (Rankem, India) were dissolved in 80 mL of deionized water.
Solution B: Potassium iodide (Merck, India), of 16 g was dissolved in 40 mL of deionized water. Then equal volumes of solution A and solution B were mixed to get the stock solution. This solution is stable for several months when stored in a refrigerator.
Spray Solution: One part of the stock solution was mixed with 10 parts by volume of 1.33 mol/L glacial acetic acid solution (Rankem, India).
Acidified Iodoplatinate Reagent: It was prepared by dissolving 0.15 gram of potassium chloroplatinate (Merck, India) and three gram of potassium iodide (Merck, India)100mL dilute hydrochloric acid and mixed with six gram of potassium iodide (Merck, India) in 100 mL deionised water.
Each type of BZDs tablet was accurately weighed and powdered in a mortar. Ten milligrams were taken and dissolved in 10 mL of methanol and sonicated for five minutes. Another 20 mL of methanol was added and sonicated for further 5 minutes. The mixture was mixed thoroughly for 2 minutes and transferred to a 100 mL volumetric flask through a Whatmann No.40 filter paper. The residue was washed thrice with methanol and the combined filtrate was made up to the mark with methanol.
The prepared sample solution was diluted with methanol to obtain serial sample solutions of 10, 25, 50, 100 and 250 μg/mL concentrations. These solutions were stored in well closed vessels and direct contact with light was avoided.
The viscera was soaked well in RS and acetic acid at overnight then decanted and kept in water bath to get dryness, the residue was dissolved in hot water and filtered subsequently it has been extracted with chloroform in basic medium. The chloroform extract was concentrated and screened for the presence of BZDs using TLC, HPLC and GC-MS methods.
The plates were divided into 1.5 cm wide strips and solute spots were applied using a calibrated Hamilton syringe. Then, 2-10 μL each of the drug solutions were spotted on the TLC plates as separate spots. The plates were developed in a closed glass sintered chamber containing developing solvents with 30 minutes saturation time (listed in Table 1), at 25-30 ºC temperature. The solvent in the chamber was allowed to reach the lower edge of the adsorbent though the spot points were not allowed to be immersed. The cover was put in place, and the system was maintained until the solvent ascended to a point 10 to 15 cm above the initial spots; this usually required about 30 to 90 minutes. The plate was removed from the developing chamber when the solvent reached solvent front and later was dried in air
The reference standards and first portion of acetone extract were spotted on two different silica gel F254 TLC plates at a distance of 2 cm from base and elution was carried out up to 16 cm using two different mobile phases. After elution the plates were taken out and dried at room temperature. The TLC plates were visualized under ultraviolet light (254 nm) followed by spraying with developing reagents. Non-destructive procedure, such as the use of ultraviolet light (both 254 nm and 356 nm) was used for the localization of separated spots. Next, the plates were sprayed with three different chromogenic reagents (visualization reagent namely; (i) dragendorff’s reagent and (ii) acidified iodo platinate reagent for the identification of BZD drugs. The Rf values and color spots of the separated drugs were recorded.
Chromatographic identification was performed at room temperature (25 ± 1 ºC) with Perkin Elmer NFLR 0400, Flexar Quartenary -10 LC platform delivery system and a programmable UV-visible variable - wavelength was used with Kit-Flexar manual sample injector. The Chromatographic identification was achieved on a (250×4.6 mm) RP C18 column (Phenomenex, USA) having a 5 μm packing as a stationary phase. The elution was performed at a flow rate of 1.5 mL/min with UV detection at 254 nm. Samples (10 μL) were injected using Kit-Flexar manual sampler. The data acquisition and processing was carried out on Chromera software.
In order to evaluate an efficient and universal HPLC method, preliminary tests were performed with the objective to select adequate and optimal conditions. Parameters, such as optimal mobile phase, optimum pH, polar drug alprazolam, chlordiazepoxide, clonazepam, clobazam, diazepam, flurazepam, nitrazepam and midazolam are preferably analysed by reverse phase columns and accordingly C18 column was selected. The concentration of methanol and acetonitrile were optimised to give symmetric peak with short run time based on asymmetric factor and peak area obtained.
The primary goal of the forensic drug examiner is the unequivocal identification of any controlled substance present in a drug exhibit. Most forensic laboratories routinely employ GC/MS as the preferred method for this examination. The technique provides a rapid, semi-automated analysis of the sample and typically yields sufficient information to identify the compounds in question. However, the application of GC/MS for drug analysis does have its limitations.
GC-MS instrument chromatographic analysis was carried out on an Agilent 7820A GC system equipped with 5977E mass selective detector (MSD) with triple axis detector (TAD). It optimizes signal-to-noise by combining efficient ion collection and amplification with the elimination of neutral noise. DB-5 column width 0.25 μm film thickness (30 m × 0.25 mm I.D., Germany) was used for separation. Splitless injection was used and the carrier gas was helium at a flow rate of 1.2 mL/min.The data was acquired and processed by Agilent DA Express data analysis software and mass spectra libraries are screened for identification of BZD drugs.
Silica gel G UV254 was used as an adsorbent. The use of adsorbents containing fluorescent inorganic pigments is advisable for the detection of substances which absorb in the UV-region. The great advantage of this method is that the separated materials can be detected without being chemically modified in any reaction [35]. There is virtually no difference in the performance between fluorescent and non-fluorescent plates, though the former has the advantage of visibility of a spot under ultraviolet light. Solvent systems I, II and III (Table 1) were proposed for BZD drugs and visualizations of the separate drugs were performed by both short and long wavelength UV-light, 254 nm and 356 nm respectively.
Zimmermann test has been performed for the Sample and BZDs which were treated with 1% m-dinitrobenzene (dissolved in rectified sprit) followed by 15% alcoholic potassium hydroxide, the sample and diazepam were only formed reddish purple colour and other BZDs did not appear reddish purple colour.
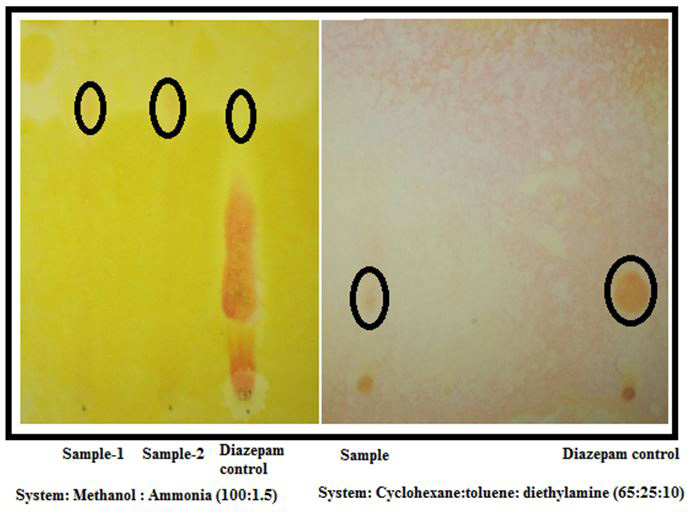
Visualisation were also performed using sprayed chromogenic reagents i.e Dragendorff’s reagent (Figure 1) and acidified iodo platinate reagent.
The Rf values in various solvents and the colours developed at each stage for BZDs drugs are given in Table 2. The above three systems were recorded for the separation and detection of BZDs drugs. The limit of detection (LOD) for TLC was found to be 25μg/mL.
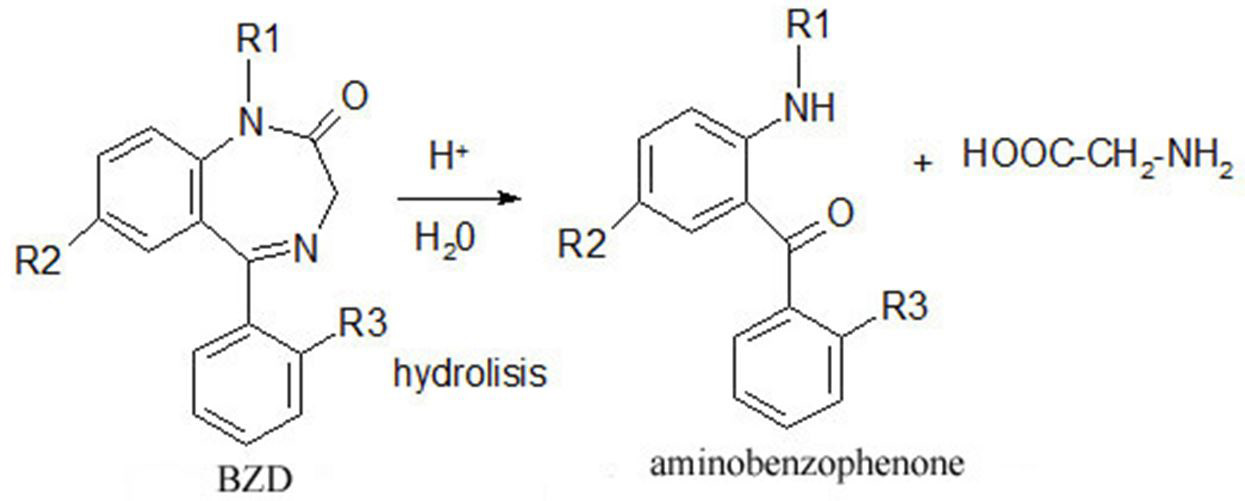
BZDs are relatively instable, easily hydrolyze in acidic solution and also decompose in UV light. Hydrolysis in acidic solution generally leads to 2-aminobenzophenone derivatives, through the split of the N1-C2 bond of the diazepinic ring (Figure 2).
TLC of benzophenones obtained by acid hydrolysis of BZD derivatives is widely used for identification purpose however this method is not product specific as different types of BZDs can give the same benzophenone derivatives. Alprazolam however do not form benzophenones. The advantage of TLC of the benzophenones is that different metabolites from same benzodiazepine are able to give the same benzophenone on hydrolysis, which makes this method more suitable for identification of these products in biological fluids.
TLC of benzophenones is also mentioned in several papers as being useful for the identification of pure benzodiazepines or for the identification of benzodiazepines and metabolites in biological fluids. Technically, a good hydrolysis result can be obtained when the spots were covered with a glass plate after moistening with sulphuric acid; omitting this detail would probably cause rapid evaporation of the sample with partial or no hydrolysis [16]. The use of hydrochloric acid instead of sulphuric acid is unsuitable when UV light is used for detection due to background effects that may prevent normal detection of spots.
After the acid hydrolysis gave Rf values in the increasing order for chlordiazepoxide, diazepam and flurazepam, the spots were also identified using the aforementioned spray reagents. The results of in-situ acid hydrolysis obtained were compared to the studied solvent system as given in Table 2. Three solvent systems can be successfully used for separation of the compounds investigated, and it has been observed that the chloroform: methanol (90:10) is the best solvent system for acid hydrolysis. The LOD for the aforementioned BZD drugs are 168 μg/mL.
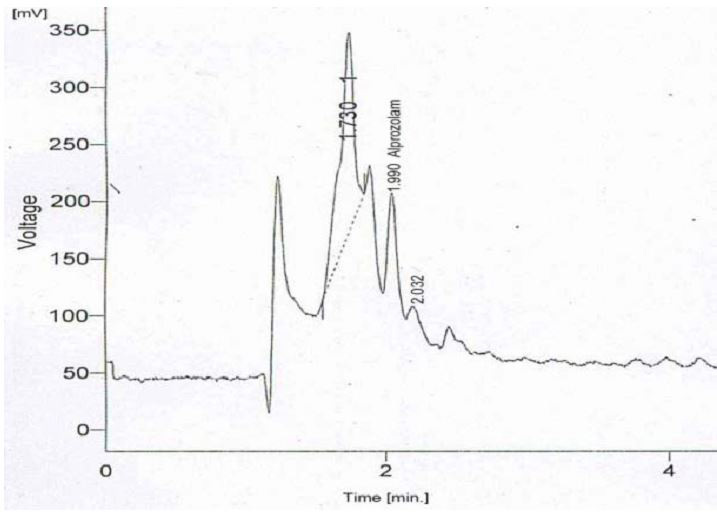
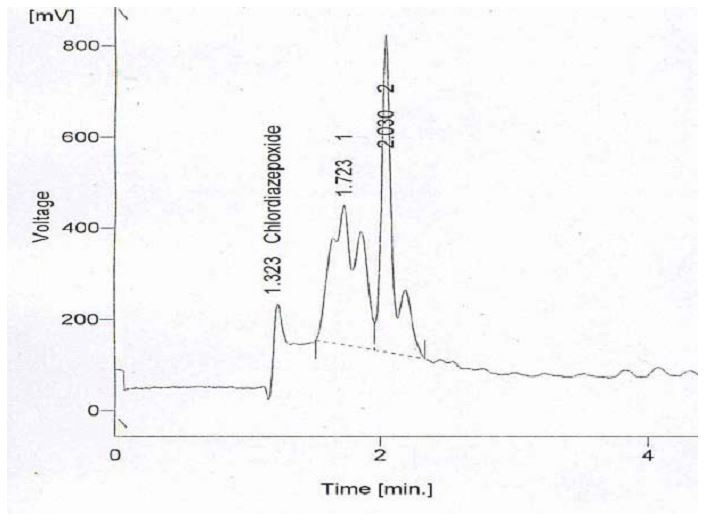
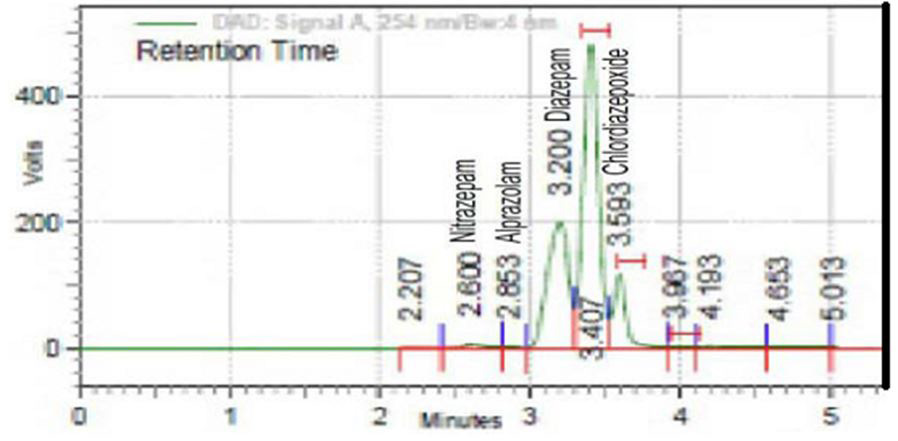
In this study, mobile phases and with its composition, which have shown in Table 3 to separate and to detect the BZD drugs viz. Alprazolam, clobazam, clonazepam, chlordiazepoxide, diazepam, flurazepam, nitrazepam and midazolam (Figure 3 and 4). The relative retention times recorded for the studied BZDs are illustrated in Table 4.
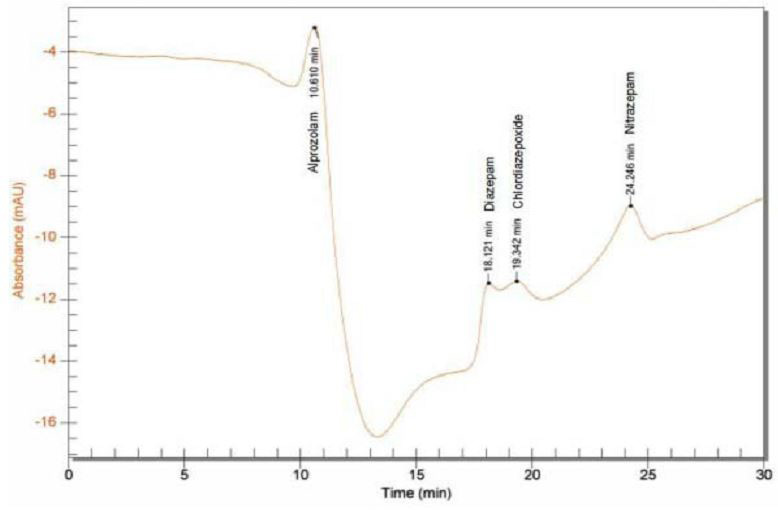
Different mobile phases were tested but satisfactory separation, well resolved and good symmetrical peaks were obtained with the mobile phase methanol: acetonitrile: water 45:40:15 (v/v/v). The obtained chromatogram for this system shown in Figure 5. The retention time of alprazolam, chlordiazepoxide, diazepam and nitrazepam was found to be, 10.610, 19.342, 18.121 and 24.246 mins, respectively with a good baseline.
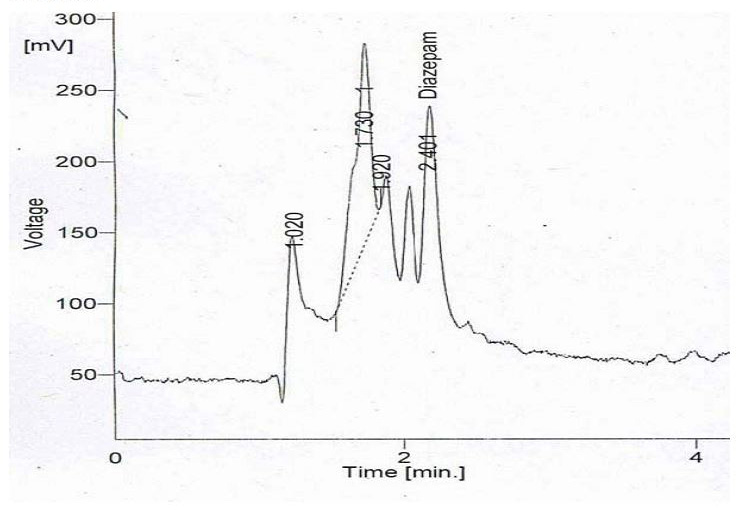
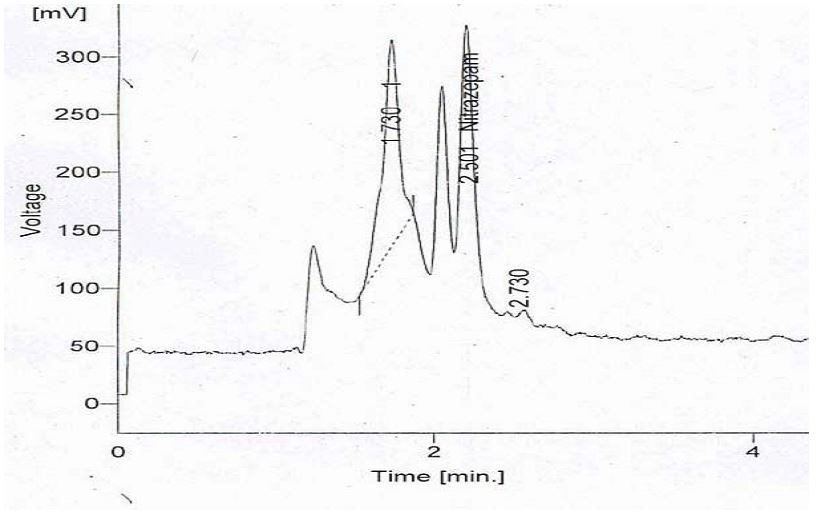
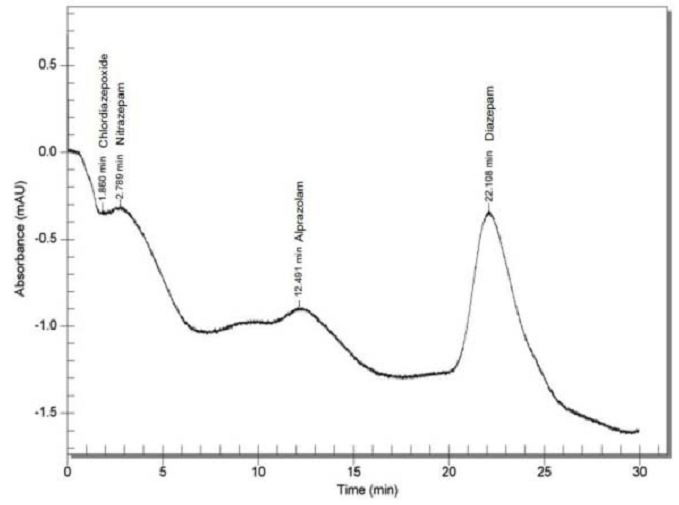
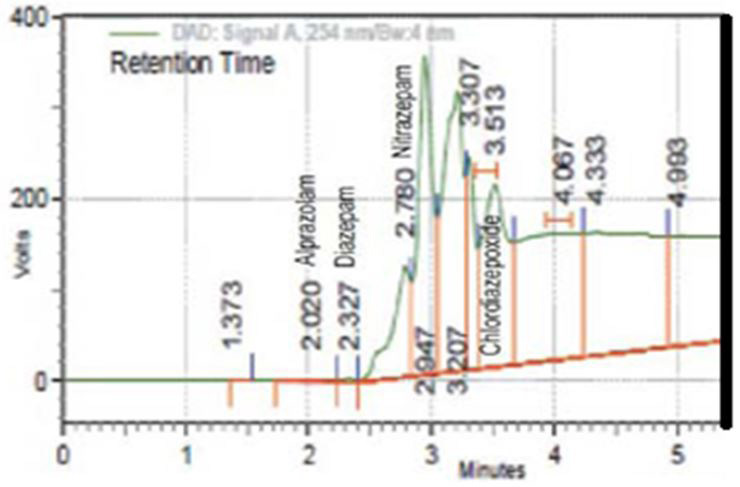
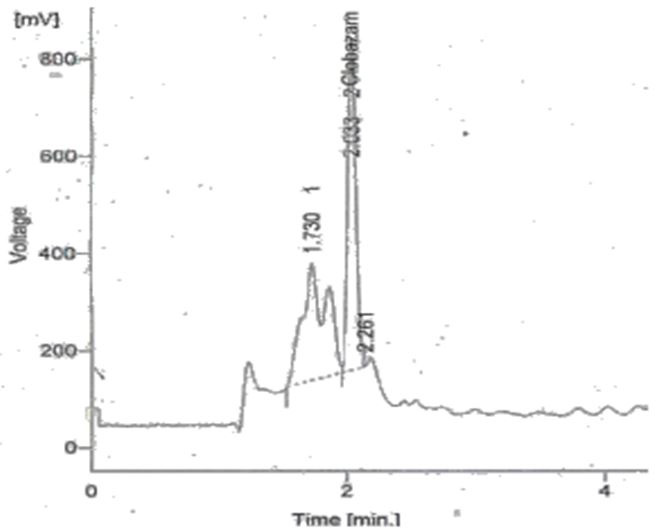
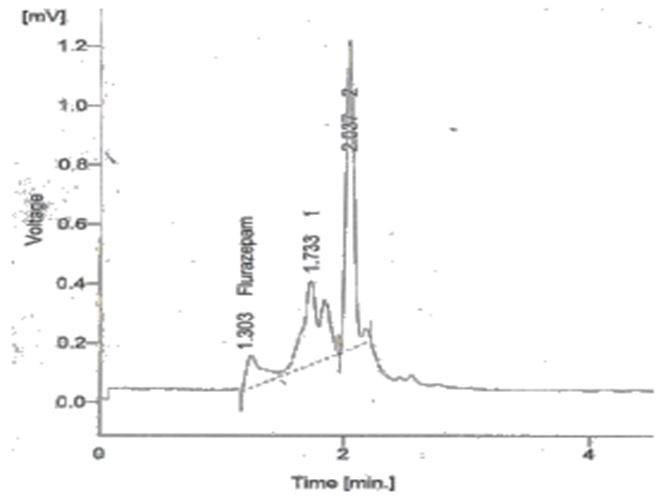
A good reliable separation has also been achieved with the mobile phase methanol: acetonitrile: water 70:25:5 (v/v/v). The obtained chromatogram for this system is shown in Figure 6. The retention time of alprazolam, chlordiazepoxide, diazepam and nitrazepam was found to be, 12.491, 1.860, 22.108 and 2.789 minutes, respectively, indicates a good baseline (Figures 7,8,9 and 10). The retention times for all of the mixture samples are given in Table 4.
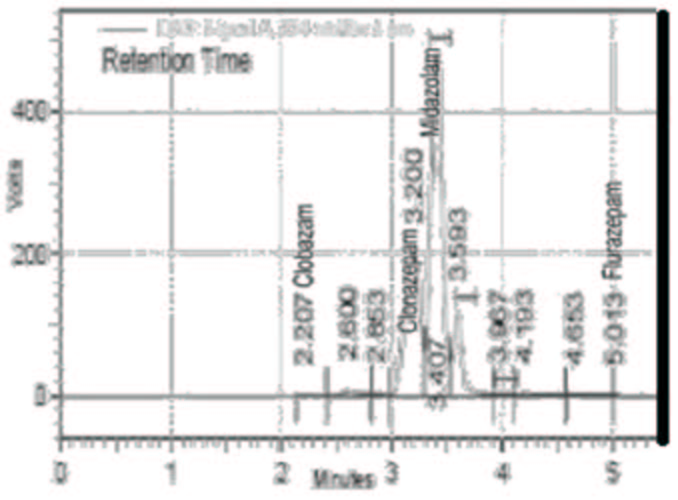
The BZD drugs mixture were analysed with various concentration like 50, 100 and 150 μg/mL with the aforementioned chromatographic conditions, (Figures 11,12,13,14,15,16,17 and 18) for concentration 150 μg/mL. The above-mentioned concentration for determination of Limit of detection (LOD) was carried out with reliable separation and detection at the concentration of 150 μg/mL. The nature of the sample, its molecular weight and solubility decide the proper selection of the stationary phase. Clobazam, clonazepam, flurazepam and midazolam are being non-polar is preferably analysed by reverse phase columns and accordingly C18 column was selected. So the elution of the compound from the column was influenced by polar mobile phase.
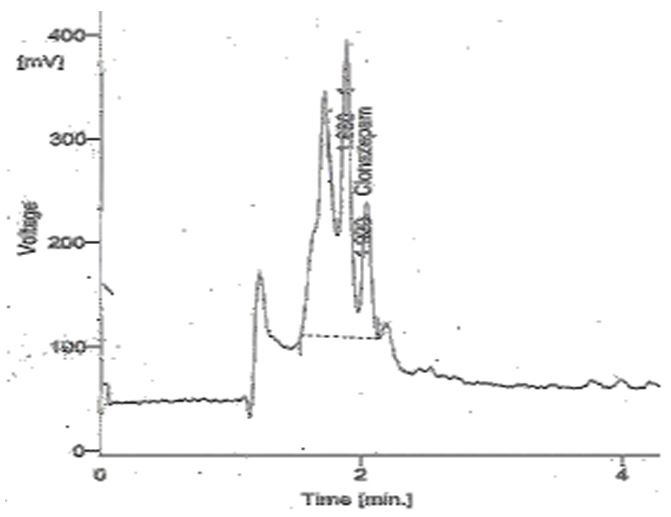
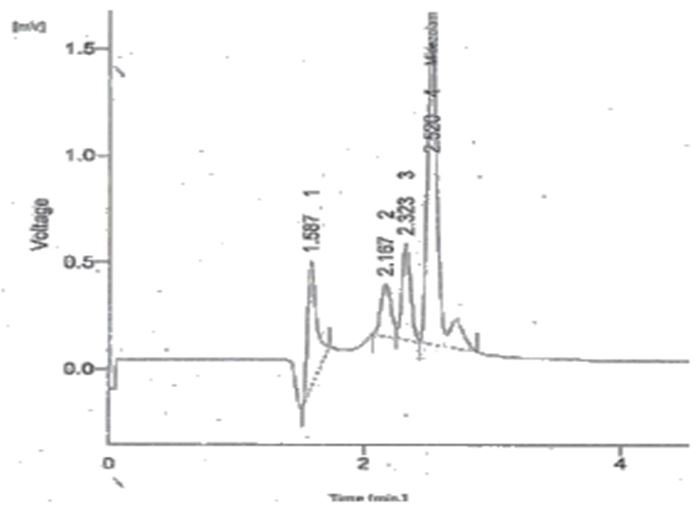
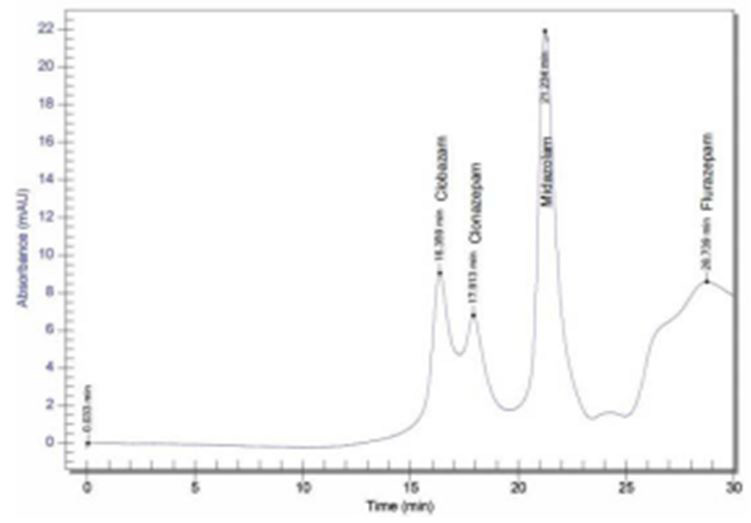
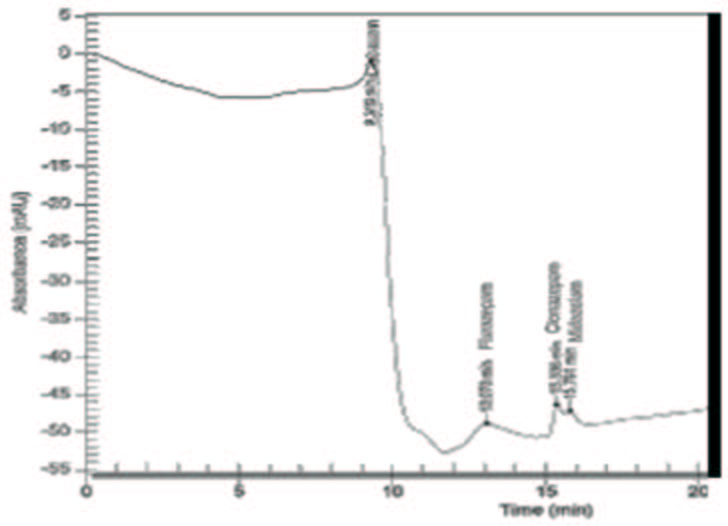
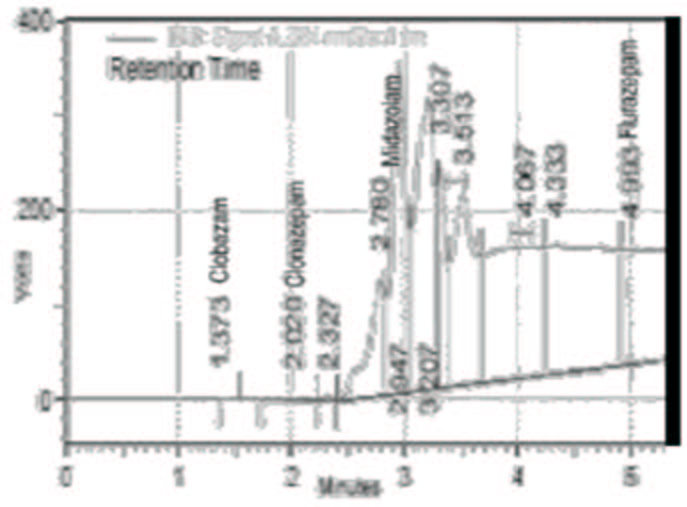
The concentration of the methanol and acetonitrile were optimised to give symmetric peak with short run time based on asymmetric factor and peak area obtained. The obtained chromatogram for the solvent system methanol:acetonitrile:water 45:40:15 (v/v/v) is shown in (Figure 15). The retention time of clobazam, clonazepam, flurazepam and midazolam was found to be 16.36, 17.91, 28.74 and 21.23 min, respectively. The obtained chromatogram for the system methanol:acetonitrile:water 70:25:5 (v/v/v) which is shown in (Figure 16). The retention time of clobazam, clonazepam, flurazepam and midazolam was found to be 9.32, 15.34, 13.07 and 15.79 minute, respectively.
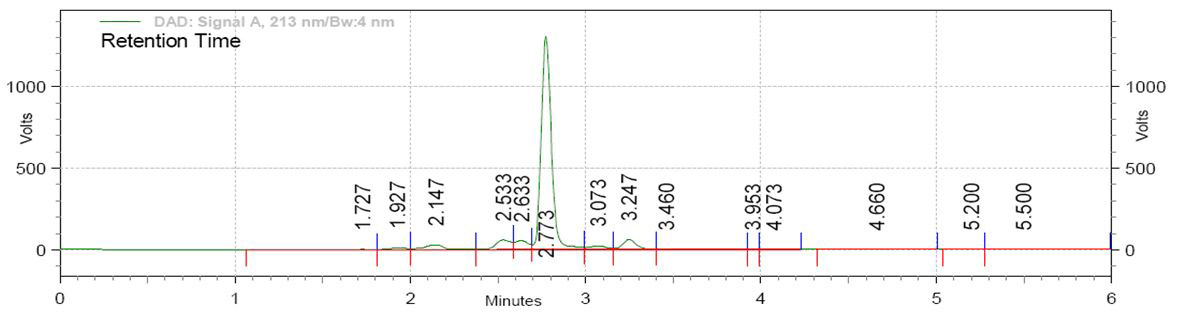
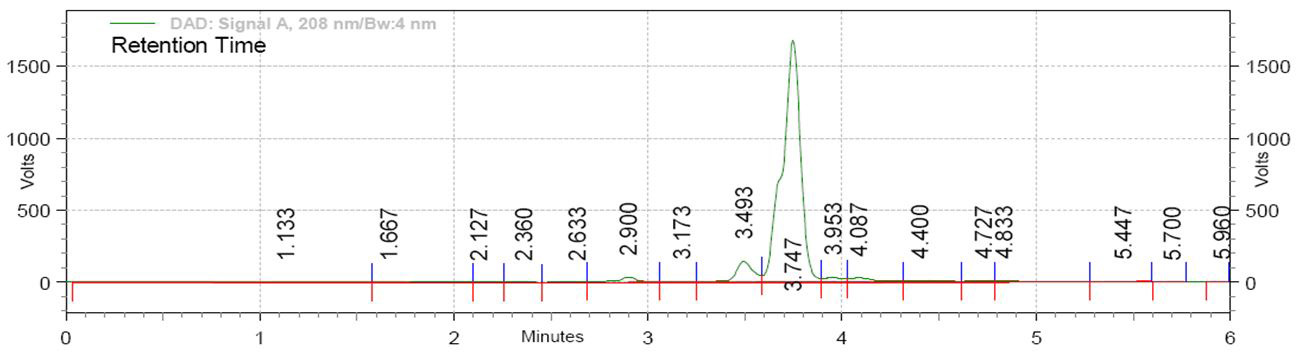
Once optimal chromatographic conditions have been established, the method was carried out for simultaneous detection and separation of these compounds. The representative chromatogram of BZDs mixture obtained under the optimal conditions chosen is shown in (Figure 1,2,3,4,5,6,7,8,9,10,11,12,13,14,15 and 16). The chromatogram indicated the appropriate resolution between the compounds investigated. No interfering of peaks was observed in the samples studied (Figure 7,8,15 and 16). This can influence the selectivity of simultaneous separation and detection of these four drugs. It has also been emphasized that the advantage of this developed method is better than existing works. Finally the Chromatogram of the encountered forensic sample and Chromatogram of the control diazepam in mobile phase A are shown in (Figure 19 and 20).
The proposed method is simple, rapid, accurate, precise and specific. Its chromatographic run time was 10 minute, which allows the analysis of a large number of samples in short period of time. Therefore, it is suitable for the routine analysis of drug Alprazolam, clobazam, clonazepam, chlordiazepoxide, diazepam, flurazepam, midazolam and nitrazepam in pharmaceutical dosage form. In most countries, BZDs are classified as controlled drugs, and yet they are frequently encountered in clinical and forensic toxicology analyses involving intoxication, over dosage, and traffic accidents and are sometimes implicated in the commitment of crimes. Therefore, the availability of reliable, sensitive, specific and fast analytical methods for their determination is deemed important.
In this study, HPLC procedure has been established for the simultaneous separation and detection of four BZDs, viz. Alprazolam, clobazam, clonazepam, chlordiazepoxide, diazepam, flurazepam, midazolam and nitrazepam. We could emphasize that the advantage of this developed method is better than existing works. It appears that the developed method is simple, rapid and accurate and is suitable for routine analysis of pharmaceutical dosage forms and it could be applied to the forensic samples.
Linking gas chromatography to mass spectrometry to obtain and compare retention times from a standard to the unknown has also been used to provide compound identification. The BZDs samples (1-3 μL) before and after UV treatments were analyzed by the aforementioned three GC-MS system with the above mentioned conditions. The oven temperature is programmed by holding at 100 °C to 270 °C at a rate of 10 °C per min. The injector temperature with split less mode was set at 250 °C. The carrier gas was the ultra high purity helium gas (Airgas) at a low rate of 1.2 mL/min. Data analysis was conducted using Agilent DA Express data analysis software.
Figure 21 showed the typical gas chromatograph of BZDs in chloroform solution. Figure 22 showed the mass spectrum of the GC peak at 15.542 minute which showed major signals at the mass to charge ratio (m/z) 70, 91, 125, 153, 177, 207, 244 and 281. The GC peak at 15.542 minute was identified to be diazepam by the mass data library using Agilent DA Express data analysis software.
Figure 23 showed the mass spectrum of the GC peak at 16.38 minute which showed major signals at the mass to charge ratio (m/z) 73, 95, 133, 165, 207, 252 and 281. The GC peak at 16.38 minute was identified to be diazepam by the mass data library using Agilent DA Express data analysis software.
Figure 24 showed the mass spectrum of the GC peak at 16.83 minute which showed major signals at the mass to charge ratio (m/z) 73, 96, 119, 149, 177, 207, 253 and 281. The GC peak at 16.83 minute was identified to be diazepam by the mass data library using Agilent DA Express data analysis software.
Figure 25 showed the mass spectrum of the GC peak at 17.00 minute which showed major signals at the mass to charge ratio (m/z) 73, 96, 133, 155, 177, 207, 253 and 281. The GC peak at 17.00 minute was identified to be diazepam by the mass data library using Agilent DA Express data analysis software.
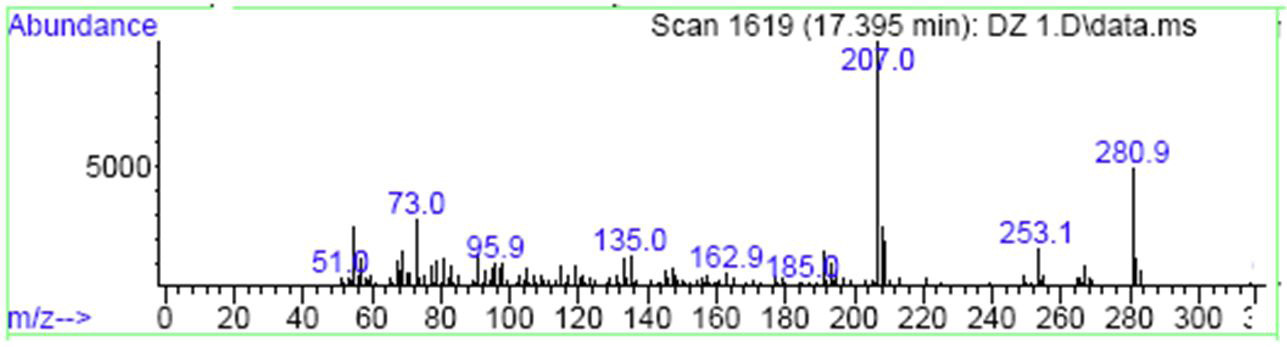
Figure 26 showed the mass spectrum of the GC peak at 17.39 minute which showed major signals at the mass to charge ratio (m/z) 73, 96, 135, 163, 185, 207, 253 and 281. The GC peak at 17.39 minute was identified to be diazepam by the mass data library using Agilent DA Express data analysis software.
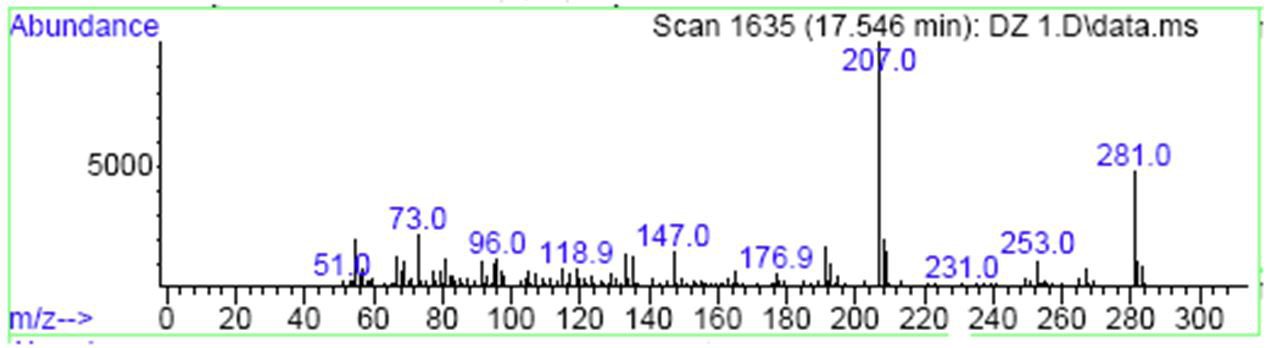
Figure 27 showed the mass spectrum of the GC peak at 17.54 minute which showed major signals at the mass to charge ratio (m/z) 73, 96, 119, 147, 177, 207, 231,253 and 281. The GC peak at 17.54 minute was identified to be diazepam by the mass data library using Agilent DA Express data analysis software.
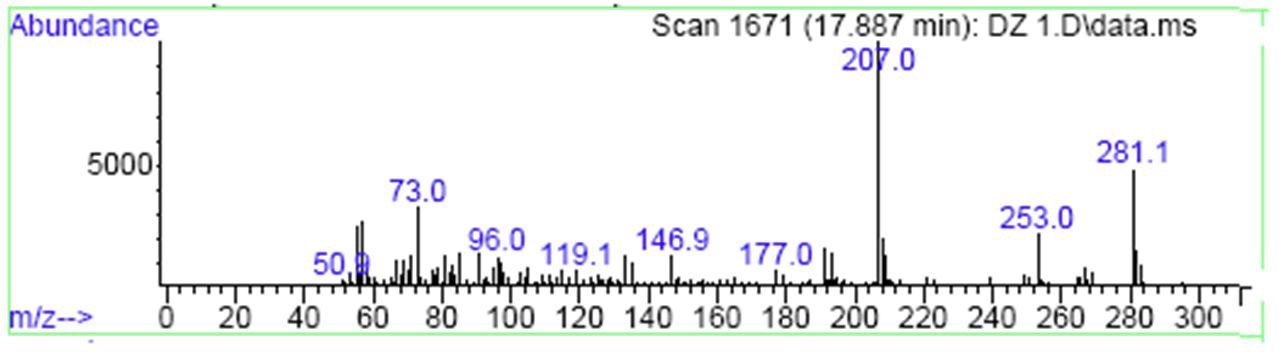
Figure 28 showed the mass spectrum of the GC peak at 17.88 minute which showed major signals at the mass to charge ratio (m/z) 73, 96, 119, 147, 177, 207, 253 and 281. The GC peak at 17.88 minute was identified to be diazepam by the mass data library using Agilent DA Express data analysis software.
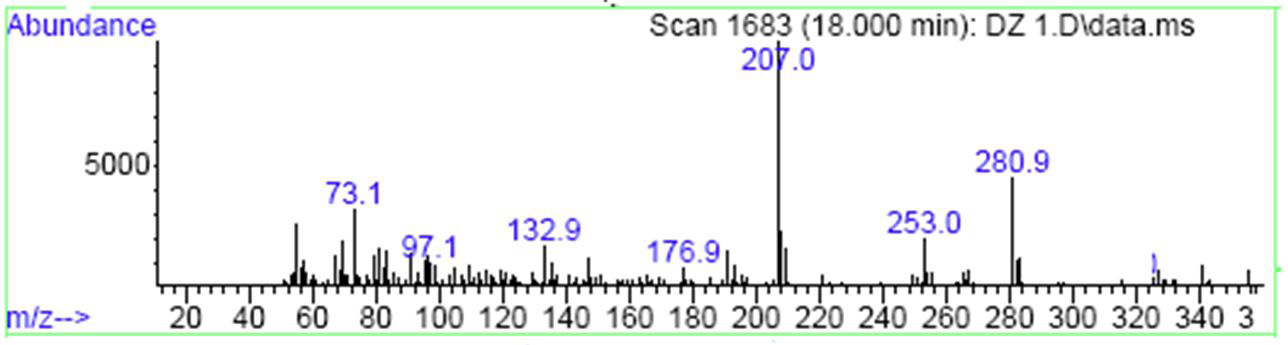
Figure 29 showed the mass spectrum of the GC peak at 18.00 minute which showed major signals at the mass to charge ratio (m/z) 73, 97, 133, 177, 207, 253 and 281. The GC peak at 18.00 minute was identified to be diazepam by the mass data library using Agilent DA Express data analysis software.
GC-MS analysis confirmed the results obtained with TLC. Figure 21 depicts the Total Ion Chromatogram (TIC) obtained in GC-MS (Figure 22,23,24,25,26,27,28 and 29) which revealed the presence of diazepam with base peak of m/z: 207 at retention times (Rt) of 16.38, 16.83, 17.00, 17.88 and 18.00 minutes. Other peaks obtained in the results were also analyzed using mass spectral libraries which were found to be of higher mass number BZDs.The instrument was studied for repeatability, sensitivity, and selectivity while optimizing for analysis of a wide range of drug samples. Based upon this work the instrument proved to be a powerful forensic tool providing complimentary data to GC/MS. The LOD for the aforementioned BZD drugs are 145 μg/mL.
A mass spectrum is often unique for a particular compound and has been used extensively by the forensic community to identify controlled substances. This technique, especially when linked to a gas chromatograph, has stood the test of time and court challenges. However, there are various substances which may yield minimal mass spectral fragmentation patterns or patterns too similar to allow one to distinguish between isomers or similar compounds bearing related structures.
Forensic scientists routinely rely upon GC/MS to differentiate individual compounds from complex mixtures. However, GC/MS has limitations. Certain drugs yield minimal mass spectral fragmentation patterns using electron impact MS, while other compounds, such as some diastereomers and positional isomers, are not readily differentiated by mass spectroscopy. Hence, this method could be applied to detection in drug abuse cases in forensic science laboratories as well as in pharmaceutical formulations. The experimental data presented in this work may provide useful information regarding the potential link between the forensic drug evidences and suspects.
Numerous aspects of separation science are applicable to forensic science. The proper identification of drug samples by the forensic drug examiner is of paramount importance. As drug samples become more complex, and compounds with similar molecular structures are submitted to the laboratory, it is imperative examiners have access to appropriate techniques that allow an identification of the sample under examination.
Because chromatography techniques are so versatile and can be used to determine so many different compounds, the technique is particularly well suited to the demands of a forensic laboratory. Both qualitative and quantitative information can be obtained, often with minimal sample preparation. Because only small volumes are needed for analysis, sample consumption can be minimized. Eluting fractions can be collected for further analysis an important consideration when dealing with trace evidence.
This sensitive and selective method offers the opportunity for simultaneous screening and identification of almost all BZDs which are available in India and that are relevant in clinical and forensic cases. Low dose as well as high dose BZDs can be measured simultaneously, with low detection limits, and satisfactory validation characteristics. Hence, the current investigation concluded by representing the significant analytical work that could be used for the BZDs in separation and detection by chromatography methods in pharmaceutical dosage forms as well as in forensic samples or in the confiscated materials. This method could be potentially applied in the analysis of forensic samples from DFSA cases. We could emphasize that the advantage of this developed method is better than existing works. We have achieved for our encountered forensic sample in analysis of BZD. It appears that the developed method is simple, rapid, accurate and suitable for routine analysis of pharmaceutical dosage forms and it could be applied to the forensic samples.
The authors are very grateful to the Principal, Raja Doraisingam Government Arts College, Government of Tamil Nadu, Sivagangai and Dr.A.Cyril, Head of the Department, Post Graduate Studies & Research Department of Chemistry, Raja Doraisingam Govt.Arts College, Sivagangai - 630 561 for providing constant encouragement and necessary facilities. Also one of the authors (KG) extends his gratitude to Shri. K. Kumar, Deputy Director, Regional Forensic Science Laboratory, Govt.of Tamil Nadu, Madurai – 625 020 for his constant encouragement.

![]()

S.No |
System |
Developing solvent |
Composition (v/v) |
1 |
I |
Methanol: Ammonium hydroxide |
100:1.5 |
2 |
II |
Cyclohexane:Toluene:Diethylamine |
65:25:10 |
3 |
III |
Chloroform:Methnol |
90:10 |
Table 1: Developing solvent system for Benzodiazepines
Visualisation were also performed using sprayed chromogenic reagents i.e Dragendorff’s reagent (Figure 1) and acidified iodo platinate reagent
System |
|
|
Alprazolam |
Chlordiazepoxide |
Clobazam |
Clonazepam |
Diazepam |
Flurazepam |
midazolam |
nitrazepam |
I |
Rf |
|
0 |
0.64 |
0.78 |
0 |
0.18 |
0.25 |
0 |
0.79 |
Colour in |
UV |
NCD |
NCD |
NCD |
NCD |
NCD |
NCD |
NCD |
NCD |
|
DDR |
Orange |
Orange |
Orange |
Orange |
Orange |
Orange |
Orange |
Orange |
||
Iodoplatinate |
Brown |
Brown |
Brown |
Brown |
Brown |
Brown |
Brown |
Brown |
||
System |
|
|
Alprazolam |
Chlordiazepoxide |
Clobazam |
Clonazepam |
Diazepam |
Flurazepam |
midazolam |
nitrazepam |
II |
Rf |
|
0 |
0.35 |
0.08 |
0.28 |
0.38 |
0.33 |
0.05 |
0.84 |
Colour in |
UV |
NCD |
NCD |
NCD |
NCD |
NCD |
NCD |
NCD |
NCD |
|
DDR |
Orange |
Orange |
Orange |
Orange |
Orange |
Orange |
Orange |
Orange |
||
Iodoplatinate |
Brown |
Brown |
Brown |
Brown |
Brown |
Brown |
Brown |
Brown |
||
III |
Rf |
|
0 |
0.63 |
0.76 |
0 |
0.19 |
0.25 |
0 |
0.78 |
Colour in |
UV |
NCD |
NCD |
NCD |
NCD |
NCD |
NCD |
NCD |
NCD |
|
DDR |
Orange |
Orange |
Orange |
Orange |
Orange |
Orange |
Orange |
Orange |
||
Iodoplatinate |
Brown |
Brown |
Brown |
Brown |
Brown |
Brown |
Brown |
Brown |
Table 2: The Rf values of certain Benzodiazepine drugs on silica gel G UV254
Note: UV: Ultraviolet in 254 nm & 356 nm; DDR: Drogendorff’s Reagent; NCD: No Colour Development
The use of visualization reagents to enhance chromatographic detection was observed hereby Dragendorff’s spray detected orange colour spots in all samples developed in the solvent system number I,II and III. Brown colour spots appeared in all BZDs samples developed from solvent system I,II and III, upon contact with iodoplatinate spray
Mobile phases |
Solvents |
A |
Methanol: Water (60:40) |
B |
Methanol : Acetonitrile: Water (45:40:15) |
C |
Methanol:Acetonitrile:Water (70:25:5) |
D |
Methanol: Acetonitrile (60:40) |
Table 3: The studied mobile phases and its compositions for the separation
Mobile phases |
Retention times (minute) |
|||||||
Alprazolam |
Chlordiazepoxide |
Diazepam |
Nitrazepam |
Clobazam |
clonazepam |
Flurazepam |
Midazolam |
|
A |
2.853 |
3.583 |
3.20, 2.77, 3.74 |
2.800 |
2.21 |
3.20 |
5.01 |
3.41 |
B |
10.610 |
19.342 |
18.121 |
24.246 |
16.36 |
17.91 |
28.74 |
21.23 |
C |
12.491 |
1.860 |
22.108 |
2.789 |
9.32 |
15.34 |
13.07 |
15.79 |
D |
2.020 |
3.513 |
2.327 |
2.780 |
1.37 |
2.02 |
4.99 |
2.95 |
Table 4:The relative retention time for the studied BZDs drugs
 |
|
Figure 1: TLC for Diazepam of Forensic sample and control in system I and II |
 |
|
Figure 2: Benzodiazepine degradation in acid medium |
 |
|
Figure 3: Chromatogram of Alprazolam in mobile phase A with a flow rate of 1 mL/min at 25 °C column temperature |
 |
|
Figure 4: Chromatogram of Chlordiazepoxide in mobile phase A with a flow rate of 1 mL/min at 25 °C column temperature |
 |
|
Figure 5: Chromatogram of Diazepam in mobile phase A with a flow rate of 1 mL/min at 25 °C column temperature |
 |
|
Figure 6: Chromatogram of Nitrazepam in mobile phase A with a flow rate of 1 mL/min at 25 °C column temperature |
 |
|
Figure 7: Chromatograms of Alprazolam, chlordiazepoxide, diazepam and nitrazepam in mobile phase B with a flow rate of 1 mL/min at 25 °C column temperature at drug concentration 150 μg/mL |
 |
|
Figure 8: Chromatograms of Alprazolam, chlordaizepoxide, diazepam and nitrazepam in mobile phase C with a flow rate of 1 mL/min at 25 °C column temperature at drug concentration 50 μg/mL |
 |
|
Figure 9: Chromatograms of Alprazolam, chlordaizepoxide, diazepam and nitrazepam in mobile phase A with a flow rate of 1mL/min at 25 °C column temperature at drug concentration 100 μg/mL |
 |
|
Figure 10: Chromatograms of Alprazolam, chlordiazepoxide, diazepam and nitrazepam in mobile phase D with a flow rate of 1mL/min at 25 °C column temperature at drug concentration 100 μg/mL |
 |
|
Figure 11: Chromatogram of clobazam in mobile phase A with a flow rate of 1 mL/min at 25 °C column temperature |
 |
|
Figure 12: Chromatogram of clonazepam in mobile phase A with a flow rate of 1 mL/min at 25 °C column temperature |
 |
|
Figure 13: Chromatogram of flurazepam in mobile phase A with a flow rate of 1 mL/min at 25 °C column temperature |
 |
|
Figure 14: Chromatogram of midazolam in mobile phase A with a flow rate of 1mL/min at 25 °C column temperature |
 |
|
Figure 15: Chromatograms of clobazam, clonazepam, flurazepam and midazolam in mobile phase B with a flow rate of 1mL/min at 25 °C column temperature at drug concentration 150 μg/mL |
 |
|
Figure 16 Chromatograms of clobazam, clonazepam, flurazepam and midazolam in mobile phase C with a flow rate of 1mL/min at 25 °C column temperature at drug concentration 150 μg/mL |
 |
|
Figure 17: Chromatograms of clobazam, clonazepam, flurazepam and midazolam in mobile phase A with a flow rate of 1mL/min at 25 °C column temperature at drug concentration 150 μg/mL |
 |
|
Figure 18: Chromatograms of clobazam, clonazepam, flurazepam and midazolam in mobile phase D with a flow rate of 1mL/min at 25 °C column temperature at drug concentration 150 μg/mL |
 |
|
Figure 19: Chromatogram of the encountered forensic sample in mobile phase A |
 |
|
Figure 20: Chromatogram of the control diazepam in mobile phase A |
 |
|
Figure 21: Gas chromatograph (TIC) of Diazepam (forensic) sample |
 |
|
Figure 22: Mass spectra of Diazepam (forensic) sample at retention time 15.54 minute |
 |
|
Figure 23: Mass spectra of Diazepam (forensic) sample at retention time 16.38 minute |
 |
|
Figure 24: Mass spectra of Diazepam (forensic) sample at retention time 16.83 minute |
 |
|
Figure 25: Mass spectra of Diazepam (forensic) sample at retention time 17.00 minute |
 |
|
Figure 26: Mass spectra of Diazepam (forensic) sample at retention time 17.39 minute |
 |
|
Figure 27: Mass spectra of Diazepam (forensic) sample at retention time 17.54 minute |
 |
|
Figure 28: Mass spectra of Diazepam (forensic) sample at retention time 17.88 minute |
 |
|
Figure 29: Mass spectra of Diazepam (forensic) sample at retention time 18.00 minute |


