Open Access
Research Article
Max Screen >>
ISSN: 2348-9804
Copyright: © 2017 Benvenuto K. This is an open-access article distributed under the terms of the Creative Commons Attribution License, which permits unrestricted use, distribution, and reproduction in any medium, provided the original author and source are credited.
Related article at Pubmed, Google Scholar
Synthetic cannabinoids (SCs) present a multitude of problems in terms of maintaining up-to-date methods of detection. They are novel psychoactive substances originally synthesized for medical use and research purposes. Abuse has demonstrated a variety of effects ranging from euphoria to aggressive behavior and death. The marketing, similar naming, and described pharmacological interactions create the dangerous and false perception that SCs are similar to, or the same as, tetrahydrocannabinol in cannabis products.
This research focused on the optimization and development of a sample preparation, chromatography and mass spectrometry method to detect and quantify seven SCs in urine, plasma, and gummy bears. The method was successfully applied to 17 authentic urine case samples. Protein precipitation and SPE were used to prepare samples for two dimensional liquid chromatography tandem mass spectrometry (2D LC/MS-MS) analysis. The final chromatography method utilized an ACQUITY UPLC BEH C8 2.1 x 30mm, 10μm trap column with an ACQUITY UPLC HSS T3 analytical column 2.1 x 150mm, 1.7 μm.
The urine calibration curve produced a linear dynamic range (LDR) of 0.05-2.5ng/mL for UR-144 5-COOH and AB-PINACA 5-COOH and 0.05-5ng/mL for the other five synthetic cannabinoids. R2 values included 0.992 and 0.993 for UR-144 5-COOH and AB-PINACA 5-COOH, respectively and 0.995 or above for XLR-11, 5F-PB-22, AM-2201 4-hydroxypentyl metabolite, JWH-018, and JWH-018 5-hydroxypentyl metabolite. SCs were detected at varying concentrations in all 17 case samples examined. Plasma and gummy bear calibration curves had a LDR of 0.05-10ng/mL or 0.05-2.5ng/mL with R2 values above 0.995. All recovery values were greater than 80% with the exception of 63% recovery for AB-PINACA 5-COOH in the gummy bear matrix. Suppression effects of 8%, 18.9%, and 6.6% were observed for urine, plasma, and gummy bears, respectively. Overall, a sensitive, specific, and reliable method was developed for efficient and rapid analysis of SCs at trace levels.
Keywords: 2D LC/MS-MS; Multidimensional chromatography; Liquid chromatography; Synthetic cannabinoids (SCs); Urine; Plasma; Edibles; Gummy bears; Solid phase extraction; Trace level analysis
Synthetic cannabinoids are novel psychoactive compounds that have become increasingly popular with a dramatic expansion in the number of compound types since they were first used illicitly. In the United States there were only two synthetic cannabinoid compounds reported in 2009, but in 2015 the number of new SCs reported increased to 84 [1]. Synthetic cannabinoids are altered structures of illegal substances and typically include a powder dissolved in a solvent sprayed onto an herbal substance [2]. These compounds are commonly termed "Spice," "K2," and "SCs" [2-4]. SCs were originally synthesized for research purposes, as they are believed to have potential medical use [3]. They are sold on the Internet, in head shops, gas stations, truck stops, and convenient stores in the form of incense, potpourri, and/or aromatherapy products [3,5]. Administration has been reported orally, rectally, and via vaporization with liquids utilized in electronic cigarettes. The primary method of administration is smoking [6]. SCs elicit effects similar to those associated with the active ingredient in cannabis, tetrahydrocannabinol. Euphoria, relaxation, increased creativity, tingling, and calmness are a few acute symptoms that have been described to be associated with SC use with death the most significant outcome [3]. As a response to the continued legislation efforts, SC manufacturers are rapidly synthesizing new synthetic cannabinoid compounds, which negatively impact maintenance of up-to-date drug testing, the development of certified reference materials, legislative action, and the progress on research and treatment methods [7,8].
There are several detection techniques that have been used to screen for synthetic cannabinoids with both preliminary and confirmative methods becoming outdated as new compounds are synthesized. Sample preparation of synthetic cannabinoids ultimately depends on the matrix. Typical sample preparation in SC urine and plasma analysis includes solid phase extraction (SPE) or liquid-liquid extraction (LLE) [9-11]. The analysis of these compounds in edibles, particularly gummy bear candy, has not been investigated. However, there have been studies performed on edibles to analyze other compounds of interest such as dyes and natural cannabinoids [12].
Liquid chromatography tandem mass spectrometry (LC/MS-MS) has played a major role in detecting new and existing synthetic cannabinoids [7,9,13,14]. A two-dimensional (2D) LC format can be easily implemented from a one dimensional (1D) LC instrument. The main difference in appearance between 1D and 2D is the addition of one or more columns, valves, and pumps. 2D chromatography techniques that implement AT-column dilution and trap/elute concepts focus on trapping analytes of interest onto the trap column, to then perform a more efficient separation of those analytes on the analytical column The additional pump may be used to provide the AT-column dilution effect pumping an aqueous component into a mixture with the organic sample from the injection port enabling the injection of 100% organic samples [15]. Through loading optimization of flow rates, chemistry, and additives, the target analyte can be trapped with maximum peak trapping and minimal breakthrough [15]. Furthermore, 2D analysis provides the opportunity to perform a micro-extraction protocol where analysts can complete chromatography optimization in a short time frame [16]. The combination of both dimensions is useful in providing efficient resolution and developing sensitive, specific, and robust methods to detect SCs. These factors are particularly beneficial with the continuous synthesis of new SC compounds.
The objective of this research was to develop a reliable, sensitive, and selective multidimensional chromatography method to successfully detect and quantify seven synthetic cannabinoids in urine, plasma, and edible samples. Rapid sample preparation methods were explored to efficiently carry out this objective utilizing a 2D LC/MS-MS instrumentation technique.
This research focused on seven synthetic cannabinoids: XLR-11, AB-PINACA 5-pentanoic acid metabolite, UR-144 5-pentanoic acid metabolite, 5F-PB-22, AM-2201 4-hydroxypentyl metabolite, JWH-018, and JWH-018 5-hydroxypentyl metabolite. The compounds were chosen for analysis based on a list developed of the top detected SCs and synthetic cannabinoid metabolites [14,17-22]. Standards and internal standards were obtained from Lipomed, Incorporated (Cambridge, MA, USA), Sigma-Aldrich (St. Louis, MO, USA), and Cerilliant Corporation (Round Rock, TX, USA). The solvents used were Optima grade, purchased from Thermo Fisher Scientific (Waltham, MA, USA), and consisted of methanol (MeOH), acetonitrile (ACN), acetone, ammonium hydroxide (NH4OH), hydrochloric acid (HCl), formic acid (FA), and phosphoric acid (H3PO4). The water used in this study was Milli-Q grade water and obtained from EMD MilliporeSigma (Darmstadt, Germany).
A total of 17 urine samples that were screened and tested positive for synthetic cannabinoids with a homogenous enzyme immunoassay test (Immunalysis Corporation Synthetic Cannabinoids kits 1 and 2) were collected from Clinigen, Incorporated (Woburn, MA, USA). Negative urine samples were obtained from a non-drug using volunteer.
An ACQUITY Ultra Performance Liquid Chromatography (UPLC)® (Waters Corporation, Milford, MA, USA) was utilized in 2D configuration. A 2D format was prepared with three pumps. The first pump was used to create AT-column dilution, which was produced with two streams – stream A loaded the samples from the injection loop into a 50μL mixer while stream B pumped the loading solvent into the mixer. The second pump was utilized for elution purposes. The fluidic pathway and pump configuration can be visualized in Figure 1. The third pump (not pictured in Figure 1) performed reconditioning and re-equilibration steps. The detector was a tandem MS, Xevo TQD (Waters Corporation) with positive electrospray ionization (ESI). For each compound, the most intense transition was selected and optimized for quantification and the second most intense transition was used as a qualifier (Table 1). Collision energy (CE) and cone voltage were also optimized for each compound. Constant MS parameters included capillary voltage 3.0kV, 150 °C source temperature, 550 °C desolvation temperature, desolvation gas and cone gas flow rates of 1100 L/hr and 50 L/hr, respectively.
Three 1ng/mL solutions of the seven SCs tested in MeOH, ACN, and water were assessed on different trap and analytical columns with various loading and elution conditions. All columns were from Waters Corporation. The analytical columns included ACQUITY UPLC BEH (ethylene bridged hybrid) C18, 2.1 x 50mm, 1.7μm, phenyl, 2.1 x 50mm, 1.7μm, and HSS T3 (high strength silica with tri-functional C18 bonding), 2.1 x 150mm, 1.7μm. The two trap columns assessed were an ACQUITY UPLC HLB (hydrophilic-lipophilic balance), 2.1 x 30mm, 20 μm and BEH C8 (Bridge-Ethyl Hybrid Silica particle with C8 ligand), 2.1 x 30mm, 10μm.
The 1ng/mL samples were run over night with combinations of different trap columns and additives in an automated process completing chromatography method optimization in 12 hours. Formic acid was used to create pH 3 conditions and NH4OH for pH 10. MeOH and ACN at pH 3 and 7 were evaluated as elution solvents with the C18 column. MeOH at pH 3 and 7 was then evaluated with the phenyl column. It was determined that MeOH was a better elution solvent as ACN signal intensities were lower and peak distortion was prominent. Overall, it was determined that a MeOH standard solvent, C8 trap column, pH 10 loading conditions, and a pH 3 MeOH elution solvent were the optimal chromatography conditions for SC analysis. While the C18 column was initially chosen, during extraction evaluation it was ultimately determined that a HSS T3 analytical column would be the best choice for analyzing SCs. The HSS T3 column demonstrated stronger signals, tighter bandwidths, and significantly reduced peak distortion. The final conditions developed and optimized for this method, providing the best signal intensity, resolution, and peak shape, are summarized in Table 2.
Considering the matrices explored, SPE was the method of choice in this research. While chromatography method optimization showed signs of SCs displaying acidic properties, several sorbents were evaluated. These included 150mg, 6cc Oasis® MCX (cation exchanger), Oasis® MAX (anion exchanger), and Oasis® HLB cartridges (Waters Corporation).
Two different 1ng/mL solutions were prepared for the first extraction optimization. One set contained MeOH with ACN as the other solvent. These solutions were used as unextracted standards, which were placed directly into a vial for analysis. They were also prepared as the sample to be extracted. A conditioning step with 2mL of MeOH followed by 2mL MilliQ water was performed in each SPE method.
Comparison of the MCX and MAX methods concluded the MAX sorbent to provide a more efficient extraction in isolating the SCs. The initial extraction performed assessed the difference between the sample loading at pH 3, 7, and 10. The MAX application to pH 3 loaded samples in MeOH had 10X signal intensities compared to that produced from MCX with reduced noise and better Gaussian peak shapes. It was also concluded that MeOH was the best solvent to utilize in comparison to ACN.
Further assessment of the MCX collections determined there to be a high percentage of some SCs eluted in wash 2 (W2), demonstrating acidic behavior. In the evaluation of the MAX collections, it appeared that half of the analytes were binding to the ion exchanger portion while the other half were binding to the reversed phase component. This observation described potential zwitterion properties of SCs suggesting further extraction optimization to be necessary. Therefore, an extraction was performed on an HLB cartridge using elution solvents of ten different MeOH percentages – 10, 20, 30, 40, 50, 60, 70, 80, 90, and 100% MeOH in water loaded on ten cartridges yielding ten separate collections. This experiment was performed three times with elution pH at 3, 7, and 10. The pH 10 elution portrayed zero breakthrough up until 80-90% MeOH while the pH 7 and pH 3 elutions demonstrated breakthrough at lower percentages of MeOH. However, recovery percentages of the carboxylic acid SCs at pH 10 were spread evenly across all MeOH elution solutions. As a result, the original MAX method was altered to include different W2 and elution solvents (Table 3). Two elution steps were implemented and collected to ensure the most efficient extraction of the zwitterion analytes. The signal intensity of the extract obtained from the MAX final method displayed a significantly larger recovery in comparison to that obtained with the unextracted standard confirming the extraction efficiency of the MAX final method in contrast to the original MAX method used.
The optimized urine/plasma sample preparation consisted of a protein crash, dilution, and SPE. The protein crash was performed by adding 2mL (urine preparation) or 3mL (plasma preparation) of MeOH, 50μL phosphoric acid, and 2mL of urine or plasma to a 20mL glass centrifuge tube. After capping and shaking the samples manually for approximately three seconds, they were centrifuged for five minutes at 3900rpm. The supernatant was poured off into 100mL water (forming a dilution of less than 5%) and 2mL of formic acid was added to create the optimized pH 3 loading conditions. The 100mL samples were then loaded onto an MAX SPE cartridge with a 100mL attachment. A negative pressure pump was used to help load the samples on the column (~10-15psi). Pressure on the wash and elution steps was maintained ~5psi. A volume of 20μL internal standard JWH-(018) d11 was added to each unextracted and extracted 2mL sample post extraction (1ng/mL) before 2D LC/MS-MS analysis to evaluate extraction efficiency.
The complexity of the gummy bear candy matrix required a different type of sample preparation before SPE. The gummy bears were cut into fourths, creating ~0.5g pieces. Approximately 1g was added to four 20mL glass vials with solutions of different volumes and percentages of MeOH, ACN, or acetone in water and assessed at room temperature, after sonication, and after heating on a hot plate. The objective was to completely dissolve the gummy bear sample into solution. Heating provided more desirable results overall. After 15 minutes of heating (from 60-80 °C), the gummy bears in the 5mL solutions of 70% MeOH or ACN in water were completely dissolved. The presence of water seemed to play a major role in the gummy bear dissolution therefore solutions of 100% water and 50/50 water/organic were prepared and evaluated. Additionally, the heating method was compared to homogenization with a Precellys Evolution homogenizer (Bertin Technologies, Montigny-le-Bretonneux, France). Solutions of 100% MeOH, 100% Acetone, 100% ACN, 100% water, 50% ACN in water, and 50% MeOH in water were prepared. The samples with 50% organic and 100% water in both methods appeared to produce an efficient breakdown of the complex gummy matrix.
Solid phase extraction was performed to compare the extraction rates of the 100% water, 50% MeOH, and 50% ACN homogenized and heated solutions. After dissolution, the samples were centrifuged at 3900rpm for five minutes. The supernatant was poured off into 100mL of water, which was then loaded onto the conditioned MAX SPE cartridges. The solutions containing 100% water took longer to load through the column while the 50% organic samples only took 10-15 minutes. The 50% organic samples were prepared for LC analysis. SPE was completed in the same manner as with plasma and urine samples. The 2D LC/MS-MS results ultimately concluded the method dissolving 1g of gummy bear sample in 5mL of 50% MeOH in water by heating to be the optimal sample preparation technique (Figure 2).
For quantitation purposes, a calibration curve was produced for all matrices in addition to producing a water extract and unextracted standard curve on the same day each matrix was extracted. Eight calibrators were prepared for each curve – 0.05, 0.1, 0.25, 0.5, 1.0, 2.5, 5.0, and 10ng/mL. Calibrators utilized for the water, urine, and plasma extracted curves contained 100% MeOH as a solvent. Spiking solutions utilized as unextracted standards contained 50% MeOH + 0.5% formic acid and 50% MeOH + 0.5% NH4OH to mimic the SPE elution conditions. The urine calibration curve solutions contained 2mL of negative urine, 2mL of the respective calibrator, and 50μL of phosphoric acid. The plasma calibration curve was generated in the same manner; however 3mL of the respective calibrator solution was used. In the preparation of the edible curve, 1g of gummy bears was added to eight 20mL glass vials with 2.5mL of water and 2.5mL organic solution (2mL of the respective calibrator and 500μL MeOH).
Three calibration curves were generated for each matrix. An unextracted standard curve, a water extract curve, and a urine/plasma/gummy bear extract curve were prepared utilizing the eight calibrators. A 1ng/mL recovery sample and a blank were also analyzed with the water and urine/plasma/gummy bear curves. A calibration curve equation was calculated for each compound in each matrix to determine the best fit for each. Table 4 portrays the linear dynamic range, limit of detection (LOD), limit of quantitation (LOQ), recovery and R2 values of the urine/plasma/gummy bear curve for each compound.
Recovery was calculated and matrix effects were assessed for all three matrices. Recovery values were determined using matrix match ion ratios calculated from area counts of the internal standard and calibrators. A recovery value and matrix effects for the water curve that was evaluated on the same day as each studied matrix were evaluated in addition to the recovery value and matrix effects from the urine, plasma and gummy bear curves. The calculated suppression effects from the water, urine, and gummy bear extracts were 7%, 8%, and 6.6% respectively. Plasma extracts displayed 18.9% suppression, which were the highest matrix effects of all three matrices analyzed. The relatively low recovery and R2 values, smaller LDRs, and matrix effects observed for the carboxylic acid SCs suggested an alternative sample preparation and chromatography approach may be more effective for these compound types in all three matrices. Overall, the suppression effects were low and the recovery values for all matrices were excellent, demonstrating the strength of the sample preparation and chromatography methods developed and optimized in this research.
All 17 urine specimens were prepared and analyzed with the optimized sample preparation and chromatography methods. All samples were positive for SCs (Table 5). Fourteen samples contained UR-144 5-COOH and AB-PINACA 5-COOH was detected in 11 samples. AM-2201 4-hydroxypentyl and 5F-PB-22 were detected in 12 case samples but seven of the values were unable to be quantified. It was interesting to note that JWH-018, AB-PINACA 5-COOH, AM-2201 4-hydroxypentyl, and 5F-PB-22 were detected in several samples as majority of these samples were screened positive with an immunoassay kit that was described to detect XLR-11, UR-144 and their major metabolites [23]. This portrays the importance of developing a method for new and existing SCs in addition to demonstrating the issue of illicit substances going undetected in existing screening methods for biological fluids. Figure 3 represents the chromatograms and concentrations for all six SCs detected in Case 9 with a comparison to the unextracted standards.
A 2D LC/MS-MS method with an optimized sample preparation protocol was successfully developed and applied to analyze, detect, and quantify seven synthetic cannabinoids in urine, plasma, and edible samples. The overall sample preparation time required for each matrix assessed in this research was less than one hour including protein precipitation, heating, and SPE steps. Urine samples totaled 15 minutes of preparation while plasma and edible samples were completed in approximately 30 minutes.
A calibration curve was developed for each analyte in each matrix assessed with high R2 and recovery values, remarkable linear dynamic ranges (LDR), and low suppression effects. A variety of SCs and concentrations were detected in all 17 urine case samples.
Ultimately, this research demonstrated the ease of implementing two-dimensional technology in a variety of applications, such as forensic casework, as displayed with the urine case samples analyzed with this method. A faster sample preparation technique with high extraction efficiency was developed, eliminating the need for the time consuming evaporation and reconstitution steps required in most SPE protocols. Method adjustments such as those accommodating for the carboxylic acid SCs in combination with this method will provide the ability to detect many synthetic cannabinoids with specific results and significantly lower LOD and LOQ values.
I would like to extend gratitude to Waters Corporation and the Boston University Biomedical Forensic Science Program for providing me with an internship opportunity and the supplies in which I was able to perform this research. I would also like to extend thanks to Clinigen, Inc. for providing me with urine case samples and Sean Kocur, my third reader, for his advice and assistance.

![]()

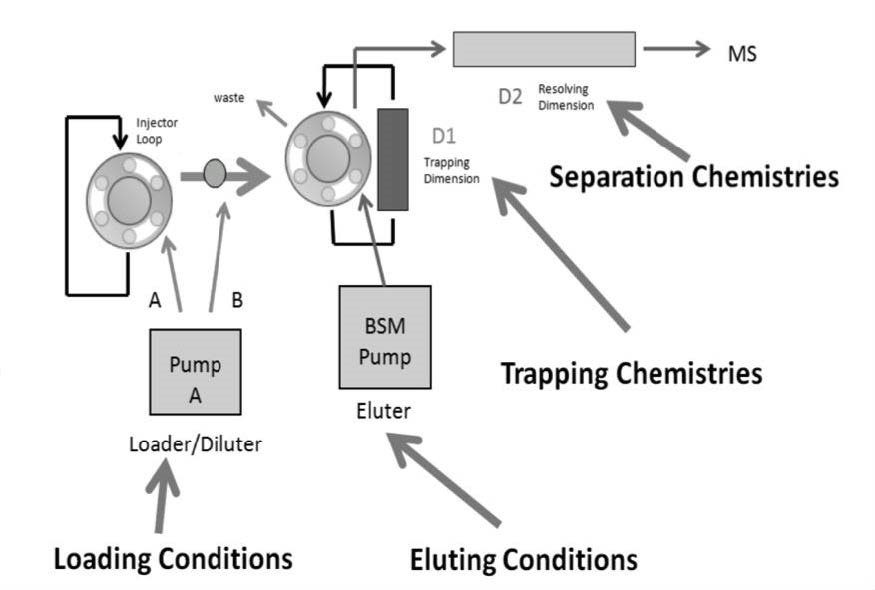 |
| Figure 1: 2D-LC Fluidic Pathway |
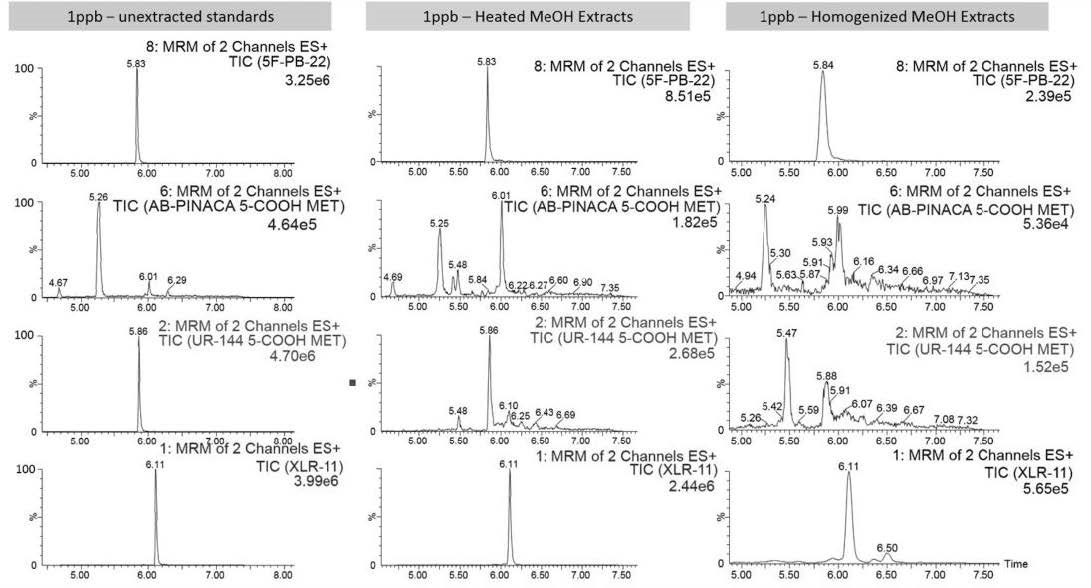 |
| Figure 2: Edible Sample Preparation Optimization - Heated vs. Homogenized 50% MeOH in Water Samples |
 |
| Figure 3: Case 9 Results - Chromatograms of All Analytes Detected |
| Compound | Ion Mode | Precursor ion | Cone Voltage | Production | CE |
|---|---|---|---|---|---|
| AM-2201 4-hydroxypentyl metabolite | ESI+ | 376.2 | 30 | 155.0 | 25 |
| 127.0 | 30 | ||||
| JWH-018 | ESI+ | 342.2 | 30 | 155.0 | 30 |
| 127.0 | 30 | ||||
| JWH-018 5-hydroxypentyl metabolite | ESI+ | 358.2 | 35 | 155.0 | 30 |
| 127.0 | 30 | ||||
| XLR-11 | ESI+ | 330.2 | 40 | 125.1 | 25 |
| 97.0 | 30 | ||||
| 5F-PB-22 | ESI+ | 377.2 | 20 | 232.1 | 10 |
| 144.0 | 30 | ||||
| UR-144 5-pentanoic acid metabolite | ESI+ | 342.2 | 30 | 125.0 | 20 |
| 83.0 | 30 | ||||
| AB-PINACA 5-pentanoic acid metabolite | ESI+ | 361.20 | 25 | 344.2 | 10 |
| 316.2 | 15 | ||||
| JWH-018 D11 | ESI+ | 353.2 | 30 | 155.0 | 25 |
| 127.0 | 30 | ||||
| Table 1: MRM Compound Optimization Table. Transitions were determined for all standards and the internal standard. | |||||
| UPLC Conditions | AQUITY UPLC with "Trap and Elute" and At-Column Dilution Conditions |
|---|---|
| Injection Volume | 200μL |
| Loading Conditions | MilliQ water + 2% NH4OH (pH 10) |
| Loading Flow Rate | 2 mL/min |
| At-column dilution | 5% |
| Trap Column | ACQUITY UPLC C8, 2.1 x 30mm, 10μm |
| Analytical Column | ACQUITY UPLC HSS T3, 2.1 x 150mm, 1.7μm |
| Analytical Column Temperature | 70 °C |
| Mobile phase A | Water + 0.5% Formic Acid |
| Mobile phase B | MeOH + 0.5% Formic Acid |
| Elution Gradient | 3 minute linear gradient 5% to 95% Mobile Phase B |
| Elution flow rate | 0.600mL/min |
| Wash/Recondition Step | 2 minute MeOH/ACN/Acetone wash with 2mL/min flow rate |
| Wash/Recondition Step Line A | MilliQ water + 2% NH4OH |
| Wash/Recondition Step Line B | MeOH/ACN/Acetone wash |
| Total Run Time | 12 minutes |
| Table 2: Final Chromatography Conditions | |
| Cartridge | MAX | |
|---|---|---|
| Condition 1 | 2mL MeOH | |
| Condition 2 | 2mL Water | |
| Load | Sample in 100mL water at pH 3 | |
| Wash 1 | 2mL water + 5% NH4OH | |
| Wash 2 | 2mL 70% MeOH in water + 5% NH4OH | |
| Elution 1 | 1mL 100% MeOH in water + 5% NH4OH | Pool elution 1 & 2 together for a total 2mL sample for analysis |
| Elution 2 | 1mL 100% MeOH in water + 5% FA | |
| Table 3: Final MAX Solid Phase Extraction Method Protocol | ||
| Compound | Polynomial Type |
Weight | Linear Dynamic |
LOD (ng/mL) |
LOQ (ng/mL) |
R2 | Recovery (%) |
|
|---|---|---|---|---|---|---|---|---|
| Urine | XLR-11 | Quadratic | 1/X | 0.05-5ng/mL | <0.005 | 0.005 | 0.997 | 98 |
| UR-144 5-COOH | Quadratic | 1/X | 0.05-2.5ng/mL | 0.05 | 0.1 | 0.992 | 81 | |
| JWH-018 | Quadratic | 1/X | 0.05-5ng/mL | <0.005 | 0.005 | 0.995 | 97 | |
| JWH-018 5-hydroxypentyl | Linear | 1/X | 0.05-5ng/mL | <0.005 | 0.005 | 0.995 | 94 | |
| AB-PINACA 5-COOH | Quadratic | 1/X | 0.05-2.5ng/mL | 0.05 | 0.1 | 0.993 | 104 | |
| AM-2201 4-hydroxypentyl | Quadratic | 1/X | 0.05-5ng/mL | <0.005 | 0.005 | 0.997 | 99 | |
| 5F-PB-22 | Quadratic | 1/X | 0.05-5ng/mL | 0.00005 | 0.0005 | 0.996 | 106 | |
| Plasma | XLR-11 | Quadratic | 1/X | 0.05-10ng/mL | <0.005 | 0.005 | 0.996 | 95 |
| UR-144 5-COOH | Quadratic | 1/X | 0.05-10ng/mL | 0.05 | 0.05 | 0.995 | 96 | |
| JWH-018 | Quadratic | 1/X | 0.05-10ng/mL | <0.005 | 0.005 | 0.996 | 89 | |
| JWH-018 5-Hydroxypentyl | Linear | 1/X | 0.05-10ng/mL | 0.05 | 0.1 | 0.995 | 89 | |
| AB-PINACA 5-COOH | Quadratic | 1/X | 0.05-10ng/mL | 0.05 | 0.1 | 0.995 | 85 | |
| AM-2201 4-hydroxypentyl | Quadratic | 1/X | 0.05-10ng/mL | <0.05 | 0.05 | 0.996 | 88 | |
| 5F-PB-22 | Quadratic | 1/X | 0.05-10ng/mL | <0.005 | 0.005 | 0.998 | 102 | |
| Gummy Bears |
XLR-11 | Quadratic | 1/X | 0.05-10ng/mL | <0.05 | 0.05 | 0.996 | 113 |
| UR-144 5-COOH | Quadratic | 1/X | 0.05-10ng/mL | 0.1 | 0.5 | 0.995 | 94 | |
| JWH-018 | Quadratic | 1/X | 0.05-10ng/mL | <0.005 | 0.005 | 0.995 | 105 | |
| JWH-018 5-hydroxypentyl | Linear | 1/X | 0.05-10ng/mL | <0.005 | 0.005 | 0.995 | 106 | |
| AB-PINACA 5-COOH | Quadratic | 1/X | 0.05-10ng/mL | 0.05 | 0.5 | 0.997 | 63 | |
| AM-2201 4-hydroxypentyl | Quadratic | 1/X | 0.05-2.5ng/mL | 0.05 | 0.5 | 0.997 | 104 | |
| 5F-PB-22 | Quadratic | 1/X | 0.05-2.5ng/mL | <0.005 | 0.005 | 0.996 | 92 | |
| Table 4: Calibration Curve Results | ||||||||
| Case Number |
XLR-11 | UR-144 5-COOH |
JWH-018 | JWH-018 5-OH | ABPINACA 5-COOH |
AM-2201 4-OH | 5F-PB-22 |
|---|---|---|---|---|---|---|---|
| 1 | 0.037ng/mL | <LOQ | ND | ND | 115.76ng/mL | ND | 0.009ng/mL |
| 2 | 0.019ng/mL | 0.47ng/mL | ND | ND | ND | 0.0080ng/mL | ND |
| 3 | ND | <LOQ | ND | ND | 30.42ng/mL | ND | ND |
| 4 | 0.011ng/mL | ND | ND | ND | ND | ND | <LOQ |
| 5 | 0.021ng/mL | <LOQ | ND | ND | 73.35ng/mL | ND | ND |
| 6 | 0.041ng/mL | ND | 0.029ng/mL | ND | ND | <LOQ | 0.0012ng/mL |
| 7 | ND | <LOQ | 0.019ng/mL | ND | ND | ND | 0.0023ng/mL |
| 8 | 0.020ng/mL | <LOQ | 0.038ng/mL | ND | ND | ND | 0.0026ng/mL |
| 9 | 0.030ng/mL | 0.23ng/mL | 0.037ng/mL | ND | 0.12ng/mL | 0.012ng/mL | 0.013ng/mL |
| 10 | ND | ND | ND | ND | 0.29ng/mL | ND | ND |
| 11 | 0.012ng/mL | 1.9ng/mL | ND | ND | 29.15ng/mL | ND | <LOQ |
| 12 | ND | 0.27ng/mL | ND | ND | 3.53ng/mL | <LOQ | ND |
| 13 | ND | 0.27ng/mL | ND | ND | 3.53ng/mL | <LOQ | ND |
| 14 | 0.010ng/mL | 1.7ng/mL | ND | ND | 0.17ng/mL | ND | ND |
| 15 | ND | <LOQ | ND | ND | ND | ND | ND |
| 16 | 0.011ng/mL | 0.34ng/mL | 0.011ng/mL | ND | 45.13ng/mL | ND | <LOQ |
| 17 | 0.014ng/mL | 1.2ng/mL | 0.017ng/mL | ND | 0.75ng/mL | ND | <LOQ |
<LOQ: peak detected but not quantifiable Table 5: Urine Case Sample Results and Quantitation |
|||||||


