Open Access
Research Article
Max Screen >>
ISSN: 2348-9804
Copyright: © 2017 Lai PS. This is an open-access article distributed under the terms of the Creative Commons Attribution License, which permits unrestricted use, distribution, and reproduction in any medium, provided the original author and source are credited.
Related article at Pubmed, Google Scholar
(74 males and 74 females) ranging in age from 18 to 25 years were taken from Campus Kuala Lumpur of National University of Malaysia (UKMKKL). A total of twelve biometrics based on Iannarelli’s method as well as ear length and ear width were used as measurements. Statistical analysis indicated that left and right ears had no significant difference (p > 0.05). Gender difference was found to be highly significant for nine out of fourteen ear biometrics (p < 0.05). However, there were only five out of fourteen ear biometrics had significant difference between Chinese and Malays (p < 0.05). Statistical analysis had also indicated that differences among ages for each ear biometrics were insignificant and no clear correlation between ear biometrics and ages was obtained (p > 0.05). Formulae for gender and race estimation were obtained by using Classification and Regression (C & R) Tree. Formulae of ear length had the highest accuracy (78.7%) for gender estimation.
However, the accuracy was achieved up to 92.9% when the combination of ear biometrics was used. In race estimation, only one ear biometric was able to form a formula with a single deviation point. In fact, most of the ear biometrics did not provide any useful formulae in race estimation if compared to gender estimation. In conclusion, this study demonstrated that ear biometrics played an important role in gender estimation so as to enable ear print to be accepted as strong evidence in the court of law in Malaysia.
Keywords: Forensic science; Ear print identification; Ear biometrics; Iannarelli method
Ear print identification is a matching process between the ear prints from crime scene and the ear prints from database or suspects (Champod 2009) [1]. Individualization of the ear prints is established by finding the significant similarities of the individual characteristics to preclude the probability of coincidence matching. Ear biometric becomes identification method based on biological and physiological characteristics with high stability, universality, uniqueness, non-invasiveness and extractability (Singh & Purkait 2009) [2]. The ear length of a normal adult is ranging from 55.0 mm to 65.0 mm while the ear width is ranging from 50% to 60% of its length (Jung & Jung 2003; Kalcioglu., et al. 2003) [3,4]. However, the increase in ear dimension at different progressing of age periods is basically due to growth, gravitational effects and diminutive tensile strength of connective tissue (Liu 2008) [5]. Although this might affect the chance of finding a print in a database after a long period of time, it is unlikely to make the ears less unique. In addition, the natural changes in the ears are small enough and suitable to be used in forensic practice and legal prosecution (Meijerman., et al. 2006a) [6]. The unique ear print has been used in forensic medicine and criminal investigations as an identification proof, for example, in airplane crashes or crime scenes. It has been used as tamper-proof complementary evidence to the fingerprint and DNA evidence because the courts of law required two or more types of evidence to place a suspect at a scene of crime (Nanni & Lumini 2009) [7]. The excellent evidential value of ear prints is identified with the higher level of inter-person variation and lower level of intra-person variation (Meijerman., et al. 2006a) [6].
In 1989, the first manual method was used in Iannarelli’s first study in which ten thousands of human ears were randomly selected in California. Uniqueness of ear characteristics was proved based on measuring the twelve distances between the specific points of the ears (Choras 2008) [8]. Iannarelli’s second study was regarding the differences of physiological ear features between identical and non-identical twins. The identical twins were proved to have similar but not identical ears physiological features especially in the concha and lobule areas (Rahman., et al. 2007) [9]. This uniqueness held true even in cases of triplets twins and quadruplets twins (Kieckhoefer., et al. 2006; Hurley., et al. 2007) [10,11].
Extraction methods of ear biometrics can be divided into photography methods and lifting methods. Photography methods used include camera-based photography, lateral cephalometric radiography, magnetic resonance imaging or computed tomography (Lugt 2000; Wang., et al. 2010) [12,13]. While lifting methods used include inkless impression kit, aluminium powder used with black gelatine lifter or lumibox mechanism (Kieckhoefer., et al. 2006; Meijerman., et al. 2006c; Alberink & Ruifrok 2007) [10,14,15]. On the other hands, analysis methods of ear biometrics can also divided into quantitative measurements and qualitative ear structures. Quantitative measurements used include twelve Iannarelli manual measurements, caliper measurements on length and width of ear, lobule, concha and tragus. There were some semi-automation and full automation methods mainly used for matching purpose, not for gender and race estimation, such as computed tomography, Neural network, force field transformation, geometric, iterative closest point etc. (Barut & Aktunc 2006; Hurley., et al. 2007; Purkait & Singh 2007; Sforza., et al. 2009; Wang., et al. 2010) [11,13,16-18]. While qualitative ear structures include the ear shape, lobule shape, presence of auricular tubercle and minutiaes (Barut & Aktunc 2006; Meijerman 2006; Chattopadhyay & Bhatia 2009; Singh & Purkait 2009) [2,16,19,20].
The purpose of this study was firstly to determine the level of significant difference and correlation between right and left ear biometrics as well as between age and ear biometrics. Secondly, this study was also to develop formulae to estimate the gender and race of an unknown individual by using ear biometrics since there was no similar study available for Malaysia population. The formulae could only be used in the same population in which the formulae developed from, which in this case a Malaysian population.
A total of 148 young adults, 74 subjects for each gender, from Campus Kuala Lumpur of National University of Malaysia (UKMKKL) with age ranging from 18 to 25 years old were selected. Two major ethnic chosen were Malays and Chinese following the ratio of target population with 100 (67.6%) and 48 (32.4%) subjects respectively. The subjects must be Malaysian young adults of pure Malays and Chinese who owns Malaysian identification card called “Mykad”. Subjects were confirmed healthy without any type of anomaly or congenital syndrome as well as never undergone any surgical procedure that could affect ear measurements (Singh & Purkait 2009) [2]. Any attachments to the ear such as earrings were needed to be taken off before photos were captured because it could generally extend the length of ear lobe and further influence the ear length (Sharma., et al. 2007) [21].
This study was approved by UKM Research Ethics Committee. Intelectual Property Rights (IPRs) Agreement and Consent Form were signed by subjects prior to the study. Subjects were then required to sit down with the head positioned in Frankfurt horizontal plane, namely a horizontal line connecting both inferior orbitale and tragion. Subjects were subsequently required to paste their ear slowly and lightly on the glass with fixed scale of 150 mm ± 1 mm (Lynn Peavey Company, US) as portrayed in Figure 1. Two photos of right ears and two photos of left ears were taken with Canon 350D Digital Single-Lens Reflex camera (Canon Inc., Japan) perpendicular to the subjects in enough lighting condition from 8:00 pm to 10:00 pm to avoid any diurnal changes. All photos of ears were printed out through Canon MP146 printer (Canon Inc., Vietnam) after normalizing accordingly with Iannarelli method.
The measurements involved were the twelve ear biometrics based on Iannarelli method, ear length and ear width. Measurements were taken using stainless steel ruler of 150 mm ± 0.5 mm (Penguin, China) in millimetre (mm) with one decimal place. One observer was only involved for the measurements so as to prevent any inter-observer error. They were repeatedly measured for three times in which their average values were used. Similar instruments and protocols were applied throughout the measurements in order to act as quality assurance in this study.
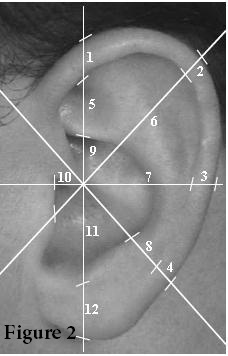
Biometric A (Iannarelli measurements) were obtained by putting Iannarelli Inscribed transparent card with eight lines that inclined in similar angle of 45o on top of the ear photos as portrayed in Figure 2 (Hurley et al. 2007) [11]. All measurements were named as Biometric A1, Biometric A2 and further until Biometric A12 such as indicated in Table 1. Ear length (Biometric EL) was the maximum distance of vertical line between top end of superior helix rim and bottom end of inferior lobule of ear. While ear width (Biometric EW) was the maximum distance between the most anterior end of helix rim and most posterior end of helix rim where a horizontal line, that cross perpendicularly with the line of ear length, was formed.
All biometrics were recorded as numerical data in tabular form and then analysed using Predictive Analytics Software (PASW) 18.0. Kolmogorov-Smirnov and Shapir-Wilks tests were carried out to determine the distribution normality. Independent groups t-test and one-way between-groups ANOVA test were used to determine whether there were any differences in biometrics. The p-value is the level of marginal significance within a statistical hypothesis test representing the probability of the occurrence of a given event. The significance level in all tests was p < 0.05. The numerical data from PASW 18.0 was then transferred into Statistical Package for Social Sciences (SPSS) Clementine 11.1. Classification and Correlation (C & R) Tree Modeling was used to estimate gender and race by forming formulae. The overall samples were randomly divided into 40% of training group, 40% of test group and 20% of validation group. The R-value denoted the correlation coefficient or power of the relationship between variables.
Table 1 showed the mean values, standard errors and p-values for each biometrics between left ear and right ear. By using Independent groups t-test, there was no statistically significance of bilateral differences for all of the ear biometrics where their significant values were p > 0.05. Among all the biometrics, Biometric A9 was closely to have significant differences between left and right ears with p > 0.05 in which 7.6 ± 0.1 mm and 7.9 ± 0.1 mm respectively. In addition, correlation analyses for the bilateral symmetry between left and right ears were all significant with p < 0.01 and r value ranging from 0.503 to 0.920. The highest correlation of bilateral symmetry involved the ear length with r = 0.920.
Comparative statistics with the mean values, standard errors, standard deviations and p- values for each biometrics between genders were tabulated in Table 2. By using independent groups t-test, there were statistically significance of gender differences for nine of the biometrics including biometrics A3, A4, A5, A6, A7, A11, EL and EW with p < 0.01 while biometrics A9 with p < 0.05. However, the other biometrics has no significant difference between genders. Classification formulae for gender were tabulated in Table 3. The accuracies of gender estimation following descending order were 78.7% for EL, 77.4% for biometric A6, 72.6% for biometric A5, 71.0% for biometric A11, 64.9% for biometric A4, 65.5% for EW, 63.2% for biometric A3 and 58.8% for biometrics A7. The best combination formulae were discovered for gender estimation with very high accuracy up to 92.9% as listed in Table 4. The best combination was the combination of five biometrics including A4, A6, A11, EL and EW.
Comparative statistics with the mean values, standard errors, standard deviations and p- values for each biometrics between races were shown in Table 5. By using independent groups t-test, there were statistically significance of gender differences for only six of the biometrics including biometrics A2, A4, A8, A10, A11 and A12 with p < 0.01 while biometric A2 with p < 0.05. However, most of the biometrics has no significant difference between races. Classification formulae for races were tabulated in Table 6. The race estimation using biometrics A4, A8, A10, A11 and A12 were all with moderately high accuracy of 67.9%, 62.5%, 68.2%, 69.3% and 69.3%. However, there were extremely large differences of accuracy between Chinese and Malays for all those biometrics mentioned. Biometric A12 was the only one that successfully providing the formula with single deviation point for race estimation. In fact, most of the biometrics did not provide any useful formulae compared to gender estimation.
Table 7 showed the comparative statistics with the mean values, standard errors, standard deviations and p-values for each biometrics among ages. Sample size was composed of 58 ears with age of 19, 60 ears with age of 20, 56 ears with age of 21, 66 ears with age of 22 and 56 ears with age of 23. By using one-way between-groups ANOVA, there was no statistically significance of age differences for all the ear biometrics with p > 0.05. In addition, correlation analyses showed no relationship between biometrics and age. There was an exception for biometrics A3 and A4 with p < 0.01, yet, the relationships were reverse and too low with r = -0.145 and r = -0.157 respectively. The only closely significant positive relationship could be seen on biometric A9 where r = 0.108, p = 0.062.
There was no study regarding ear biometrics being done based on Malaysian population throughout the decades. In this study, the results found that ear biometric was statistically insignificant for bilateral differences. This showed that left ear and right ear of young adult in Malaysia were generally similar in term of measurements, shapes and anatomical structures. However, it could be differentiated between left and right ears with other descriptive method such as anatomical positioning of the ear.
Results of this study was supported by most of the previous studies in which bilateral differences were not statistically significant for ear length and ear width where the differences were all less than 1 mm although significant levels might be different (Barut & Aktunc 2006; Bozkır., et al. 2006; Purkait & Singh 2007; Sforza., et al. 2009; Yamada 2009; Wang., et al. 2010) [13,16-18,22,23]. This bilateral insignificance showed that intra-person variation was lower than inter-person variation. There might be some exceptions that caused by different population, gender, sample size and range of ages used in different studies. In fact, pediatric more regularly having asymmetry in ear biometrics if compared to adulthood while male more often to show asymmetry in ear biometrics if compared to female (Alexander., et al. 2010; Wang., et al. 2010) [24,13].
Ear symmetry and ear dimension were affected by human karyotype especially on chromosomes 5q and 22q11 in which controlling the development of first and second branchial arches responsible for ear growth (Chattopadhyay & Bhatia 2009; Sforza., et al. 2009) [18,20]. In addition, environmental stress from para-genetic factors such as cigarette smoking and drinking alcohol during pregnancy also contributed to the fluctuating asymmetry of ear biometrics. Ear length was proven to have lowest level of fluctuating asymmetry among other parts of body (Zadzinska 2007) [25]. The correlation coefficient for bilateral symmetry for ear length in present study was as high as previous studies such as Alexander., et al. (2010) and Liu (2008) [5,24]. Nevertheless, bilateral comparison could still be done with qualitative methods based on ear structures without considering symmetry level of ear biometrics (Singh & Purkait 2009) [ ].
On the other hand, gender difference was statistically significant, p < 0.05 for nine of the ear biometrics. The significant difference between gender was supported by the study under Karl Marx-Leipzig University (Lugt 2009) [26]. These biometric were all higher in males than females and being proven by previous studies (Barut & Aktunc 2006; Liu 2008; Sforza., et al. 2009; Yamada 2009; Wang., et al. 2010) [5,13,16,18,23]. One of the main factors was due to the difference of puberty period between genders. The age of puberty in male was 1 year later than female in which allowing them to have extra time for ear growth (Rutty., et al. 2005) [27]. Another factor was regarding the sex dimorphism process that affected by genetic materials possessed in different gender. This sex dimorphism process has been started since postnatal growth and causing different ear growth between genders (Sforza., et al. 2009) [18].
In addition, full ear length and ear width were achieved during different age between genders. For example, males have at least extra one-year or two-year time for vertical ear growth while at most four-year time for horizontal ear growth if compared to females. Other than genetic factor, males and females react in differently towards the environmental disturbances. For example, females with two chromosomes X react in slower manner and lower intensity towards environmental stress in growth (Zadzinska 2007) [25]. Furthermore, the difference in ear biometric between genders was also caused by ear expansion that appeared to be off to a slower start in females as compared with males. For example, ear expansion from age range of 12 – 15 years old to 19 – 30 years old caused an increase of ear length and ear width in respectively about 4.1 mm and 1.8 mm for males and in about 0.9 mm and 0.8 mm. This showed that increase in ear length was much higher than increase in ear width and this difference was in different rate between males and females (Meijerman., et al. 2007) [28].
When previous studies were taken into account, C & R Tree was used for the first time in gender estimation. It could be the easiest and useful method as it possessed only an average of estimation risk in which less than 0.300 for gender estimation. The result showed that ear length gave better prediction of an unknown gender with 78.7% of overall accuracy if compared to other biometrics. Instead, combination of ear biometrics were encouraged in gender estimation for forensic investigation as it contribute much higher percentage of accuracy up to 92.9%. A validity test using ten selected subjects was done and the data was tabulated in Table 8. The validation percentage was very accurate with 100% correct for gender estimation. In the future, study of ear biometrics should be focused in formation of these gender estimation formulae so as to enhance its application in forensic.
In term of ethnicity, Iannarelli ascertained that growth differences of the ears existed between Whites, Blacks and Asian (Lugt 2009) [26]. There was significant difference (p < 0.05) between Malaysian Chinese and Malays based on only five out of fourteen ear biometrics. On the other hand, there was no significant difference of ear length and ear width between Malaysian Malays and Chinese in this study. This was concurring with study of Adamson., et al. in year 1965 in which White and Negro populations were not showing any significant difference in ear length and ear width [29]. This could be due to genetic convergence among different races while living in similar environment. This genetic convergence could also occur when there was intermarriage between different races. Although there was no intermarriage within three nearest descendents among the subjects chosen in this study, it cannot be ignored that there was possible occurrence of intermarriage outside from the three known descendants. In addition, Malaysian Malays and Chinese were grouped as Asian Mongoloid in which the genetic background was not in big different because both races were in closely related gene pool.
In fact, the genetic convergence was not complete for race differential, but these tracks were at least visually established (Carter 2010) [30]. Study of Alexander., et al. (2010) in which significant difference between races was proven among males [30,24]. This contradicted with our study and might be due to differences in measurement technique and might represent the true differences between the diverse subjects. Comparison among races could be done by referring to various previous studies such as Alexander et al. (2010), Liu (2008), Wang et al. (2010), Yamada (2009), Sforza et al. (2009) as well as Jung and Jung (2003) [5,13,18,24,23]. The differences between population in these previous studies migth be caused by several factors including races, genetical variation, individual constitution, ages and measurement methods as stated by Bozkir., et al. (2006). According to the results of Classification Tree, only biometric A12 was able to form a formula with single deviation point in race estimation. Nevertheless, it gave high risk race estimation of more than 0.300. As a result, these formulae were not good enough in race estimation using the available ear biometrics although complete ear print recovered from crime scene.
This study only involved young adults within the range of 18 and 25 years old in which there was one-year difference for each age. Statistically, there was no significant difference between ages and all the ear biometrics. Hence, it proven that young adults experienced the stabile ear growth as there was no significant increase in ear size. The outcome of the one-way between-groups ANOVA was supported by study of Liu (2008) in which there was no significant difference across age groups from 20 – 39 years olds until 50 – 59 year olds [5]. This fact concurred with the findings of Meijerman., et al. (2007) in which the natural changes on ear was too small and not significant within 20 – 50 years old after full ear size was achieved at puberty age [28].
According to Adamson et al. in year 1965, 85% from ear size of an adult was achieved on the age of three years old and then full ear size started to be completed during 12 – 14 years old until 98 – 100% of adult’s ear size was achieved on the age of 18 – 20 years old depending on gender (Sforza., et al. 2009; Wang., et al. 2010) [13,18]. Based on the study of Schalbe., et al. in year 1891, post maturity growth caused the ear size expansion to occur within the age of 50 years old until 70 - 80 years old (Meijerman., et al. 2007; Sforza., et al. 2009) [28,18,31]. Ear expansion was also contributed by loss of elastin and resilience, diminutive tensile strength of connective tissues as well as alteration in intracellular tissues. Gravitational forces and reduction in number of cartilage cells per unit area have contributed to the lengthening of lobule and hence can result in increasing ear length of 11.0 mm in males and 13.0 mm in females by the age of 80 years (Rutty., et al. 2005) [27]. While increasing ear width was caused by expansion of extracellular matrix of cartilage that in fact pushing helical rim posteriorly instead of conchal fossa (Meijerman et al. 2007; Sforza et al. 2009) [28,18].
Nevertheless, there were several limitations that should not be neglected in this study. Firstly, the formulae formed for gender estimation were only applicable for Malaysian young adults in two main races except other minorities. According to interview with former Malaysia Crime Scene Investigation Chief Officer named Sir Amidon Anan (2011), the limitations in this study also included flexibility of ear shape, variation of pressure applied on glass surface, subjectivity of practitioner as well as immature discipline [29]. In addition, the factors affecting ear biometrics included quality of surface containing ear prints, lifting methods used, hair occlusion as well as the absence of formal standard protocol of ear print recovering especially in Malaysia that hence causing the limited use of ear identification in forensic practical. It was important to enhance study on ear biometrics and update the database of ear prints from time to time for comparison in forensic practical especially for court cases.
In conclusion, there was no significant bilateral difference in ear biometrics but with good correlation of left and right ears. In addition, only six out of fourteen ear biometrics showed significant but not uniform difference between Malays and Chinese in Malaysia population. Generally, there was also absence of significant difference and correlation between ear biometrics across ages. On the other hand, ear biometrics has provided a good reliability in estimation of gender in forensic investigation. Ear length showed a better estimation of gender using formula formed by C & R Tree. Combination of ear biometrics was required to increase the accuracy in estimation of gender. Hence, it could be very useful and accepted as strong evidence in court of law in Malaysia.
Gratefully thanks to supervisors and friends for guidance and assistance throughout the study.

![]()

 |
 |
Ear Biometrics |
Left ear (n = 148) |
T-test |
||||
|---|---|---|---|---|---|---|
Mean |
Standard Error |
Mean |
Standard Error |
p |
R *p < 0.05 |
|
A1 |
5.0 |
0.1 |
5.1 |
0.1 |
0.541 |
0.683* |
A2 |
4.5 |
0.1 |
4.4 |
0.1 |
0.336 |
0.631* |
A3 |
4.2 |
0.1 |
4.1 |
0.1 |
0.341 |
0.503* |
A4 |
4.9 |
0.1 |
4.9 |
0.1 |
0.941 |
0.691* |
A5 |
14.6 |
0.2 |
14.6 |
0.2 |
0.847 |
0.742* |
A6 |
29.2 |
0.3 |
29.9 |
0.3 |
0.068 |
0.805* |
A7 |
15.9 |
0.2 |
16.2 |
0.2 |
0.168 |
0.817* |
A8 |
6.3 |
0.1 |
6.5 |
0.1 |
0.143 |
0.551* |
A9 |
7.6 |
0.1 |
7.9 |
0.1 |
0.058 |
0.552* |
A10 |
7.0 |
0.1 |
7.0 |
0.1 |
0.754 |
0.763* |
A11 |
12.2 |
0.2 |
12.6 |
0.2 |
0.151 |
0.791* |
A12 |
17.5 |
0.2 |
17.6 |
0.2 |
0.717 |
0.856* |
EL |
58.9 |
0.4 |
59.4 |
0.4 |
0.385 |
0.920* |
EW |
31.6 |
0.2 |
31.8 |
0.2 |
0.482 |
0.751* |
Table 1: Bilateral difference in ear biometrics (mm) |
||||||
Ear |
Female (n = 148) |
Male (n=148) |
T-test |
||||||
|---|---|---|---|---|---|---|---|---|---|
Biometrics |
Minimum |
Maximum |
Mean |
Standard Error |
Minimum |
Maximum |
Mean |
Standard Error |
p |
A1 |
3.5 |
7.0 |
5.0 |
0.1 |
3.3 |
6.5 |
5.1 |
0.1 |
0.738 |
A2 |
3.0 |
6.3 |
4.4 |
0.1 |
3.0 |
6.0 |
4.5 |
0.1 |
0.259 |
A3 |
2.5 |
6.0 |
4.0 |
0.0 |
3.06.0 |
6.0 |
4.4 |
0.1 |
< 0.01 |
A4 |
2.5 |
7.0 |
4.7 |
0.1 |
3.3 |
6.8 |
5.1 |
0.1 |
< 0.01 |
A5 |
7.5 |
18.5 |
13.5 |
0.2 |
10.0 |
21.0 |
15.7 |
0.2 |
< 0.01 |
A6 |
20.5 |
35.5 |
27.6 |
0.2 |
25.8 |
38.0 |
31.5 |
0.2 |
< 0.01 |
A7 |
10.0 |
20.0 |
15.6 |
0.2 |
11.5 |
21.3 |
16.5 |
0.2 |
< 0.01 |
A8 |
3.3 |
9.5 |
6.3 |
0.1 |
3.8 |
10.0 |
6.5 |
0.1 |
0.288 |
A9 |
4.0 |
11.3 |
7.6 |
0.1 |
5.3 |
11.3 |
7.9 |
0.1 |
< 0.05 |
A10 |
4.8 |
11.8 |
7.1 |
0.1 |
4.0 |
9.3 |
6.9 |
0.1 |
0.078 |
A11 |
7.0 |
16.3 |
11.5 |
0.2 |
7.5 |
18.5 |
13.3 |
0.2 |
< 0.01 |
A12 |
13.3 |
23.0 |
17.3 |
0.2 |
12.3 |
25.3 |
17.9 |
0.2 |
0.053 |
EL |
46.0 |
65.5 |
56.4 |
0.3 |
53.0 |
72.5 |
61.9 |
0.3 |
< 0.01 |
EW |
24.5 |
35.5 |
30.7 |
0.2 |
28.0 |
38.0 |
32.7 |
0.2 |
< 0.01 |
Table 2: Descriptive statistics for all biometrics (mm) in gender |
|||||||||
Ear Biometrics |
Deviation Point |
Category |
Accuracy (%) |
Overall of Accuracy (%) |
|---|---|---|---|---|
A3 |
≤ 4.40 mm |
Female |
68.8 – 88.6 |
63.2 |
> 4.40 mm |
Male |
36.8 – 53.4 |
||
A4 |
≤ 4.65 mm |
Female |
52.0 – 63.6 |
64.9 |
> 4.65 mm |
Male |
71.9 – 82.1 |
||
A5 |
≤ 15.15 mm |
Female |
76.2 – 79.2 |
72.6 |
> 15.15 mm |
Male |
64.2 – 75.0 |
||
A6 |
≤ 29.15 mm |
Female |
66.1 – 73.3 |
77.4 |
> 29.15 mm |
Male |
78.1 – 86.5 |
||
A7 |
≤ 14.65 mm |
Female |
21.8 – 48.4 |
58.8 |
> 14.65 mm |
Male |
78.3 – 93.8 |
||
A11 |
≤ 13.40 mm |
Female |
80.7 – 91.7 |
71.0 |
> 13.40 mm |
Male |
53.0 – 65.0 |
||
EL |
≤ 58.15 mm |
Female |
69.1 – 73.5 |
78.7 |
> 58.15 mm |
Male |
80.0 – 89.2 |
||
EW |
≤ 30.40 mm |
Female |
38.3 – 41.0 |
65.5 |
> 30.40 mm |
Male |
88.0 – 92.9 |
||
Table 3: Classification formulae based on gender |
||||
Combination |
Ear Biometrics |
Accuracy (%) |
Overall of Accuracy (%) |
Performance Evaluation |
|
|---|---|---|---|---|---|
Female |
Male |
||||
Two |
A6 dan A4 |
75.0 – 88.1 |
87.9 – 92.5 |
87.8 |
0.565 |
Three |
A6, A11 dan A4 |
93.2 – 98.2 |
82.8 – 94.3 |
91.9 |
0.610 |
Four |
A6, A11, A4 dan A7 |
90.6 – 96.5 |
83.8 – 96.2 |
91.2 |
0.610 |
Four |
A6, EW, A4 dan A7 |
90.6 – 98.3 |
83.8 – 87.9 |
91.2 |
0.610 |
Five |
EL, A6, A11, EW dan A4 |
87.5 – 98.3 |
91.4 – 94.6 |
92.9 |
0.620 |
Six |
EL, A6, A5, A11, A3 dan A7 |
86.0 – 93.8 |
91.4 – 100.0 |
92.6 |
0.617 |
Six |
EL, A6, A11, EW, A4 dan A7 |
84.4 – 96.6 |
89.7 – 97.3 |
92.6 |
0.617 |
Seven |
EL, A6, A5, A11, A4, A3 dan A7 |
86.0 – 93.8 |
91.4 – 100.0 |
92.6 |
0.617 |
Table 4: Best classification formulae based on gender |
Ear |
Chinese (n = 48) |
Malays (n = 100) |
T-test |
||||||
|---|---|---|---|---|---|---|---|---|---|
Biometrics |
Minimum |
Maximum |
Mean |
Standard Error |
Minimum |
Maximum |
Mean |
Standard Error |
p |
A1 |
3.8 |
6.3 |
5.0 |
0.1 |
3.3 |
7.0 |
5.1 |
0.1 |
0.151 |
A2 |
3.0 |
5.8 |
4.3 |
0.1 |
3.0 |
6.3 |
4.5 |
0.1 |
0.040 |
A3 |
3.0 |
6.0 |
4.2 |
0.1 |
2.5 |
6.0 |
4.1 |
0.0 |
0.072 |
A4 |
3.5 |
6.5 |
4.7 |
0.1 |
2.5 |
7.0 |
5.0 |
0.1 |
0.007 |
A5 |
11.0 |
19.3 |
14.7 |
0.2 |
7.5 |
21.0 |
14.6 |
0.2 |
0.551 |
A6 |
22.0 |
38.0 |
30.0 |
0.3 |
20.5 |
37.8 |
29.4 |
0.2 |
0.125 |
A7 |
11.5 |
19.8 |
15.9 |
0.2 |
10.0 |
21.3 |
16.1 |
0.1 |
0.299 |
A8 |
4.0 |
10.0 |
6.0 |
0.1 |
3.3 |
9.5 |
6.5 |
0.1 |
0.001 |
A9 |
5.0 |
11.3 |
7.6 |
0.1 |
4.0 |
11.3 |
7.8 |
0.1 |
0.131 |
A10 |
4.0 |
9.0 |
6.6 |
0.1 |
5.0 |
11.8 |
7.2 |
0.1 |
0.000 |
A11 |
8.3 |
17.0 |
13.0 |
0.2 |
7.0 |
18.5 |
12.1 |
0.2 |
0.000 |
A12 |
12.3 |
23.5 |
17.1 |
0.2 |
13.5 |
25.3 |
17.8 |
0.2 |
0.009 |
EL |
53.0 |
66.0 |
59.5 |
0.3 |
46.0 |
72.5 |
59.0 |
0.4 |
0.277 |
EW |
27.3 |
35.5 |
31.9 |
0.2 |
24.5 |
38.0 |
31.6 |
0.2 |
0.393 |
Table 5: Descriptive statistics for all biometrics (mm) in races |
|||||||||
Ear Biometrics |
Deviation Point (mm) |
Category |
Accuracy (%) |
Overall of Accuracy (%) |
|---|---|---|---|---|
A4 |
Multiple points |
Chinese |
4.9 – 21.7 |
67.9 |
Multiple points |
Malays |
89.7 – 95.2 |
||
A8 |
Multiple points |
Chinese |
36.8 – 47.4 |
62.5 |
Multiple points |
Malays |
69.1 – 77.0 |
||
A10 |
Multiple points |
Chinese |
0.0 – 4.7 |
68.2 |
Multiple points |
Malays |
100.0 |
||
A11 |
Multiple points |
Chinese |
0.0 – 15.4 |
69.3 |
Multiple points |
Malays |
96.3 – 100.0 |
||
A12 |
≤ 13.40 mm |
Chinese |
2.9 – 11.5 |
69.3 |
> 13.40 mm |
Malays |
100.0 |
||
Table 6: Classification formulae based on races |
||||
|
19 (N = 58) |
20 (N = 60) |
21 (N = 56) |
22 (N = 66) |
23 (N = 56) |
ANOVA |
Correlation |
|---|---|---|---|---|---|---|---|
p |
r*p < 0.05 |
||||||
A1 |
5.0 ± 0.1 |
5.2 ± 0.1 |
5.2 ± 0.1 |
4.9 ± 0.1 |
4.9 ± 0.0 |
0.056 |
-0.082 |
A2 |
4.4 ± 0.1 |
4.7 ± 0.1 |
4.4 ± 0.1 |
4.4 ± 0.1 |
4.4 ± 0.1 |
0.075 |
-0.097 |
A3 |
4.3 ± 0.1 |
4.3 ± 0.1 |
4.1 ± 0.1 |
4.1 ± 0.1 |
4.0 ± 0.1 |
0.093 |
-0.145* |
A4 |
5.0 ± 0.1 |
5.1 ± 0.1 |
5.0 ± 0.1 |
4.7 ± 0.1 |
4.8 ± 0.1 |
0.057 |
-0.157* |
A5 |
14.6 ± 0.3 |
14.7 ± 0.3 |
14.6 ± 0.3 |
14.5 ± 0.3 |
14.8 ± 0.3 |
0.965 |
0.015 |
A6 |
30.1 ± 0.5 |
29.6 ± 0.4 |
29.4 ± 0.5 |
29.1 ± 0.4 |
29.8 ± 0.4 |
0.456 |
-0.048 |
A7 |
16.4 ± 0.2 |
15.9 ± 0.3 |
16.1 ± 0.3 |
15.7 ± 0.2 |
16.3 ± 0.3 |
0.307 |
-0.021 |
A8 |
6.2 ± 0.1 |
6.4 ± 0.2 |
6.4 ± 0.2 |
6.2 ± 0.2 |
6.7 ± 0.2 |
0.260 |
0.083 |
A9 |
7.5 ± 0.1 |
7.7 ± 0.2 |
7.6 ± 0.2 |
7.8 ± 0.2 |
8.0 ± 0.2 |
0.349 |
0.108 |
A10 |
6.7 ± 0.1 |
7.1 ± 0.2 |
7.3 ± 0.2 |
7.0 ± 0.1 |
6.9 ± 0.1 |
0.109 |
0.018 |
A11 |
12.8 ± 0.3 |
12.4 ± 0.3 |
12.2 ± 0.3 |
12.2 ± 0.2 |
12.4 ± 0.3 |
0.578 |
-0.051 |
A12 |
17.1 ± 0.3 |
18.1 ± 0.3 |
17.3 ± 0.3 |
17.4 ± 0.3 |
18.0 ± 0.3 |
0.095 |
0.050 |
EL |
58.8 ± 0.6 |
60.2 ± 0.6 |
58.3 ± 0.6 |
58.6 ± 0.7 |
59.9 ± 0.7 |
0.123 |
0.014 |
EW |
31.8 ± 0.3 |
31.7 ± 0.3 |
31.5 ± 0.4 |
31.5 ± 0.3 |
32.0 ± 0.3 |
0.691 |
0.024 |
Table 7: Descriptive statistics for all biometrics (mm) in ages |
|||||||
No |
Actual Gender |
Ear Biometrics (mm) Valeu of deviation points |
Estimated Gender |
Minimum Formula Accuracy |
|||||||
|---|---|---|---|---|---|---|---|---|---|---|---|
A3 4.4 |
A4 4.7 |
A5 15.2 |
A6 29.2 |
A7 14.7 |
A11 13.4 |
EL 58.2 |
EW 30.4 |
||||
1 |
F |
4.3 |
4.8 |
12.3 |
28.0 |
16.5 |
13.3 |
57.3 |
29.5 |
F |
84.7% |
2 |
F |
4.5 |
5.0 |
10.0 |
23.0 |
15.0 |
11.3 |
49.0 |
29.5 |
F |
89.8% |
3 |
F |
4.0 |
4.0 |
12.0 |
27.3 |
16.0 |
14.3 |
50.5 |
29.8 |
F |
87.7% |
4 |
M |
3.3 |
3.8 |
18.0 |
31.8 |
18.3 |
16.0 |
67.5 |
33.3 |
M |
84.5% |
5 |
M |
3.5 |
4.3 |
16.5 |
33.8 |
19.5 |
15.5 |
60.5 |
34.0 |
M |
84.5% |
6 |
M |
4.3 |
5.5 |
15.0 |
37.3 |
21.0 |
15.3 |
72.5 |
37.8 |
M |
93.1% |
7 |
M |
4.5 |
5.5 |
19.0 |
41.0 |
20.5 |
11.8 |
71.0 |
36.8 |
M |
87.9% |
8 |
M |
3.5 |
4.0 |
19.8 |
33.3 |
21.5 |
12.8 |
62.0 |
36.5 |
M |
82.8% |
9 |
M |
5.3 |
5.5 |
14.8 |
34.3 |
18.0 |
12.8 |
70.5 |
33.5 |
M |
87.9% |
10 |
M |
4.3 |
5.3 |
16.3 |
37.3 |
24.8 |
17.3 |
71.3 |
39.0 |
M |
89.7% |
F = Female and M = Male |
|||||||||||


