Open Access
Research Article
Max Screen >>
ISSN: 2348-9804
Copyright: © 2017 Phang SF. This is an open-access article distributed under the terms of the Creative Commons Attribution License, which permits unrestricted use, distribution, and reproduction in any medium, provided the original author and source are credited.
Related article at Pubmed, Google Scholar
The aim of this study is to develop formulae for stature and sex estimation through foot length and foot width in major races of Malaysia. A total of 150 subjects (75 males and 75 females) ranging in age from 20 to 30 years were taken from Universiti Kebangsaan Malaysia Kampus Kuala Lumpur (UKMKKL). Statistical analysis indicated that bilateral variation was insignificant for all the foot measurements. Sex differences were found to be highly significant for all the measurements. For races stature was higher significantly in Chinese than Malay but no significant differences were found in all the foot measurements. The highest correlation was found between stature and foot length in all groups. Linear and Multiple Regression Analysis were used for stature estimation. The correlation coefficients between stature and all the foot measurements were found to be positive and statistically significant. Estimation of stature was found to be the most accurate by Multiple Regression Analysis. Formulae for sex estimation were obtained by using Classification Tree. Sex estimation formulae can help to determine the sex with 86.3% - 87.5% in females and 85.2% - 85.7% in males by using foot length while 68.4% - 76.8% in females and 77.8% - 81.0% in males by using foot width.
Keywords: Stature; Sex; Foot length; Foot width
Stature and sex are fundamental parameters in establishing identity of an unknown (Jasuja and Singh 2004; Celbis and Agritmis 2006) [1,2]. Many cases of mass disasters such as airplane crashes and train accidents occurred nowadays. In these scenes a lot of human bodies are found to be dismembered and fragmented. This condition is concealing the identity of victims and making identification processes become difficult as the dismembered human remains unrecognizable (Zeybek., et al. 2008) [3]. In addition fragments of body parts are found to be disposed off in the ditches or rubbish dumping site in the cases of homicide. Identity should be determined through these body parts (Agnihotri., et al. 2007) [4]. Measurements of different parts of the body will provide good approximation about the stature and sex of a person in order to help in personal identification (Krishan and Sharma 2007) [5]. Skull pelvis teeth and vertebral column are the most useful anatomical regions for identification purpose. However these elements cannot be used when they have been destroyed or are incomplete. The foot can be useful in this situation as the foot is protected by shoes (Jeremy Rich., et al. 2003; Rich., et al. 2003; Agnihotri., et al. 2007) [4,6,7]. The foot has been studied widely to provide information about an individual when only the foot of the individual is recovered. Attempts have been done to estimate stature and sex from foot length and foot width based on statistical equations and formulae (Kanchan., et al. 2008) [8].
The purpose of the present study is to develop formulae to estimate the stature and sex of an unknown individual by using foot length and foot width. There are no studies available on the estimation of stature and sex from foot measurements in Malaysia population. Malaysia consisted of various races Malay Chinese Indian and other minorities such as Iban and Kadazan. The population in Malaysia now is constituted of 65.1% Malay 26% Chinese 7.7% Indian and the balance 1.2% containing others minority groups (Pandian 2008) [9]. Each racial group should need different formulae as racial and ethnic variations arise in different regions (Moudgil., et al. 2008) [10]. The formulae can only be used in the same population in which the formulae developed from that population (Steyn 1997; Hauser., et al. 2005) [11,12]. Therefore the developed formulae only can be used in Malaysian population.
The study was conducted among students and staffs in Universiti Kebangsaan Malaysia Kampus Kuala Lumpur (UKMKKL). A total of 150 individuals ranging in the age from 20 to 30 years were taken as subjects. All subjects are Malay (45 males and 45 females) and Chinese (30 males and 30 females). Stature foot length and foot width were measured using anthropometric instruments (body meter osteometric board and digital calliper. All the subjects were asked to bare foot during the measurements. Due to the diurnal variation (Krishan, Vij 2007) all subjects were measured in afternoon (Kanchan., et al. 2008a) at 1400-1600 hours [8,13].
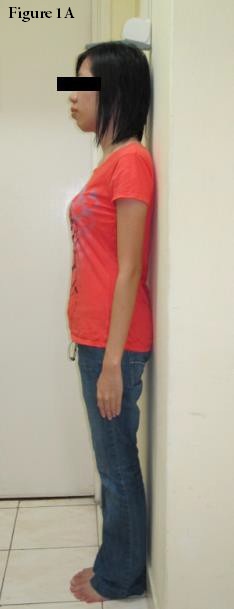
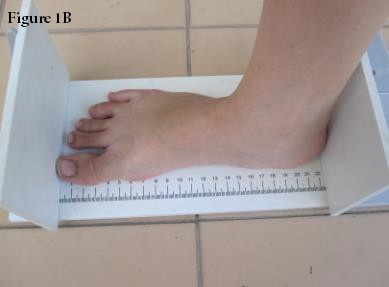
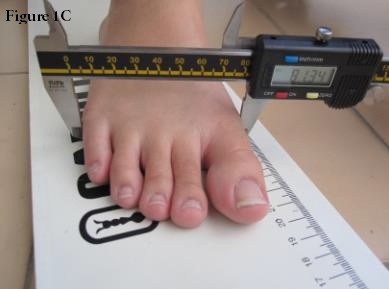
All measurements were taken in the unit of milimeter (mm). Stature was taken from the point vertex to the floor in which the subject is in a standing posture using a body meter. The subject should stand up against the wall both feet must in close contact with each other and the trunk braced along the wall. The head is held in Frankfurt plane (ear-eye plane) by keeping the lateral palpebral commissure and the tip of auricle of the pinna in a horizontal plane parallel to the feet by obeying the anatomical position (Figure 1A). Right foot length (RFL) and left foot length (LFL) were measured from the most anterior and posterior points of the foot (Figure 1B). Right foot width (RFW) and left foot width (LFL) were measured from the surfaces of first metatarsal bone head to fifth metatarsal bone head (Figure 1C) (Krishan and Sharma 2007; Zeybek., et al. 2008) [3,5].
All the numerical data were subjected to statistical analysis using SPSS 15.0. All the measurements were presented in descriptive statistics. Independent T-test was used to compare the right and left foot measurements and foot measurements between sex and races. The relationship between the stature and foot measurements was determined by Pearson Correlation. Analysis. Linear and Multiple Regression Analysis were used to develop formulae for stature while Classification Tree was used to estimate one’s sex.
Table 1 shows the bilateral differences in all the subjects. Generally the mean value of foot length is higher in right foot whereas mean value of foot width is higher in left foot. However there are no statistically significant bilateral differences in the measurements of foot length and foot width. The findings are in agreement with Krishan and Sharma (2007) and Ozden., et al. (2005) [5]. However a number of studies reported that there are significant bilateral differences in foot length and foot width (Tyagi., et al. 2004; Krishan and Sharma 2007; Sen and Ghosh 2008; Kanchan., et al. 2008a) [5,8,14,15].
Comparative statistics with the mean value standard error standard deviation and p- value for each measurement in sex (male and female) races (Malay and Chinese) and combination of sex and races can be seen in Table 2, Table 3 and Table 4 respectively. All the measurements are higher in male than female. These sex differences are statistically significant (p< 0.05). Male are taller than female due to the puberty period. The age of puberty in males is 2 years later than females in which allowing them have extra time for body growth (Krishan and Sharma 2007) [5]. The chromosome Y also associated closely with stature. Male are taller with increased length of the heterochromatic band Yq12 in the chromosome Y (Kanchan., et al. 2008a) [8]. In addition male who have larger body size will have larger foot size in helping them to stand firmly (McGinnis 2005) [16]. High heel shoes is another factor contributing the fact that female are shorter than male. Calf muscles will contract and tend to shorten over time with regular wear. When foot is squeezed into a small space the toes bend and curl to fit into the high heel shoes. The toes may become fixed in this position and become hammertoe. Over time the foot size becomes smaller (Silvers and Williams 2010) [17].
In Malay stature was higher significantly than in Chinese but insignificant in all the foot measurements. Malay male was lower in stature but higher in foot length and foot width than Chinese male. Malay female was lower in stature and also foot length but higher in foot width than Chinese female. Stature and foot size differ in races may due to the factor genetic nutrition lifestyle and shoe type (Lai 2006; Savige., et al. 2007; Zeybek., et al. 2008) [18,19].
Correlation between stature and foot measurements in sex races and combination of sex and races was evaluated and shown in Table 5, Table 6 and Table 7 respectively. In all groups the highest correlation between the stature and foot measurements was found in foot length. The results are in concordance with the study conducted by Zeybek., et al. (2008) and Kanchan., et al. (2008a). This may indicated that foot length is anatomically involved in the stature of a person (Krishan and Sharma 2007) [3,5,8].
Foot length and foot width were evaluated to develop formulae in stature estimation using Linear Regression Analysis. Multiple Regression Analysis was used to develop formulae from the combination of foot length and foot width. Table 8, Table 9 and Table 10 illustrate the regression equations for estimation of stature from foot measurements for general use each sex and combination of sex and races respectively. Foot length in all groups showed higher correlation coefficient (R) with stature other than foot width. Thus linear regression equations using foot length is the best parameter for stature estimation (Krishan and Sharma 2007; Agnihotri., et al. 2007a) [4,5]. Multiple regression equations give better results than linear regression equations (Rastogi., et al. 2008) as the R value was highest in the combination of foot length and foot width in all the formulae [20].
The deviation point of the sex estimation for foot length was 241.50 mm while foot width was 93.81 mm. In foot length the values same with or less than 241.50 mm were evaluated as female while more than 241.50 mm were evaluated as male. In foot width the values same with or less than 93.81 mm were evaluated as female while more than 93.81 mm were evaluated as male. When previous studies were taken into account Classification Tree was used for the first time in sex estimation. It gives an overall accuracy of 85.7% to 86.7% in sex estimation through foot length and 77.8% to 81% through foot width. The result shows that foot length gives better prediction of an unknown sex (Table 11).
The outcome of this study has contributed the community of forensic anthropology in the stature estimation using foot length and/or foot width. This could be applied in the crime scene investigation by the police officer to narrow down the search in terms of stature and/or sex for suspect if foot print evidence found at the crime scene as well as for the victim identification if only foot or feet were discovered from the scene of death.
It is concluded that foot measurements can provide good reliability in estimation of stature and sex in forensic investigation. Foot length gives better estimation of stature and sex than that of foot width. Multiple regression equations provide better results than linear regression equations. Classification tree is the simplest method to determine one’s sex regardless calculation. These have given significant impact for the forensic anthropological study in stature and sex estimation using foot length and/or foot width. However limitation on the formula generated was that it could be applied for the Malaysian individual including Malay and Chinese aged from 20-30 years old. Further study should be conducted on more diverse population for future implications.
Gratefully thanks to Ms Normaizatul Afizah Ismail and AP Dr Khairul Osman for their guidance assistance advice and patience along this study had been done.

![]()

 |
 |
 |
1 |
Right foot (n = 150) |
Left foot (n = 150) |
T-test |
||
|---|---|---|---|---|---|
Mean |
S.E. |
Mean |
S.E. |
p |
|
FL |
243.00 |
1.21 |
243.00 |
1.26 |
0.815 |
FW |
95.10 |
0.56 |
94.38 |
0.53 |
0.352 |
Table 1: Bilateral differences in foot measurements |
|||||
Male (n = 75) |
Female (n = 75) |
T-test |
|||||||||
|---|---|---|---|---|---|---|---|---|---|---|---|
Minimum |
Maximum |
Mean |
S.E. |
S.D. |
Minimum |
Maximum |
Mean |
S.E. |
S.D. |
p |
|
S |
1559 |
1862.00 |
1695.00 |
6.63 |
57.40 |
1724.00 |
1441.00 |
1578.00 |
6.51 |
56.37 |
0.000 |
FL |
219.00 |
287.00 |
253.00 |
1.41 |
12.20 |
212.00 |
257.00 |
232.00 |
1.09 |
9.42 |
0.000 |
FW |
84.79 |
111.86 |
98.40 |
0.66 |
5.75 |
80.11 |
102.74 |
91.09 |
0.57 |
4.98 |
0.000 |
Table 2: Descriptive statistics for all measurements (mm) in sex |
|||||||||||
Malay (n = 90) |
Chinese (n = 60) |
T-test |
|||||||||
|---|---|---|---|---|---|---|---|---|---|---|---|
Minimum |
Maximum |
Mean |
S.E. |
S.D. |
Minimum |
Maximum |
Mean |
S.E. |
S.D. |
p |
|
S |
1441.00 |
1817.00 |
1620.00 |
8.49 |
80.55 |
1538.00 |
1862.00 |
1661.35 |
9.95 |
77.10 |
0.002 |
FL |
212.00 |
287.00 |
243.00 |
1.72 |
16.35 |
219.00 |
276.000 |
243.00 |
1.68 |
13.04 |
0.999 |
FW |
80.11 |
11.86 |
95.33 |
0.76 |
7.18 |
83.88 |
106.81 |
93.86 |
0.67 |
5.22 |
0.175 |
Table 3: Descriptive statistics for all measurements (mm) in races |
|||||||||||
Malay Male (n = 45) |
Chinese Male (n = 30) |
T-test |
|||||||||
|---|---|---|---|---|---|---|---|---|---|---|---|
Minimum |
Maximum |
Mean |
S.E. |
S.D. |
Minimum |
Maximum |
Mean |
S.E. |
S.D. |
p |
|
S |
1559.00 |
1817.00 |
1679.00 |
8.21 |
55.09 |
1611.00 |
1862.00 |
1720.00 |
9.56 |
52.34 |
0.002 |
FL |
219.00 |
287.00 |
254.00 |
2.01 |
13.51 |
236.00 |
276.00 |
252.00 |
1.83 |
10.03 |
0.511 |
FW |
84.79 |
111.86 |
99.36 |
0.97 |
6.48 |
86.33 |
106.81 |
96.84 |
0.80 |
4.38 |
0.067 |
Malay Female (n = 45) |
Chinese Female (n=30) |
T-test |
|||||||||
|---|---|---|---|---|---|---|---|---|---|---|---|
Minimum |
Maximum |
Mean |
S.E. |
S.D. |
Minimum |
Maximum |
Mean |
S.E. |
S.D. |
p |
|
S |
1441.00 |
1689.00 |
1562.00 |
8.41 |
56.40 |
1538.00 |
1724.00 |
1603.00 |
8.68 |
47.56 |
0.002 |
FL |
212.00 |
255.00 |
232.00 |
1.51 |
10.15 |
219.00 |
257.00 |
234.00 |
1.50 |
8.24 |
0.397 |
FW |
80.11 |
101.89 |
91.23 |
0.81 |
5.46 |
83.88 |
102.74 |
90.88 |
0.77 |
4.24 |
0.774 |
Table 4: Descriptive statistics for all measurements (mm) in combination of sex and races |
|||||||||||
| Stature | |||
|---|---|---|---|
Male (n = 75) |
Female (n = 75) |
Study Group (n = 150) |
|
FL r p |
0.594 0.000 |
0.697 0.000 |
0.815 0.000 |
FW r p |
0.392 0.001 |
0.265 0.022 |
0.593 0.000 |
Table 5: Correlation between stature and foot measurements in male and female |
|||
| Stature | |||
|---|---|---|---|
Malay (n = 90) |
Chinese (n = 60) |
Study Group (n = 150) |
|
FL r p |
0.855 0.000 |
0.824 0.000 |
0.815 0.000 |
FW r p |
0.667 0.001 |
0.610 0.022 |
0.593 0.000 |
Table 6: Correlation between stature and foot measurements in Malay and Chinese |
|||
| Stature | ||||
|---|---|---|---|---|
Malay Male (n = 45) |
Malay Female (n = 45) |
Male Chinese (n = 30) |
Female Chinese (n = 30) |
|
FL r p |
0.684 0.000 |
0.772 0.000 |
0.643 0.000 |
0.575 0.000 |
FW r p |
0.582 0.001 |
0.307 0.040 |
0.367 0.046 |
0.271 0.048 |
Table 7: Correlation between stature and foot measurements in combination of sex and races |
||||
Foot Part |
Formula |
R |
R2 |
|
|---|---|---|---|---|
Study Group (n = 150) |
FL |
S = 566.471 + (4.408 x FL) ± 62.571 |
0.815 |
0.665 |
FW |
S = 931.916 + (7.440 x FW) ± 78.85 |
0.593 |
0.352 |
|
FL + FW |
S = 585.198 + (4.898 x FL) - (1.453 x FW) ± 63.497 |
0.819 |
0.670 |
|
Table 8: General formula for stature estimation |
||||
Foot Part |
Formula |
R |
R2 |
|
|---|---|---|---|---|
Male (n = 75) |
FL |
S = 988.059 + (2.792 x FL) ± 112.328 |
0.594 |
0.352 |
FW |
S = 1316.076 + (3.853 x FW) ± 104.423 |
0.392 |
0.153 |
|
FL + FW |
S = 997.211 + (3.176 x FL) – (1.083 x FW) ± 113.241 |
0.598 |
0.358 |
|
Female (n = 75) |
FL |
S = 609.966 + (4.167 x FL) ± 116.854 |
0.697 |
0.485 |
FW |
S = 1305.573 + (2.996 x FW) ± 116.577 |
0.265 |
0.070 |
|
FL + FW |
S = 653.593 + (4.656 x FL) – (1.725 x FW) ± 119.144 |
0.708 |
0.502 |
|
Table 9: Spesific formula for stature estimation in sex |
||||
Foot Part |
Formula |
R |
R2 |
|
|---|---|---|---|---|
| Malay Male (n = 45) | FL |
S = 970.611 + (2.787 x FL) ± 115.370 |
0.684 |
0.468 |
FW |
S = 1187.016 + (4.947 x FW) ± 105.031 |
0.582 |
0.338 |
|
FL + FW |
S = 967.466 + (2.428 x FL) + (0.951 x FW) ± 116.330 |
0.687 |
0.472 |
|
Malay Female (n = 45) |
FL |
S = 568.495 + (4.290 x FL) ± 124.849 |
0.772 |
0.596 |
FW |
S = 1272.923 + (3.172 x FW) ± 137.089 |
0.307 |
0.094 |
|
FL + FW |
S = 608.669 + (4.832 x FL) - (1.816 x FW) ± 125.704 |
0.786 |
0.618 |
|
Male Chinese (n = 30) |
FL |
S = 874.170 + (3.355 x FL) ± 190.550 |
0.643 |
0.413 |
FW |
S = 1294.787 + (4.390 x FW) ± 203.517 |
0.367 |
0.135 |
|
FL + FW |
S = 890.440 + (3.507 x FL) - (0.563 x FW) ± 204.293 |
0.644 |
0.415 |
|
Female Chinese (n = 30) |
FL |
S = 827.485 + (3.320 x FL) ± 208.417 |
0.575 |
0.331 |
FW |
S = 1326.221 + (3.043 x FW) ± 185.552 |
0.271 |
0.074 |
|
FL + FW |
S = 837.773 + (3.412 x FL) - (0.350 x FW) ± 220.538 |
0.576 |
0.332 |
|
Table 10: Spesific formula for stature estimation in combination of sex and races |
||||
Foot Part |
Deviation Point (mm) |
Category |
Accuracy (%) |
Overall of Accuracy (%) |
|---|---|---|---|---|
FL |
≤ 241.50 |
Female |
86.3 - 87.5 |
85.7 - 86.7 |
> 241.50 |
Male |
85.2 - 85.7 |
||
FW |
≤ 93.81 |
Female |
68.4 - 76.8 |
77.8 - 81.0 |
> 93.81 |
Male |
78.8 - 91.3 |
||
Table 11: Category of sex |
||||


