Open Access
Research Article
Max Screen >>
ISSN: 2348-9804
Copyright: © 2014 Hairunnisa MAK. This is an open-access article distributed under the terms of the Creative Commons Attribution License, which permits unrestricted use, distribution, and reproduction in any medium, provided the original author and source are credited.
Related article at Pubmed, Google Scholar
A person's stature is an identifying characteristic that is often used in forensic investigation. Footprint is the one of the valuable physical evidence encountered in the crime scenes and examination of barefoot impressions is important especially in developing countries like India, Malaysia where majority of the rural population like to walk barefooted because of socio-economic and climatic reasons. Foot impressions are still found at crime scenes, since offenders often tend to remove their footwear either to avoid noise or to gain better grip in climbing walls, etc., while entering or exiting. Most of the foot/foot print studies were conducted on mixed population. The researchers have cautioned that the people from different races and regions of a country bear different morphological features depending upon their geographical distribution and primary racial characteristics and hence a single formula cannot represent all parts of that country or world. The present study aims to estimate stature from bilateral footprints collected from 320 (160 males, 160 females) consenting adult Ibans, an indigenous group residing in Sarawak state, east Malaysia. Informed consent and Human Ethical Approval were obtained. The height of the individuals and footprints were collected following the standard procedure. The data obtained were analyzed with PASW 20 computer software and derived regression formulae to estimate stature from footprint lengths of Iban ethnics. The result of the investigation revealed that all footprint lengths exhibit statistically positive significant correlation with stature (p< 0.001). Correlation coefficient (R) values are found to be higher in the pooled sample (0.861–0.887) when compared with males (0.753–0.789) and females (0.728–0.790). The regression formulae derived for the pooled sample can be used to estimate stature when the sex of the footprint remains unknown, as in real crime scenarios.
Keywords: Forensic science; Forensic anthropology; Stature estimation; Footprint; East Malaysian Ibans
An aspect of human identification that has received scant attention from forensic anthropologists is the study of human footprints made by the feet [1]. Person identification using footprint analysis is also an emerging biometric technique [2]. The characteristic features can provide useful clues to establish identity whenever complete or partial footprints are recovered at the crime scenes [3]. Examination of barefoot impressions is important especially in developing countries like India, Malaysia, Thailand, Indonesia where majority of the rural population like to walk barefooted because of socio-economic and climatic reasons. Foot impressions are still found at crime scenes, since offenders often tend to remove their foot wears either to avoid noise or to gain better grip in climbing walls, etc., while entering or exiting [4]. Footprints can be found on newly waxed floors, freshly cemented surfaces, moistened surfaces, in dust, oil, paint and can be left in blood at the murder scenes [5]. Analyses of foot [6-13] and footprints [14-20] help in estimation of an individual's stature because of the existence of a strong correlation between one's stature and foot size. For stature estimation from footprint parameters, the researchers indicated that toes-to-heel footprint length in a footprint has more reliability of prediction than from any other measurements, such as breadth at ball/heel and big toe breadth/length [21-25].
The researchers have cautioned that the people from different races and regions of a country bear different morphological features depending upon their geographical distribution and primary racial characteristics and hence a single formula cannot represent all parts of the country or world [4,9,12,17,20,23]. The present study aims to estimate the stature from all toes-to-heel length measurements in a footprint so that the findings of the study will be applicable to partial and complete footprints of Ibans of east Malaysia. The study used regression analysis since the reliability and prediction of stature estimation is more accurate and reliable with the regression analysis method [26].
The study was carried out at Sarawak state, east Malaysia in Borneo Island. The subjects were from colleges, universities and general public. The Ibans are an indigenous ethnic group, native of east Malaysia and most Ibans are residing in Sarawak, one of the two states in east Malaysia, Sabah and Sarawak. They were originally farmers, hunters, and gatherers. Figure 1 depicts the area of sample collection in East Malaysia for this research.
Before started the research, concurrence was obtained from Sarawak state Chief Minister vide No. JKM.P/DEV/16/005/12(44), for sample collection from Iban ethnic groups. Informed consent was also obtained from all participants and followed the procedure in accordance with the ethical standards of Universiti Sains Malaysia Human Research Ethic Committee {Ethical approval No.USMKK/PPP/JEMPeM [247.4.(2.12]/Amend (01) dated 8th April 2012 of USM}. The present study aims to estimate stature in a sample of 640 bilateral footprints collected from 320 (160 males, 160 females) consenting adult Iban ethnics, ages ranging between 18 to 82 years. Subjects with any apparent foot-related disease, pregnancy, orthopedic deformity, physical impairment, injury, disorders or under the age of 18 years were excluded from the study. Just prior to research participation, the subjects were advised to wash their feet with soap and water. Stature of each subject was measured without head and footwear using a portable body meter measuring device (SECA model 206) following the standard procedure [4,16]. The body meter was suspended upright against the wall and measurements were taken to the nearest 0.5 cm. The subject was advised to stand under the body meter with his heels together and weight evenly distributed between both feet. Stature was measured in cm as the vertical distance between the vertex and the sole of the foot when the individual was standing barefoot with head held in the Frankfurt horizontal plane with eyes looking forward. The measurements were repeated until concordant values were achieved. Considering the diurnal variation in stature, the height of the subjects was measured approximately at a fixed time in the afternoon. The diurnal change in height of a person was reported and confirmed by the researchers [27,28].
A cleaned plain glass plate of 8 mm thickness was uniformly smeared with ''Kores quick drying black duplicating ink 4746'' with the help of a footprint roller. The left foot of the subject was asked to step on the inked glass plate with minimal pressure. Then the inked foot was placed on an A4 plain white paper kept aside on a uniform surface and thus the left footprint was transferred. Before lifting the sole from the paper, anatomical land marks of the feet were marked on the papers close to the footprints which are mid-rear heel point and most anterior point of all toes. Following Robbins [14] and Krishan [16], the designated longitudinal axis (DLA) and base line (BL) were drawn on the footprints. The DLA is from the pternion (P) landmark at the mid-rear heel margin to the lateral side of the toe 1 pad margin, the axial line touches the rim of the pad margin as it passes forward beyond the length of foot. Base line (BL) is drawn at the rear edge of the foot and perpendicular to the DLA. The base line extends from the landmark P at the rear of the heel in both medial lateral directions while maintaining its perpendicular alignment with the DLA. Its axis can be determined as marked on the footprint using the protractor. With the 900 mark on the footprint placed on the DLA, and the midpoint of the protractor base at pternion, one automatically has the perpendicular BL by drawing a line through pternion along the base of the protractor. Then five diagonal footprint length measurements were taken from the mid-rear heel point (P) to most anterior point of each left toes (LT1, LT2, LT3, LT4, and LT5). The left footprint length measurements were designated as PLT1, PLT2, PLT3, PLT4, and PLT5. The procedure was repeated for the right footprint and the right footprint length measurements were designated as PRT1, PRT2, PRT3, PRT4, and PRT5. The land marks and diagonal length measurements on right footprint are shown in Figure 2. All footprints and information relating to participants were coded with sample ID for anonymity.
The data were analyzed using PASW Statistics version 20 (Predictive Analytic Software). Bilateral asymmetry was calculated for each of the foot outline measurements and tested for significance using one sample t-test. Pearson's correlation coefficient (R) between various feet outline lengths and stature was obtained. The linear regression analysis method was employed to derive regression equations for stature estimation from various footprint lengths since stature estimation from foot outline length is more accurate and reliable with regression analysis [26].
All footprint lengths exhibit statistically positive significant correlation with stature. Descriptive statistics of stature measurements in males, females and the pooled sample are shown in Table 1.
In males, the stature ranges from 143.0 to 179.2 cm (mean 164.8 cm) and in females the stature ranges from 135.0 to 171.4 cm (mean 153.5 cm). The result showed that mean stature is found to be significantly higher in males than females. Table 2 shows the descriptive statistics of various footprint lengths i.e. diagonal length between the rear heel end (P) and anterior points of each toe in both left (LT1– LT5) and right (RT1–RT5) footprints of males, females and the pooled sample.
All the footprint length measurements in males are found to be larger than females both in left and right feet. The notable feature is that the mean second toe–heel footprint lengths in both left and right (PLT2, PRT2) are found to be the longest in males whereas in females the mean first and second toe-heel footprint lengths in both right and left are found to be same. The investigation reveals the nonexistence of significant bilateral asymmetry in both the genders (Table 3).
Table 4, 5 and 6 present the linear regression equations for estimation of stature in adult males, females and the pooled sample through various footprint length measurements with ANOVA. The standard error of estimate (SEE) in case of males (3.526-3.774) is comparatively lower than that of females (3.810-4.294) and the pooled sample (3.812-4.195). The tables also show the correlation coefficient (R) between the stature and various footprint lengths among males, females and pooled sample and R value is statistically significant ( < 0.001). Correlation coefficient values are found to be more in the pooled sample (0.861-0.887) when compared with males (0.753-0.789) and females (0.728-0.790). The coefficient of determination (R2), the predictive accuracy is found to be statistically significant for stature estimation. Hence statistically significant correlation coefficient exist between stature and all footprint length measurements in Ibans of east Malaysia.
The result of this pilot footprint study in east Malaysia, Borneo Island provided regression formulae for the stature estimation from various bilateral footprint length measurements of Indigenous Iban ethnics when complete and even partial footprints for human identification.
Malaysia is a multi-racial, multi-ethnic and multi-cultural country. It consists of two similarly sized regions, Peninsular Malaysia (West Malaysia) and Malaysian Borneo (East Malaysia) separated by the South China sea. East Malaysia is less populated with larger forest land mass. The indigenous ethnic groups of Sarawak include Iban, Bidayuh, Melanau, Orang Ulu and so on. Iban is the largest of Sarawak's ethnic groups. The Iban speak a dialect of Malay (Malayan subfamily, Austronesian family) that is distinct from other Bornean languages. Farming is the main occupation of the Ibans and some still hunt wild animals in the jungle by setting traps or using blowpipes. The age range of the subjects in this research is appropriate since stature at 18 years is accepted as adult [29,30]. Some researchers indicated that the foot in a male grows to its adult size by 16 years [31,32]. Hence the minimum age was fixed as 18 years to conduct this study. The present investigation shows that statistically significant male–female differences exist in the stature in Ibans population. All the footprint length measurements in males are found to be larger than females both in left and right feet. This may be attributed to the general male-female differences and natural size in both sexes [25]. The result shows that the mean second toe–heel footprint lengths in both left and right (PLT2, PRT2) are found to be the longest in males whereas in females the mean first and second toe-heel footprint length in both right and left are found to be same. The investigation reveals the no significant bilateral asymmetry is observed in both the genders. This finding is concordant with Robbins [33] and Philip [34] who did not find significant bilateral asymmetry while working on US and south Indian populations. Some of the researchers have shown the existence of left sided asymmetry in the population under study [4,16,17,29,33]. This left sided asymmetry in the lengths of the footprints may be attributed to the fact that majority of the individuals put greater strain on the left lower limb [21] than on the right side in walking and weight bearing for the stature estimation from foot/footprint parameters, the researchers concluded that toes-to-heel length measurements are more reliable and accurate than from any other measurements, such as breadth at ball/heel and big toe breadth/length [21-25]. It is interesting to note that the correlation coefficient (R) between stature and footprint length measurements regardless of sex, i.e. when male and female subjects are pooled together, gave a more significant result than the correlations separately obtained for the males and females. This finding is consistent with earlier studies of Malays [4], Malaysian Chinese [12] and Indians [33]. Considering real crime scenarios, where the sex of the perpetrator is unknown, it is suggested that a better regression equation that can be used for stature estimation is the one without sex indicators. The standard error of estimate (SEE) is a measure of accuracy of predictions. The derived regression equations from footprint length measurements for stature estimation in both males and females show high reliability and accuracy since the SEE values were found to be low. Researchers indicated that regression formulae can be derived for stature estimation using foot and hand measurements with a great accuracy and a small SEE, i.e. about 2–6 cm [22]. Having the fifth toe print missing was found in LT5 and RT5 of some subjects, indicating that the fifth toe did not make contact with ground during the footprint development process. A missing toe impression may acquire forensic significance as it narrows down the process of identification. This phenomenon has been observed in other footprint studies [19,25].
The results of this pilot footprint study in Borneo Island provided regression formulae for stature estimation from footprints (complete or partial) in Ibans of east Malaysia. The regression equations derived for the pooled sample can be used to estimate stature when the sex of the footprint's owner remains unknown, as in real crime scenarios. It is important to note that the regression equations derived in this research to estimate stature from footprint is suitable for Iban population in East Malaysia and it would be incorrect to utilize these equations to any other populations either in Malaysia or any other population in the world.
The authors are thankful to all participants who took part in this strenuous study. Thanks are due to Sarawak state Chief Minister, Sarawak state Chief Police Officer, and Chemistry Department of Malaysia, Bintulu, East Malaysia for the support to conduct the research. Authors are grateful to Universiti Sains Malaysia for encouraging research and its publication in international journals.

![]()

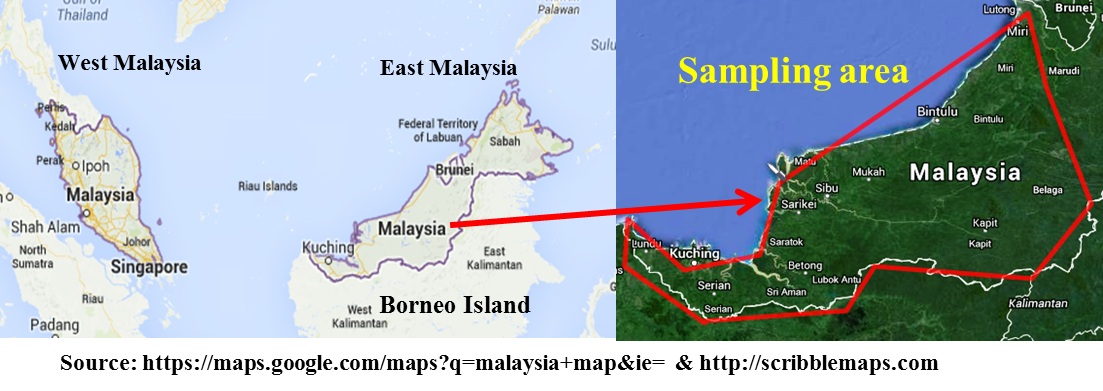 |
| Figure 1: Map of Malaysia showing the sampling area, Sarawak state, East Malaysia in Borneo Island |
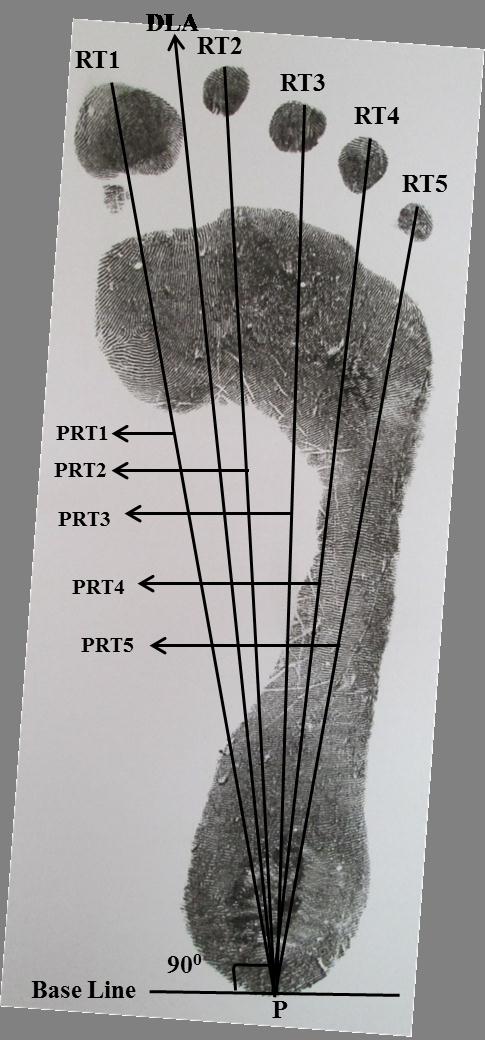 |
| Figure 2: Landmarks and diagonal length measurements on right footprint PRT1-PRT5, measurements taken from the mid-rear heel point, pternion (P) to the most anterior point of toes RT1-RT5 on right footprint. DLA - Designated Longitudinal Axis |
| Male (N = 160) | Female (N = 160) | Pooled sample (N =320) | |||||||||||||
|---|---|---|---|---|---|---|---|---|---|---|---|---|---|---|---|
| Variable | Min | Max | RD | Mean | SD | Min | Max | RD | Mean | SD | Min | Max | RD | Mean | SD |
| Stature | 143.0 | 179.2 | 36.2 | 164.8 | 5.7 | 135.0 | 171.4 | 36.4 | 153.5 | 6.2 | 135.0 | 179.2 | 44.2 | 159.2 | 8.2 |
| SD- standard deviation; RD- range difference; Min- minimum; Max- maximum; N – sample size Table 1: Descriptive statistics of stature in males, females and pooled sample of adult Ibans ethnic of Sarawak (in centimeters). |
|||||||||||||||
| Male | Female | Pooled sample | ||||||||||||||||
|---|---|---|---|---|---|---|---|---|---|---|---|---|---|---|---|---|---|---|
| Variables | N | RD | Min | Max | Mean | SD | N | RD | Min | Max | Mean | SD | N | RD | Min | Max | Mean | SD |
| PLT1 | 160 | 6.0 | 19.8 | 25.8 | 23.0 | 1.0 | 160 | 4.8 | 19.0 | 23.8 | 21.2 | 1.0 | 320 | 6.8 | 19.0 | 25.8 | 22.1 | 1.4 |
| PLT2 | 160 | 6.3 | 19.4 | 25.7 | 23.2 | 1.1 | 160 | 5.0 | 19.1 | 24.1 | 21.2 | 1.1 | 320 | 6.6 | 19.1 | 25.7 | 22.2 | 1.5 |
| PLT3 | 160 | 6.5 | 18.7 | 25.2 | 22.4 | 1.1 | 160 | 4.7 | 18.4 | 23.1 | 20.5 | 1.0 | 320 | 6.8 | 18.4 | 25.2 | 21.4 | 1.4 |
| PLT4 | 160 | 6.2 | 17.9 | 24.1 | 21.3 | 1.0 | 160 | 4.9 | 17.1 | 22.0 | 19.5 | 1.0 | 320 | 7.0 | 17.1 | 24.1 | 20.4 | 1.4 |
| PLT5 | 160 | 5.4 | 16.6 | 22.0 | 19.6 | 1.0 | 158* | 4.8 | 15.6 | 20.4 | 18.0 | 0.9 | 318* | 6.4 | 15.6 | 22.0 | 18.8 | 1.3 |
| PLT1 | 160 | 6.4 | 19.7 | 26.1 | 23.1 | 1.0 | 160 | 5.2 | 18.9 | 24.1 | 21.2 | 1.0 | 320 | 7.2 | 18.9 | 26.1 | 22.1 | 1.4 |
| LT2 | 160 | 6.2 | 20.1 | 26.3 | 23.2 | 1.1 | 160 | 5.5 | 18.5 | 24.0 | 21.2 | 1.1 | 320 | 7.8 | 18.5 | 26.3 | 22.2 | 1.5 |
| PLT3 | 160 | 6.0 | 19.0 | 25.0 | 22.4 | 1.1 | 160 | 4.9 | 18.1 | 23.0 | 20.4 | 1.1 | 320 | 6.9 | 18.1 | 25.0 | 21.4 | 1.5 |
| PLT4 | 160 | 5.6 | 18.1 | 23.7 | 21.2 | 1.0 | 160 | 5.1 | 17.1 | 22.2 | 19.4 | 1.0 | 320 | 6.6 | 17.1 | 23.7 | 20.3 | 1.4 |
| PLT5 | 159* | 5.4 | 16.7 | 22.1 | 19.6 | 1.0 | 159* | 5.1 | 15.7 | 20.8 | 17.9 | 1.0 | 318* | 6.4 | 15.7 | 22.1 | 18.8 | 1.3 |
| Min- minimum; Max- maximum; PLT1 to PLT5- left footprint lengths from anterior part of toes LT1- T5 to mid-rear heel point P; PRT1 to PRT5 - right footprint lengths from anterior part of toes RT1-RT5 to mid-real heel point P; RD- range difference; SD- standard deviation; N- Sample size; .N*:Missing toe in a footprint of a male and a female during footprint development process. Table 2: Descriptive statistics of footprint length measurements in males, females and pooled sample of adult Iban ethnics of Sarawak (in centimeters) |
||||||||||||||||||
| Male (N = 160) | Female (N = 160) | |||||||
|---|---|---|---|---|---|---|---|---|
| Variables | Mean difference (left-right) | SD | t-Value | P-Value | Mean difference (left-right) | SD | t-Value | P-Value |
| T-1(PLT1 – PRT1) | -0.0125 | 0.40 | -0.39 | 0.694 | -0.0306 | 0.40 | -0.93 | 0.352 |
| T-2(PLT2 – PRT2) | 0.0094 | 0.35 | 0.34 | 0.732 | -0.0025 | 0.40 | -0.09 | 0.931 |
| T-3(PLT3 – PRT3) | 0.0344 | 0.33 | 1.32 | 0.189 | 0.0425 | 0.30 | 1.58 | 0.116 |
| T-4(PLT4 – PRT4) | 0.0437 | 0.32 | 1.71 | 0.089 | 0.0694 | 0.30 | 2.54 | 0.012 |
| T-5(PLT5 – PRT5) | 0.0245 | 0.33 | 0.93 | 0.355 | 0.0720 | 0.30 | 2.68 | 0.008 |
| Table 3: One-sample t-test of bilateral differences (left–right) in footprint length measurements among males and females in adult Iban ethnics of Sarawak | ||||||||
| Variables | Regression Equations | SEE | R | R2 | Adj, R2 | Coefficient of t-test | ANOVA |
|---|---|---|---|---|---|---|---|
| PLT1 | 66.552 + 4.266PLT1 | 3.734 | 0.759 | 0.576 | 0.574 | 14.664 | 215.024(1, 158) ; P<0.001 |
| PLT2 | 71.990 + 3.996PLT2 | 3.724 | 0.761 | 0.579 | 0.576 | 14.730 | 216.967(1, 158) ; P<0.001 |
| PLT3 | 73.743 + 4.064PLT3 | 3.696 | 0.765 | 0.585 | 0.583 | 13.657 | 222.848(1, 158) ; P<0.001 |
| PLT4 | 77.129 + 4.127PLT4 | 3.774 | 0.753 | 0.567 | 0.565 | 14.395 | 207.229(1, 158) ; P<0.001 |
| PLT5 | 75.410 + 4.557PLT5 | 3.681 | 0.767 | 0.588 | 0.586 | 15.026 | 225.787(1, 158) ; P<0.001 |
| PRT1 | 61.469 + 4.484PRT1 | 3.547 | 0.786 | 0.618 | 0.615 | 15.980 | 255.367(1, 158) ; P<0.001 |
| PRT2 | 68.397 + 4.153PRT2 | 3.526 | 0.789 | 0.622 | 0.620 | 16.136 | 260.367(1, 158) ; P<0.001 |
| PRT3 | 73.942 + 4.062PRT3 | 3.650 | 0.772 | 0.595 | 0.593 | 15.247 | 232.471(1, 158) ; P<0.001 |
| PRT4 | 75.956 + 4.191PRT4 | 3.703 | 0.764 | 0.583 | 0.581 | 14.876 | 221.301(1, 158) ; P<0.001 |
| PRT5 | 76.429 + 4.510PRT5 | 3.628 | 0.776 | 0.602 | 0.600 | 13.163 | 237.814(1, 157) ; P<0.001 |
| PLT1 to PLT5- left lengths from anterior part of toes LT1- T5 to mid-rear heel point P; PRT1 to PRT5- right lengths from anterior part of toes RT1-RT5 to mid-rear heel point P; SEE- standard error of estimate; R2-coefficient of determination.Adj, R2-Adjusted R2. p-value < 0.001 significant Table 4: Linear regression equations for stature estimation from different footprint length measurements on left and right sides among adult male Ibans of Sarawak (in centimeters). |
|||||||
| Variables | Regression Equations | SEE | R | R2 | Adj, R2 | Coefficient of t-test | ANOVA |
|---|---|---|---|---|---|---|---|
| PLT1 | 52.290 + 4.780PLT1 | 4.107 | 0.752 | 0.565 | 0.562 | 14.324 | 205.169(1, 158) ; P<0.001 |
| PLT2 | 62.192 + 4.298PLT2 | 4.194 | 0.739 | 0.546 | 0.543 | 13.794 | 190.285(1, 158) ; P<0.001 |
| PLT3 | 63.675 + 4.386PLT3 | 4.223 | 0.735 | 0.540 | 0.537 | 13.618 | 185.444(1, 158) ; P<0.001 |
| PLT4 | 64.131 + 4.591PLT4 | 4.175 | 0.742 | 0.550 | 0.548 | 13.908 | 193.436(1, 158) ; P<0.001 |
| PLT5 | 65.894 + 4.880PLT5 | 4.294 | 0.728 | 0.530 | 0.527 | 13.255 | 175.685(1, 156) ; P<0.001 |
| PRT1 | 51.180 + 4.825PRT1 | 3.893 | 0.780 | 0.609 | 0.607 | 15.691 | 246.208(1, 158) ; P<0.001 |
| PRT2 | 59.645 + 4.418PRT2 | 3.810 | 0.791 | 0.625 | 0.623 | 16.243 | 263.850(1, 158) ; P<0.001 |
| PRT3 | 62.261 + 4.464PRT3 | 3.907 | 0.779 | 0.606 | 0.604 | 15.594 | 243.161(1, 158) ; P<0.001 |
| PRT4 | 60.636 + 4.788PRT4 | 3.829 | 0.789 | 0.622 | 0.619 | 16.116 | 259.721(1, 158) ; P<0.001 |
| PRT5 | 64.866 + 4.957PRT5 | 3.995 | 0.764 | 0.584 | 0.582 | 14.859 | 220.804(1, 157) ; P<0.001 |
| PLT1 to PLT5- left lengths from anterior part of toes LT1- T5 to mid-rear heel point P; PRT1 to PRT5- right lengths from anterior part of toes RT1-RT5 to mid-rear heel point P; SEE- standard error of estimate; R2 -coefficient of determination; Adj, R2 -Adjusted R2; p-value < 0.001 significant Table 5: Linear regression equations for stature estimation from different footprint length measurements on left and right sides among adult female Ibans of Sarawak (in centimeters). |
|||||||
| Variables | Regression Equations | SEE | R | R2 | Adj, R2 | Coefficient of t-test | ANOVA |
|---|---|---|---|---|---|---|---|
| PLT1 | 43.170 + 5.247PLT1 | 4.064 | 0.871 | 0.758 | 0.757 | 31.545 | 955.113(1, 318) ; P<0.001 |
| PLT2 | 50.988 + 4.865PLT2 | 4.126 | 0.866 | 0.750 | 0.750 | 30.917 | 955.886(1, 318) ; P<0.001 |
| PLT3 | 52.510 + 4.973PLT3 | 4.131 | 0.866 | 0.750 | 0.749 | 30.870 | 952.942(1, 318) ; P<0.001 |
| PLT4 | 52.967 +5.217PLT4 | 4.195 | 0.861 | 0.742 | 0.741 | 30.242 | 914.578(1, 318) ; P<0.001 |
| PLT5 | 53.572 + 5.621PLT5 | 4.193 | 0.862 | 0.742 | 0.742 | 30.176 | 910.567(1, 316) ; P<0.001 |
| PRT2 | 49.420 + 4.936PRT2 | 3.812 | 0.887 | 0.787 | 0.786 | 34.265 | 1174.113(1, 318) ; P<0.001 |
| PRT3 | 52.786 + 4.969PRT3 | 3.945 | 0.879 | 0.772 | 0.771 | 32.793 | 1075.410(1, 318) ; P<0.001 |
| PRT4 | 52.423 + 5.258PRT4 | 3.956 | 0.878 | 0.771 | 0.770 | 32.679 | 1067.891(1, 318) ; P<0.001 |
| PRT5 | 55.172 + 5.549PRT5 | 3.995 | 0.874 | 0.765 | 0.764 | 32.048 | 1027.084(1, 316) ; P<0.001 |
| PLT1 to PLT5 - left lengths from anterior part of toes LT1- T5 to mid-rear heel point P; PRT1 to PRT5- right lengths from anterior part of toes RT1-RT5 to mid-rear heel point P; SEE- standard error of estimate; R2-coefficient of determination; Adj, R2 -Adjusted R2 ; p-value < 0.001 significant Table 6: Linear regression equations for stature estimation from different footprint length measurements on left and right sides among pooled samples in adult Iban ethnics of Sarawak (in centimeters). |
|||||||


