Open Access
Research Article
Max Screen >>
ISSN: 2348-9804
Copyright: © 2016 Ibeh Nnanna Isaiah. This is an open-access article distributed under the terms of the Creative Commons Attribution License, which permits unrestricted use, distribution, and reproduction in any medium, provided the original author and source are credited.
Related article at Pubmed, Google Scholar
The present study was performed to determine the quality and the quantity of DNA extracted from buccal swab at two intervals to compare the DNA quality and quantity before and after brushing. Five (5) healthy males where used in the study, ten (10) Buccal swabs where collected at two intervals, five (5) before brushing and five (5) after brushing commonly available samples and to estimate the DNA yield and purity from the various times of collection. The purity and the concentration of the extracted DNA were determined spectrophotometric analysis, and the adequacy of DNA extracts for the PCR-based assay was assessed by amplifying a 1030-bp region of the mitochondrial D-loop. Although DNA from all the intervals was suitable for PCR, the samples before brushing when the mouth was empty provided a good quality DNA for restriction analysis of the PCR product compared with the buccal swab after brushing. In the present study, buccal swab samples showed to be a good source of genomic DNA for PCR-based methods.
Keywords: Spectrophotometric; Mitochondrial; Genomics; Buccal
Deoxyribonucleic acid (DNA) can be successfully extracted from many biological sources such as blood, semen, saliva, buccal cells and skin cells. This DNA can then be amplified using polymerase chain reaction (PCR) to create DNA profiles which could be used to help convict or exonerate a suspect in a criminal case; therefore DNA is vitak in forensic science [1-6]. Extraction methods not only have to remove inhibitors which may interfere with subsequent downstream processes, for example, blood contains haem which is a PCR inhibitor and therefore this must be sufficiently removed during the extraction processes to allow the DNA to be amplified both organic and inorganic methods of DNA extraction are available, each giving variable results depending on the sample type [7-9].
For this reason several protocols have been developed to obtain DNA from buccal cells. The collection of buccal cells by mouthwash seems to give higher yields than many other methods [10-12]. The diagnostic results obtained with DNA from buccal cells are compatible with whole blood [13,14]. Several approaches have been developed to isolate DNA from mouth- washes [15-20]. The more frequently used are: a) boiling lysis method, yielding poor-quality DNA phenol- chloroform, which is laborious and uses toxic reagents commercially available kits, which are non- toxic and simple to use [21-23]. Although the use of kits is more straightforward they may be quite expensive.
Several researches on buccal DNA isolation has been carried out but not all has centred on the purity of the DNA extracted from the comparative studies on buccal samples from patients before and after brushing. This is to compare the quantity, quality and the purity of the buccal DNA extracted, using adult male from Benin metropolis, Edo state South Southern Nigeria as a case study. This work was thus carried out to provide a bridge for the gap of information on buccal DNA extraction [24-30].
The study population comprised of Five (5) healthy males for the comparative analysis of buccal samples for DNA isolation at varied time of collection.
Sample of study is the buccal sample for the isolation of human DNA.
In the current study, Five (5) healthy adult males volunteers were recruited (age range, 22–35 years), and demographic information, including age, health condition, sex, population ancestry, was collected. The volunteers recruited were asked to collect buccal samples twice, the first just as they wake up in the morning this is to compare if the effect the effect of mouth gaggling with water, the other after they rinse their mouth with tap water, 30 seconds before sampling of buccal swabs [31-34]. For each individual, both sides of buccal mucosa were wiped with a cotton swab for 15 seconds, and a total of five samples was collected in 500 μl 10 M Tris-HCl, 10 mM EDTA, 2% SDS, containing 1.5-ml microcentrifuge tubes. Isolation of DNA from cotton swabs was performed (vide infra).
The samples were analysed almost 1 hour after collection. The buccal swab samples were suspended in 500 μl lysis buffer [10 mM Tris (pH 8.0), 10 mM EDTA, and 2.0% SDS], and 50 μl 10% SDS, followed by 5–10 μl 20 mg/ml proteinase K (Himedia, Mumbai, India), was added [35,36]. The samples were incubated 1–3 h at 56°C until the tissue was totally dissolved.
The DNA would be extracted from each sample with an equal volume of phenol:chloroform: isoamyl alcohol solution (25:24:1) and mixed gently by inverting the tubes for 3 min. The samples were then centrifuged (Eppendorf 5415R; Hamburg, Germany) for 10 min with 10,000 g (4°C), and the upper aqueous layer was transferred to a fresh, sterilized microcentrifuge tube. RNase A (10 μl of 10 mg/ml; Fermentas, Thermo Scientific, Germany) was added, and the solution was incubated at 37°C for 30 min [36-40]. Equal volumes of chloroform:isoamyl alcohol solution were added and centrifuged (Eppendorf 5415R), again with 10,000 g (4°C) for 10 min.
The upper aqueous layer was transferred to a sterilized micro-centrifuge tube, and double the volume of chilled isopropanol (Merck, Whitehouse Station, NJ, USA) was added, along with one-tenth volume of 3 M sodium acetate, and chilled at −20°C for 1 h for precipitation. After 1 h, the sample was centrifuged (Eppendorf 5415R) at 10,000 g (4°C) for 10 min [41-44]. After decanting the supernatant, 250 μl 70% ethanol (Merck) was added, and the pellet was dissolved; the mixture was centrifuged at 10,000 rpm for 10 min, and the supernatant was decanted gently. The pellet was air-dried under laminar air flow, and the dried pellet was resuspended in 50 μl nuclease-free water or 1× 10 mM Tris-HCl, 1 mM EDTA, pH 7.6 (TE), buffer and frozen at −20°C or at −80°C for storage [45-49].
A quantitative spectrophotometric assay of DNA was performed using a Cary 60 UV-visible spectrophotometer (Agilent Technologies, Santa Clara, CA, USA). Absorbance was measured at wavelengths of 260 and 280 (A260 and A280, respectively) nm. The absorbance quotient (OD260/OD280) provides an estimate of DNA purity. An absorbance quotient value of 1.8 < ratio (R) < 2.0 was considered to be good, purified DNA. A ratio of < 1.8 is indicative of protein contamination, where as a ratio of > 2.0 indicates RNA contamination.
The integrity of genomic DNA was tested by resolving DNA extracts on a 0.8% agarose gel by electrophoresis (Bio-Rad, Hercules, CA, USA), followed by visualization with ethidium bromide staining. Each DNA sample was graded, according to the electrophoretic migration of sample DNA compared with a known molecular weight marker (Fermentas, Thermo Scientific) [50-53].
PCR Amplification of mtDNA D-Loop Region for PCR-Based Assays
The adequacy of buccal, DNA extracts for the PCR-based assays was assessed by amplifying the mtDNA D-loop region, which was amplified by PCR using primers human mitochondrial (HMt)-F (5´-CACCATTAGCACCCAAAGCT-3´) and HMt-R (5´-CTGTTAAAAGTGCATACCGCCA-3´), as described by Salas, et al. for the HVI region. PCR (vapo.protect; Eppendorf) was carried out in 25 μl total reaction volumes, each containing 100 ng template DNA, 0.2 pM of each primer, 2.5 μl 10× PCR buffer (final 1× PCR buffer), 1.5 mM MgCl2, 200 mM dNTPs, and 1 unit Taq DNA polymerase [28,29,30]. The reaction mixture was heated to 94°C for 5 min, followed by 40 cycles, each consisting of 1 min denaturation at 94°C, 1 min annealing at 63°C, 1.5 min extension at 72°C, and a final 10-min extension at 72°C. The PCR amplification products (10 μl) were subjected to electrophoresis (Bio-Rad) on 1.2% agarose gel in 1× Tris-acetate-EDTA buffer at 80 V for 30 min and stained with ethidium bromide (Himedia), and images were obtained in gel documentation (G-Box; Syngene, Cambridge, UK) systems.
The statistical analysis would be carried out using chi2 square with the SPSS software and anova for comparative analysis on DNA isolation over time using the Power value of (P < 0.05).
In this study the DNA yield obtained from the buccal swab from the first interval which is before rinsing as shown in Table 1, DNA yield ranged from 62-85 ng/μl and the after brushing which ranged from 66-82 ng/μl respectively.
From the first interval the highest yield of DNA was from the study subject three (S3) with 85 ng/μl and the lowest was from study subject two (S2) 62 ng/μl all shown in Table 1. From the second interval the highest yield was from the study subject (S3) with 82 ng/μl and the lowest was Subject two (S2) with 66 ng/μl respectively. The comparative mean DNA yield of before and after showed that before was higher that after (74.4 ± 4.5 and 72.8 ± 3.0) as shown in Table 2.
The DNA quality was measured using the UV spectrophotometric analyser with a wavelength of 260 and 280. The DNA quality from the first interval ranges from 1.64-1.87 and the second interval ranging from 1.62-1.82 respectively. Subject five (S5) showed the highest with an absorbance of 1.87 and Subject three (S3) with an absorbance of 1.64. Subject one and four (S1 and S4) in the second interval had the highest absorbance (1.82 and 1.82), the lowest was also observed in study subject three (S3) 1.62.
From the first interval there were bands of degradation shown on the gel electrophoresis, Subject one and three, (S1 and S3) shown in plate 1.0. Subject two, four and five (S2,4 and 5) showed bands of degradation in the second interval as shown in plate 2.0
The use of buccal swab for DNA extraction in forensic investigation depends on a lot factors which may alter the purity and quality of the DNA, it might be moderately or highly altered depending on the individual being swabbed, the swabbing technique and the number of cells captured [50-52]. In this study the DNA yield obtained from the buccal swab from the first interval shown in Table 1 the DNA yield which ranged from 62-85 ng/μl is in consonant with a previous study on buccal DNA yield with 60-85 ng/μl which was carried out to measure the DNA yield from buccal cells on different intervals [24,25]. As observed from the first interval there was no significant decrease in DNA quality and quantity (p < 0.05) which is suggestive that cell lysis buffer during processing can distort the quality and quantity of DNA as described by [33,34]. The DNA quality as observed on both intervals with an absorbance quotient of 1.8 < ratio < 2.0 was considered to be good or purified DNA [24]. In this study our lowest absorbance was 1.62 and the highest 1.87, which suggest that the DNA extracted from both intervals were pure or considered to be good [54]. The DNA quality from both interval showed no observable difference with their mean absorbance of 1.76 + 0.03 and 1.76 + 0.03 respectively this is suggestive that DNA can be extracted from both intervals and that brushing does not affect the quality of DNA which is in tandem with a previous work done by which establishes that brushing or mouth gaggling does not have any significance on DNA quality from buccal cell [18,19,22,26].
The bands of degradation observed in the first interval and second intervals of collection which (S1 and S3), (S2,S4 and S5) as shown in Figure 1, which shows the comparative quality of the DNA extracted, the distortion might be as a result of contamination of the DNA or due to the extent of nuclease enzyme concentration in the samples before digestion which is explained by [24].
The present study did not exhibit any significant difference between the extracted DNA PCR amplification products. However processing samples immediately as observed in this study may increase the quality of DNA extracted as a delay may contradict forensic investigation [24]. The isolated DNA from the study group generated PCR products of the same base-pair size of the target mitochondrial gene, the restriction digestion of the PCR products produced good digested products. This may be a result of the presence of good concentration of PCR amplification products and the absence of any impurity in the PCR.
The statistical analysis would be carried out using chi2 square with the SPSS software and anova for comparative analysis on DNA isolation over time using the Power value of (P < 0.05).
The successful sample collection and the extraction of genomic DNA from buccal swabs in this study where non-invasive and reliable alternatives to the prickly invasive blood sampling techniques as observed by previous contributors [26,34].
The buccal swab collected from both intervals yielded desirable DNA extracts and when compared with the primer amplification product yielded same base pair size and so DNA can be extracted at both intervals irrespective of brushing or mouth gaggling as it possess no effect on DNA quality and yield, as impurity affects the reliability and authenticity of the DNA extracted [52-54].
Buccal cell DNA quality is of great importance in solving and investigating events in Forensic biology. The quality and quantity of DNA extracted is dependent on factors which may be both intrinsic and extrinsic, the mode of collection, extraction and aseptic techniques during amplification. An empty mouth is still of better preference when collecting buccal swab DNA as food in the mouth may cause contamination. Brushing does not affect DNA extraction as seen in this study in both intervals which were suitable for amplification. More studies should be carried out on a larger scale to determine the effect of the various shades of tooth paste, mouth wash and alcohol consumption as it may cause a deleterious effect on buccal cell DNA.
We recognise the immense support of the staffs of the department of cell biology and genetics of the university of Lagos and also gratitude to the National Academy for the Advancement of Science for their support in grants and laboratory space for this research.

![]()

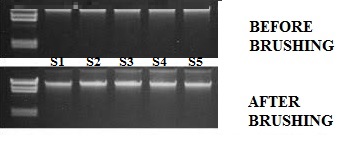 |
Plate 1- Before brushing; Plate 2- After brushing |
DNA YIELD (ng/μl) |
DNA QUALITY (AB: 260/280) |
|||
|---|---|---|---|---|
BEFORE |
AFTER |
BEFORE |
AFTER |
|
S1 |
83 |
78 |
1.72 |
1.82 |
S2 |
62 |
66 |
1.82 |
1.78 |
S3 |
85 |
82 |
1.64 |
1.62 |
S4 |
66 |
68 |
1.76 |
1.82 |
S5 |
76 |
70 |
1.86 |
1.78 |
| Key: AB= absorbance, S= student S1-study subject one; S2-study subject two; S3-study subject three; S4-study subject four; S5-study subject five Table 1: Showing comparative DNA yield and quality |
||||
BEFORE |
AFTER |
pvalue |
|
|---|---|---|---|
DNA YIELD ng/µl |
74.4 + 4.5 |
72.8 + 3.0 |
0.09 |
SPECTROPHOTOMETRIC ANALYSIS (AB 260/280) |
1.76 + 0.03 |
1.76 + 0.03 |
0.00 |
| Key: AB=absorbance Table 2: The mean comparative analysis of the study subjects |
|||


