Open Access
Review Article
Max Screen >>
ISSN: 2639-9288
Copyright: © 2018 Roy BC. This is an open-access article distributed under the terms of the Creative Commons Attribution License, which permits unrestricted use, distribution, and reproduction in any medium, provided the original author and source are credited.
Related article at Pubmed, Google Scholar
Air pollution is a major and growing risk factor for ill health in India, contributing significantly to the country’s burden of disease. As per the Global Burden of Disease comparative risk assessment for 2015, air pollution exposure contributes to approximately 1.8 million premature deaths and 49 million disability adjusted life-years (DALYs) lost, ranking it among the top risk factors for ill health in India. Home to 10 of the top 20 cities with the highest annual average levels of PM2.5 as per the WHO Urban Ambient Air Quality Database (2016), and with several studies showing a worsening trend over the time, it is safe to say that rapid urbanization and industrial development have adversely affected urban air quality due to vehicular and industrial emissions. Simultaneously, over two-thirds of rural Indians caught in the ‘chulha trap’ use biomass fuels such as wood, dung or coal to satisfy their cooking and heating needs, resulting in smoke-filled homes and extremely high levels of exposure especially to women and children [1]. With respect to other cities of India, our smallest state Tripura (Agartala city) also have the high value of PM10 & PM2.5.The value of particulate matter is above the CPCB standards and also WHO standards. On the Basis of the study report we made some suggestion to overcome these conditions.
Keywords: Study area; Measurement of PM10; PM2.5; NOx ; SOx; Source; way point
Air pollution refers to the release of the air pollutants that are detrimental to human health and the planet. Basically the cause of air pollution “Most air pollution comes from energy use and production”, says John Walke, director of the Clean Air program at NRDC [2]. Air pollution not only contributes to climate change but is also exacerbated by it. Climate change also increases the production of allergenic air pollutants including mold (thanks to damp conditions caused by extreme weather and increased flooding) and pollen (Due longer pollen season and more pollen. The worst forms of air pollutions are often found in Indian cities .Particulate matter (PM), one of the most widely monitored pollutants in India, is the main cause of the increasing air pollution in this South Asian subcontinent. The particulate matter build up can reach as high as five times above the safety limits for some cities in India. This creates a major health concern for the people living and breathing in the polluted air every day. The National Air Quality Monitoring Program claims that nearly half of the Indian cities monitored have reached critical levels of particulate matter. There are sixty-three cities with critical levels, thirty-six cities with high levels, and nineteen cities at moderate levels. In 2007, only three out of 121 cities in India that had been analyzed were considered at low pollution level. These cities were Dewas, Tirupati, and Kozhikode [3]. Northern India has been known to have increasing air pollution while southern India has shown the opposite trend. Indoor pollution also plays a big role in the overall status of India’s polluted air. In that situation, we have started to work with air pollution of our north eastern smallest state Tripura (Agartala City) in collaboration with Tripura State Pollution Control Board .In the present paper, we have attempted to bring the systematic analysis of these with respect to another state and include the study report of the particulate matter i.e. PM10 and PM2.5, and SOx, NOx value. On the basis of the study report we made some suggestion to overcome these problems (Figure 1).
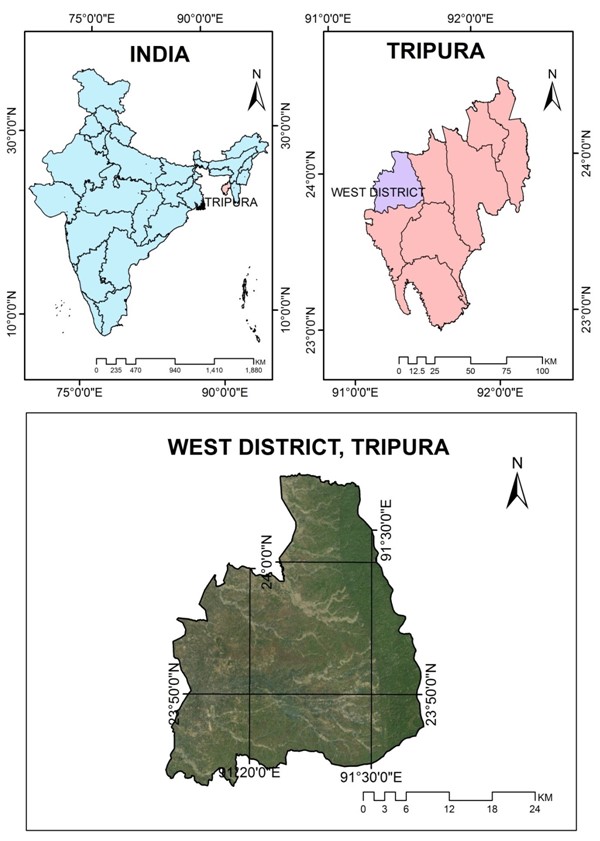
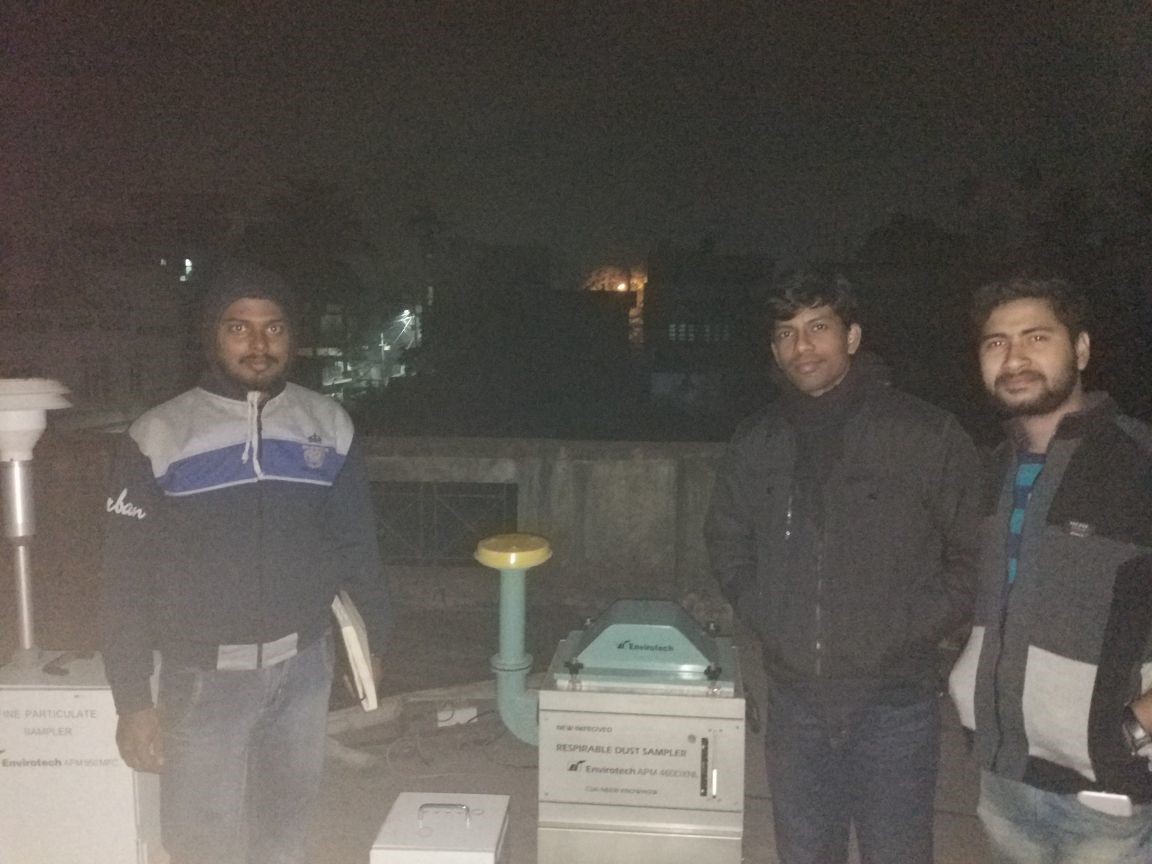
The geographical location of our study area is N 230 49’13.4”, E 0910 16’ 19.1”. We have selected this area as study because the area is too much congested, traffic jam even most of the motor vehicles are passing on this way. The area is full of violent settlements. As per the census report, west Tripura district has 4,10,565 households, population is 17,25,739. Total vehicle strength throughout the state is 4,42,331 and west Tripura district -2,46,779 (Figure 2 and Figure 3).
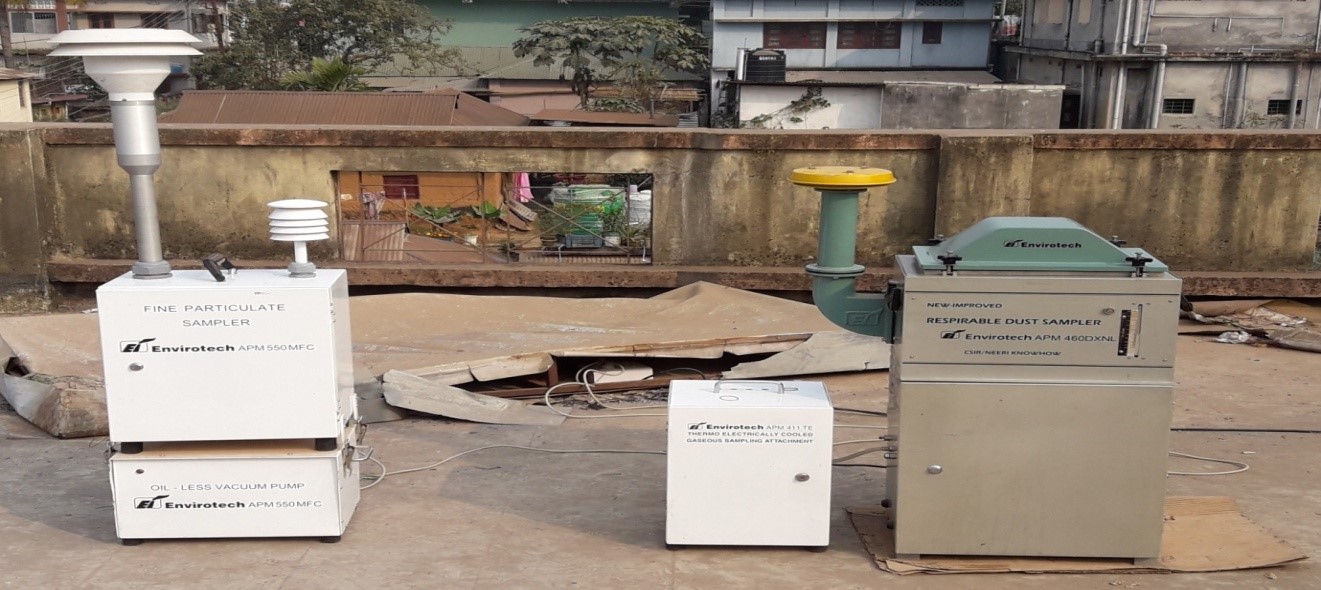
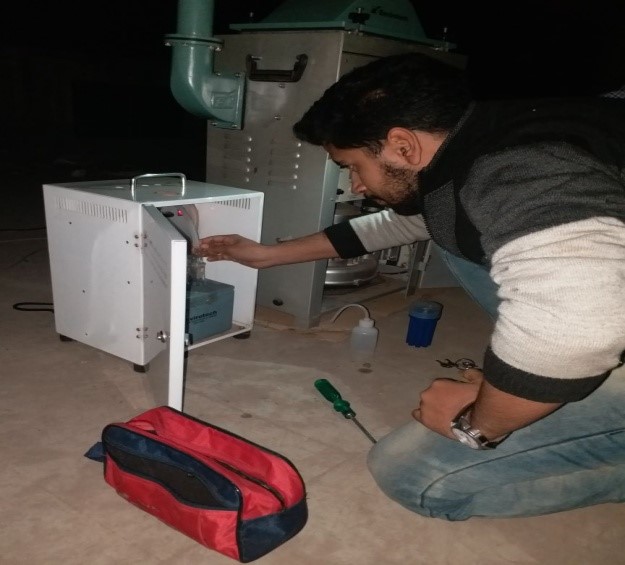
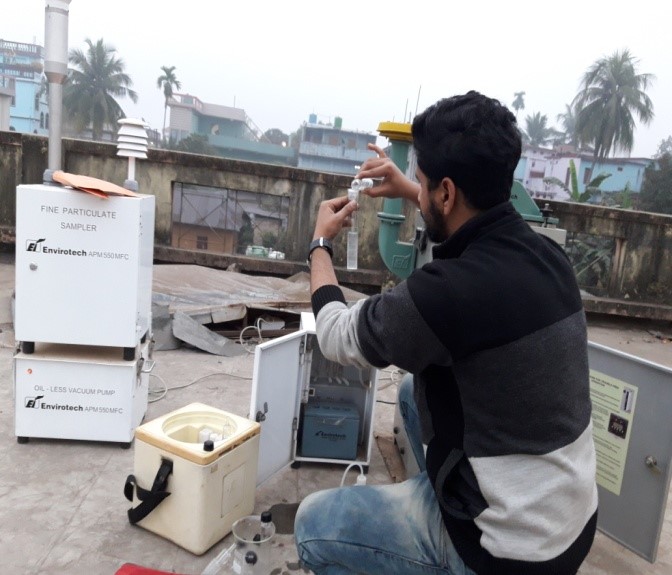
To understand the effect of concentration of pollutants in Agartala city, we have analysed the concentrations of PM10 and PM2.5 along with mixing ratios of trace gases (NOx, CO, SOx and NH3). We measured during the month of January – February i.e. post monsoon and the value is too high from the national ambient air quality standards. The study found that exposure of high PM2.5, PM10, NO2 and SO2 concentrations, gender, and perception of health effects were significant determinants of individual odour annoyance reporting. The observed association between odour annoyance and modelled ambient pollution suggest that individual and census tract level annoyance scores may serve as proxies for air quality in exposed communities because they capture the area spatial variability of pollution. The concentration of the particulate matter in this area is really remarkable. We also measured the value of SOx and NOx of this area. The method that we use to determine the SOx and NOx is modified West and Gaeke method. We measured the value (post monsoon) by respirable dust sampler for PM10 and Fine Particulate sampler for PM2.5 provided by TRIPURA STATE POLLUTION CONTROL BOARD (Figure 4).
In the above bar diagram we can see that the particulate matter of Delhi is annually increasing even it passes above the limit of National Annual Ambient Standard.
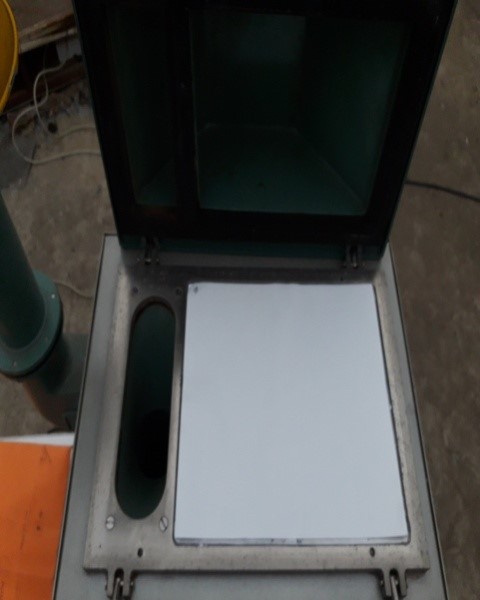
We used these two machines to find the particulate matter of PM10 and PM2.5 which is given below (Figure 5).
The accuracy of a PM10 sampling depends on the several factors. One of the most important of these factors is the procedure for handling and weighing the filter paper.
Filter Handling: Quartz filter material is very fragile. Care must be taken not to tear the filters. A filter identification number must be assigned to each filter. The particulates are trapped on the rough side so it is always up. The labels should be on the smooth side to avoid confusion.
Visual Inspection: All filters must be visually inspected for defects that include pinholes, loose material, discoloration, no uniformity and other irregularities.
Filter Equilibration:Filters must be equilibrated in a conditioning environment for at least 24 h before being weighed. This can be done in an equilibration chamber or in an environmentally controlled weighing room. Relative humidity should be held constant at a mean value between 20 and 45% ± 5%. Temperature should be held constant with a mean value between 15 and 30°C ± 3°C.
Initial Filter Weighing Procedures: Filters must be weighed on an analytical balance with a minimum resolution of 0.1mg and a precision of 0.5mg. Tare the balance and weigh the filter paper, making sure that a stable reading is obtained. Return the weighed filters to their original box, identify up with a piece of tracing paper between filters.
Post-Sampling Documentation and Inspection: Upon receipt of exposed the filters from the field, laboratory personnel should verify that the filters are in good condition and that necessary data such as sampling time, average flow rate, average temperature and pressure is present. Make sure that the filter identity matches the laboratory record. Place the filters in a conditioning environment (chamber or controlled room) and equilibrate for 24h before weighing.
Final Weighing: Perform all calibrations as discussed in the previous section. Place the exposed filter on the balance, let stabilize, and record the final weight. Enter the final weight into the spread sheet or other data recording medium [4] (Table 1).
Calculations of PM10:
1.Calculate the total volume of air sampled using the following equation (using MODIFIED WEST AND GAEKE METHOD)
V = QQa × t (μg/m3)
Where,
V = volume of air sampled
Qa = average sampler flow rate across the sampling time=1
t = total elapsed sampling time in minutes.
2. Calculate the total PM10 concentration/n in μg/m3 :
PM10 = (Wf – Wi)x 106 /V
Where,
PM10 = PM10 mass concentration
106 = conversion factor for grams to micrograms Wf = final weight of exposed filter
Wi = initial weight of unexposed filter in gm.
V = volume of air sampled
Measurement of PM2.5: Filter handling is critical for PM2.5 analysis. Filters should be removed as soon as possible from the sampler and covered immediately. Filters need to be equilibrated in a controlled environment for 24h before final weighing. The process of measuring PM2.5 is almost similar as PM10 controlled environment requirements for PM2.5 is more conservative than for PM10. Weighing procedures for PM2.5 also are more conservative than for PM10.
Since the following is a short summary of PM2.5 weighing procedures:
• All filters should be placed in a controlled environment for 24h for both pre-sample and post-sample filter.
• Field blanks and lab blanks should be run routinely [5] (Table 2-6 and Figure 6-9).
PM2.5 = (Wf – Wi)x106/V
Where,
PM2.5 = mass of PM2.5 in μg m–3
Wi = initial weight in g
Wf = final weight in g
V = ambient volume of air sampled
The formula we used to measure the concentration of NOx is,

Where,
μg/NO2- = NO2- concentration in analyzed sample.
Va = Volume of air sample, m3
0.82= Sampling efficiency.
D = Dilution factor.
Vs = Final volume of sampling solution.
Vt = Aliquot take for analysis.
The formula we used to measure the concentration of SOx is,

Where,
A = Sample absorbance.
A0 = Reagent blank absorbance.
103 = Conversion litres to cubic meters.
B = Calibration factor, μg/ absorbance
V = Volume of air sampled in liter.
The above method of calculation is taken from Modified West and Gaeke method.
From the above calculation we can see that the value of PM10 and PM2.5 are above the CPCB standards and the value of SOx and NOx are quite normal (Table 7).
Particulate matter (PM), also known as particle pollution, is a complex mixture of extremely small particles and liquid droplets that get into the air. Once inhaled, these particles can affect the heart and lungs and cause serious health effects. Particulate Components of particulate matter (PM) include finely divided solids or liquids such as dust, fly ash, soot, smoke, aerosols, fumes, mists and condensing vapours that can be suspended in the air for extended periods of time [5].
Fine particles (PM2.5) also form from the reaction of gases or droplets in the atmosphere from sources such as power plants. These chemical reactions can occur miles from the original source of the emission. The fine particles measured in the air are carried by wind from out-of-state sources [6].
The value of particulate matter in this area was very high even it across the standards of CPCB guidelines but the value of SOx and NOx are quite normal.
The major source of increasing PM of this area is (Table 8 and Figure 10)
• Huge traffic in this area
• Vehicle strength of our state immense increasing.
• Now a day’s even number of buildings and factories are constructed by mankind.
• There are many vehicles which doesn’t have proper exhaust system because of which the air is being polluting more.
• Roadside deforestation.
• Too much volatile (hydrocarbons), toxic material used for road carpeting.
• Uses of air condensing system increasing in unplanned manner.
Air pollutants can be in the form of particulate matter which can be very harmful to our health. The level of effect usually depends on the length of time of exposure, as well the kind and concentration of chemicals and particles exposed to [7].
The size of particles is directly linked to their potential for causing health problems. Small particles less than 10 micrometers in diameter pose the greatest problems, because they can get deep into your lungs and some may even get into your bloodstream. Short-term effects include irritation to the eyes, nose and throat and upper respiratory infections such as bronchitis and pneumonia. Others include headaches, nausea, and allergic reactions. Short-term air pollution can aggravate the medical conditions of individuals with asthma and emphysema. Long-term health effects can include chronic respiratory disease, lung cancer, heart disease, and even damage to the brain, nerves, liver, or kidneys. Continual exposure to air pollution affects the lungs of growing children and may aggravate or complicate medical conditions in the elderly [8].
PM10 and PM2.5 include inhalable particles that are small enough to penetrate the thoracic region of the respiratory system. PM10 can be breathed into the lungs, and therefore, its health effects are more severe than large particles. PM2.5 can be breathed even more deeply into the alveoli of the lungs, where they remain for a long time and can cause the greatest amount of damage [9].
There is no evidence of a safe level of exposure or a threshold below which no adverse health effects occur. Patients with respiratory diseases account for a large proportion of these non-accidental deaths caused by air pollution. Given that PM2.5 causes asthma, respiratory inflammation, jeopardizes lung functions and even promotes cancers, its impact on human respiratory system should not be dismissed [10].
Particles can be carried over long distances by wind and then settle on ground or water. Depending on their chemical composition, the effects of this settling may include the making lakes and streams acidic, changing the nutrient balance in coastal waters and large river basins, depleting the nutrients in soil, damaging sensitive forests and farm crops, affecting the diversity of ecosystems, contributing to acid rain effects.
• Mulch garden refuse instead of burning it.
• Diesel vehicles, including trucks, are a key source of fine particles. Reduce diesel emissions by replacing older engines with newer and cleaner engines. Switch to cleaner burning appliances. For example, pellet stoves produce less particulate matter than traditional wood stoves
• Pay attention to recommended maintenance schedules for your vehicle.
• Walk, cycle, take public transit and carpool whenever possible.
• Take action to reduce wildfires. Practice safe backyard burning and careful use of campfires.
• Use plastic material as road carpeting because we know that the plastic material road is more durable and heat resistance.
• Proper forestation at the road side.
• Limit the use of fireplaces and wood stoves. When using these appliances, make sure that wood is burned properly. Use wood that is well seasoned instead of wet or green. Stoves should also meet CPCB emission standards.
• Use of musk by common people to prevent the entrance of particulate matters at least up to a certain limit.
In the above study the value of Particulate matter are high but concentration of Sulphur Di-oxide (SO2) and Nitrogen Di-oxide (NO2) were under controlled compared to NATIONAL AMBIENT AIR QUALITY STANDARDS. Motor vehicles and road side deforestation are major sources of air pollution in Agartala. In Agartala, there is no such big industrial areas built till today, so industrial pollution is quite less as compare to other big cities. Emission from construction industries, diesel vehicles, older engines used in public transport can be minimised by adopting best practices such as; use of water sprays for dust suppression, creating ridges to prevent dust, compaction of disturbed soil, prevention of dumping of earth materials along road side as well as forestation, use of newer engines in vehicles, road carpeting by using plastic materials etc. Restrictions may be imposed over the number of vehicles owned by an individual or by a family. There should be strict restriction on old polluting vehicles and subsidies can be given on the vehicles running on cleaner fuels, up gradation of public transport is necessary by improving service quality, enhancing the number of buses and better road management. Improvement in traffic signal co-ordination for continuous traffic flow to reduce traffic jam and idling time can also help to minimise air pollution. Corporate firms and government offices may draw up an action plan to have bus or cab services for their employees with reasonable rates. Such ideas will implement by government as well as public to minimise the air pollution. All the above necessary points should be taken care not only by the government officials but also by the common people to avoid the smoky weather faced by the Delhi public and to provide a pollution free environment to our next generation.
The authors hereby acknowledges the kind and wholehearted support received from Tripura State Pollution Control board, Agartala for providing machineries, Mr. Avishek Choudhuri, Hydrogeologist, TSAC and Mr. Rajib Paul , TPCB, Colleague Debaleena Pal, Anamika Adhikari, Barnali Das helping in the analysis of data and Principal, MBB College for providing laboratory facilities in carrying out the analysis. This study was supported by the Tripura State Pollution Control board, Govt. of Tripura.

![]()

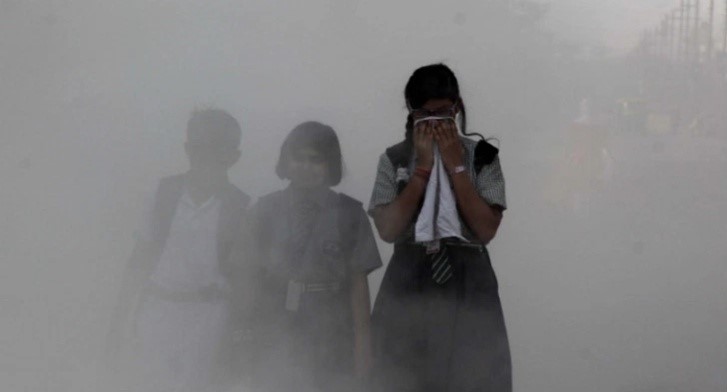 |
| Figure 1: Picture of increasing air pollution |
 |
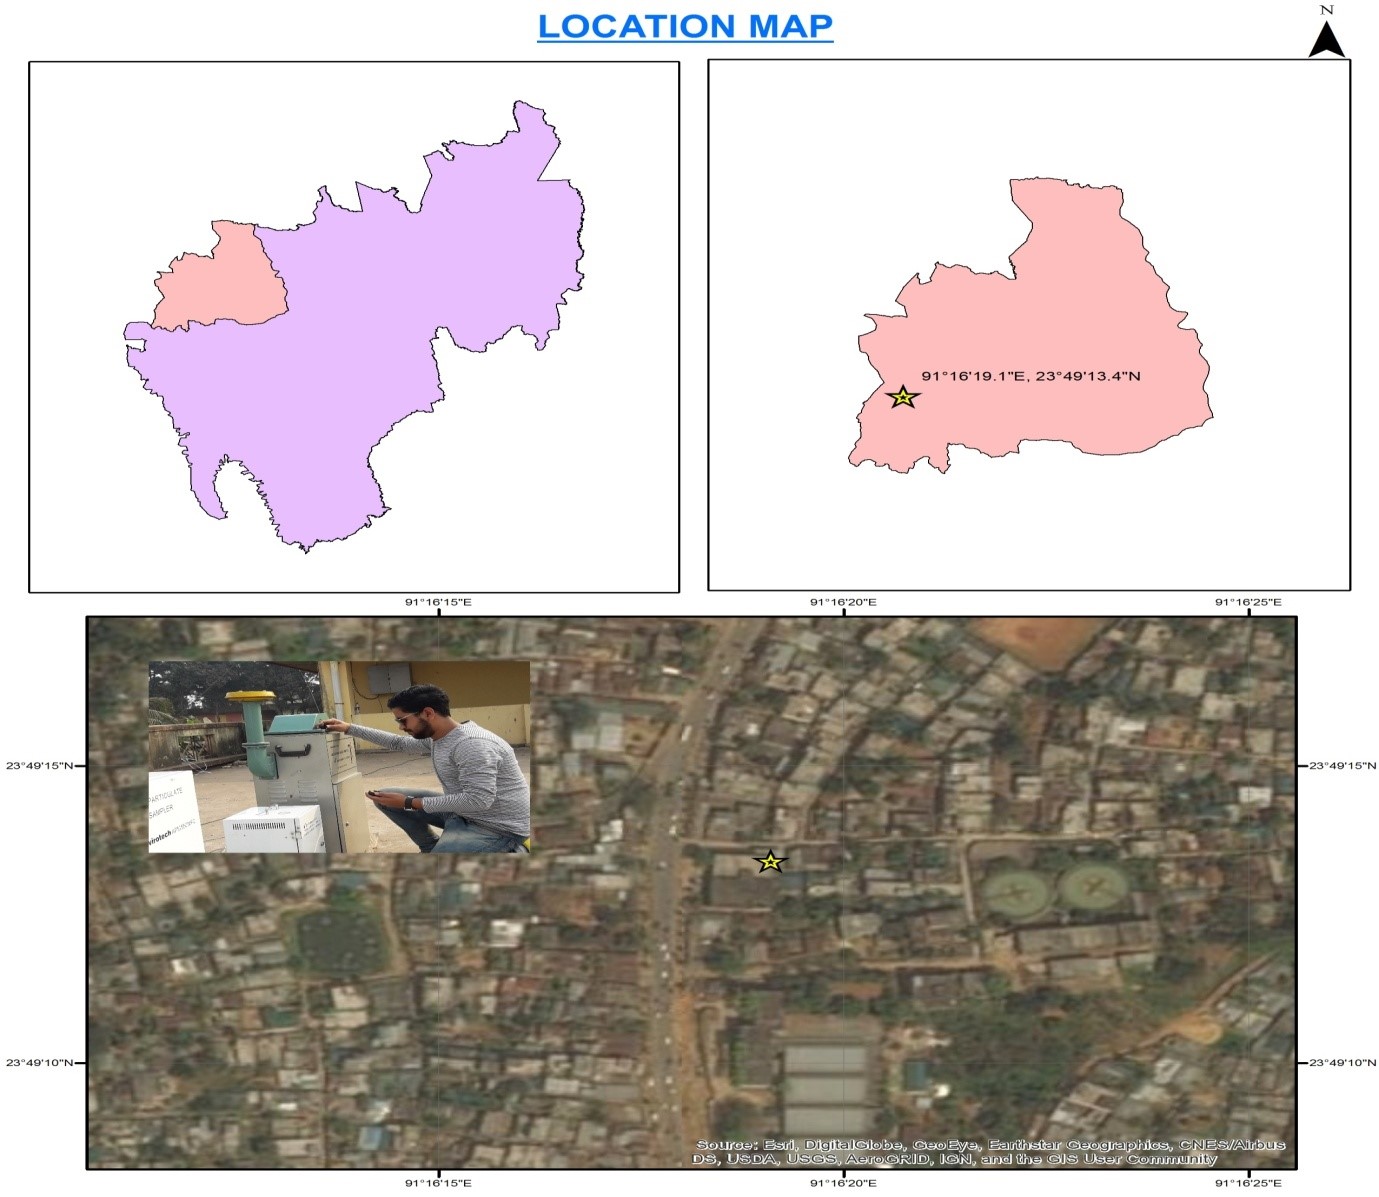 |
| Figure 2: GSI picture of study area |
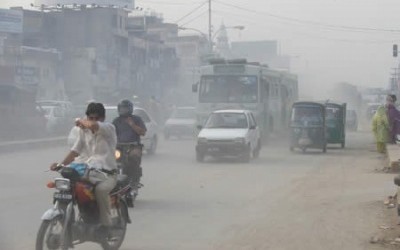 |
| Figure 3: Air pollution around the study area |
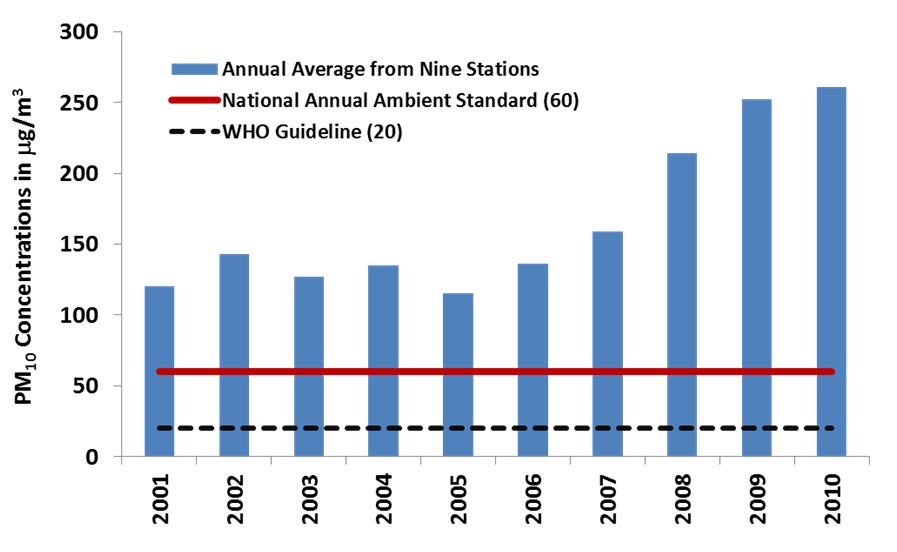 |
| Figure 4: Concentration of Particulate matter in Delhi from 2001�2010 |
 |
 |
| Figure 5: Respirable dust sampler for PM10 and Fine particle sampler for PM2.5 |
 |
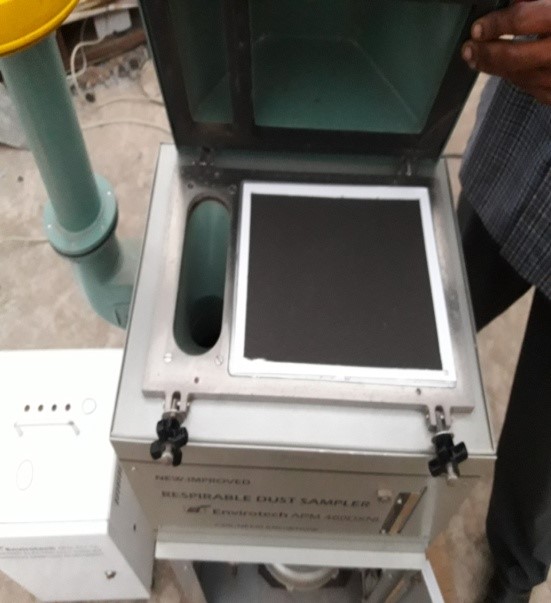 |
| Figure 6: Before and after experiment of PM10 sampling filter paper |
 |
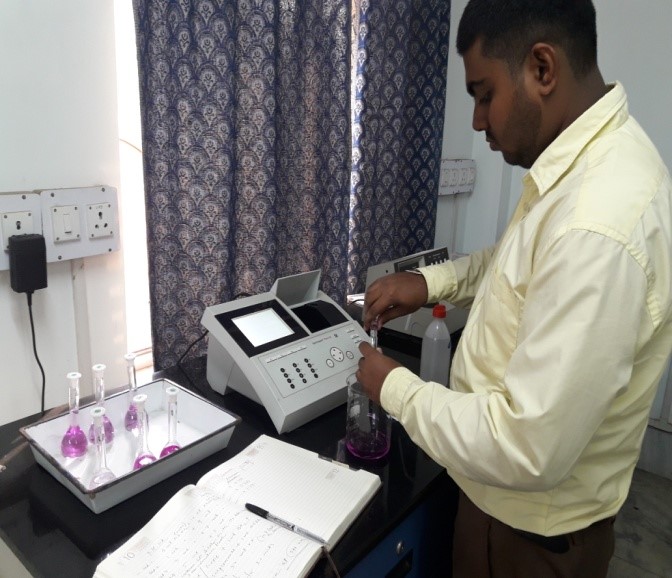 |
| Figure 7: Measuring the value of SOx and NOx |
 |
| Figure 8: Calibration curve for NOx |
 |
| Figure 9: Calibration curve for SOx |
 |
| Figure 10: Vehicle strength of our state last 7 years |
Sl. No. |
Shift (timing) |
Initial weight of sampling filter paper (gm) |
Final+* weight of sampling filter paper (gm) |
value of PM10 (µg/ m3) |
Mean value of PM10 (µg/m3) for 24 hrs |
1. |
1st shift (1:48 pm -10:03pm) |
2.8463 |
3.0647 |
455 |
|
2. |
2nd shift (10.10pm -6.05am) |
2.8503 |
2.9700 |
249.375 |
|
3. |
3rd shift (6.15am – 2.08pm) |
2.8454 |
2.9545 |
227.291 |
310.555 |
|
|
|
|
|
|
Sl. No |
Shifting (Timings) |
Initial weight of sampling filter paper (gm) |
Final weight of sampling filter paper (gm) |
Value of PM2.5 (µg/m3) |
Mean value of PM2.5 (µg/m3) for 24 hrs |
1 |
1st shift (1:48 pm -10:03pm) |
0.1449 |
0.1474 |
207.986 |
155.296 |
Sl. NO. |
Concentration |
Absorbance |
1 |
0 |
0.034 |
Shifting( timing) |
Absorbance |
Concentration (µgNO2-/m3) |
NO2 Concentration in Air Sample (µgNO2/m3) |
1st shift (1:48pm-10:03pm) |
0.188 |
0.417 |
11.38 |
Sl. NO. |
Concentration |
Absorbance |
1 |
1 |
0.13 |
Shifting (timing) |
Absorbance |
SO2 Concentration In Air Sample (µgSO2/m3) |
1st shift(1:48pm-10:03pm) |
0.029 |
12.082 |
Pollutants |
Time, weight, average |
Concentration in ambient air Industrial, Residential, Rural areas (CPCB standards 2009) |
Measured pollutants Around the study area (agartala city) |
Methods of measurement |
|
Sulphur Dioxide (µg/m3) |
Annual * 24Hours** |
50 |
|
Improved West and Gaeke Method |
|
Nitrogen Dioxide (µg/m3) |
Annual* |
40 |
11.444 |
Jacob & Hochheiser modified |
|
Particulate Matter |
Annual* 24Hours** |
60 100 |
310.555 |
Gravimetric Method |
|
Particulate Matter |
Annual* 24Hours** |
40 60 |
155.296 |
Gravimetric Method |
|
VEHICLE STRENGTH |
YEARS |
|
239077 |
2012 |
|
268037 |
2013 |
|
300369 |
2014 |
|
337063 |
2015 |
|
376725 |
2016 |
|
422691 |
2017 |
|
442331 |
2018 |
|


