Open Access
Research Article
Max Screen >>
ISSN: 2394-6520
Copyright: © 2016 El-Sharkawy YH. This is an open-access article distributed under the terms of the Creative Commons Attribution License, which permits unrestricted use, distribution, and reproduction in any medium, provided the original author and source are credited.
Related article at Pubmed, Google Scholar
Breast cancer being one of the most frequent form of cancer, is the leading cause of cancer deaths in women worldwide. Early detection can greatly improve a woman`s chances for survival. In this paper we introduce an economic and accurate optical system for breast cancer detection. We have investigated the optical properties of human breast tissues using the He:Ne laser and optical spectroscopy. The materials investigated included non-malignant and malignant breast tissue, which almost have similar grain sizes and thicknesses. The informative features of calculated optical properties of breast tissue at 633 nm allow one to discriminate between normal and malignant sample also Monte Carlo simulation are used to describe the propagation of light . An experimental scheme is applied for detection and imaging the reflected light from the sample to extract information of infected tissue. Calculations of the results demonstrate that the absorption coefficient for cancerous tissue is 10.07 cm-1 relative to 33.66 cm-1 for non-malignant (normal) breast tissue and the laser reflectance is 770.5 cm-1 for cancerous tissue relative to 261.43 cm-1 for normal tissue, which can be used for diagnostic purposes.
Keywords: Optical imaging; Optical spectroscopy; Non-malignant and malignant breast tissue optical properties; Breast cancer detection
Breast cancer is a malignant tumor that starts in the cells of the breast. A malignant tumor is a group of cancer cells that can grow into surrounding tissues or metastasize to distant areas of the body. It has been estimated that 1 out of every 9 women will develop breast cancer during her lifetime and approximately 30% of them will die of the disease [1]. The beneficial effect of screening mammography has been shown in several studies world-wide where 20%-50% reduction in breast cancer mortality with screening has been demonstrated [2-4]. In general, the smaller the lesion at the time of detection, the better the treatment efficiency [5,6]. Current first-line breast cancer detection strategy still depends essentially on clinical examination and mammography. The limitations of the former, with its reported sensitivity rate often below 65% is well-recognized, and even the proposed value of self-breast examination is now being contested [7,8]. While mammography is accepted as the most reliable and cost-effective imaging modality, its contribution continues to be challenged with persistent false-negative rates ranging up to 30%; with decreasing sensitivity in patients on estrogen replacement therapy [9,10]. In addition, there is recent data suggesting that denser and less informative mammography images are precisely those associated with an increased cancer risk [11].
Breast cancer, above a few millimeters in diameter, initiate very active angiogenesis, believed to be characteristic of all rapidly growing tumors [12]. The increase of blood vessels does nevertheless fail to deliver adequate oxygen to the tumor and thus most tumors are hypoxic [13]. Therefore the optical technique, with its unique ability to measure oxygenation state and blood volume content represents an excellent candidate for cancer diagnosis. The optical method, being a functional probe, offers a new dimension for tumor differentiation that promises to offer enhanced detection specificity, especially when combined with the sensitivity and high resolution of existing imaging methods.
For most biomedical optics applications, optical properties of tissue determine the light distribution in tissue and the diffusive reflectance intensity. Most biological tissues are not translucent materials whose absorption coefficient can be easily calculated from transmission measurement with the Beer-Lambert law. Many complicated mathematical models have been applied to evaluate the absorption property of a scattering material from measurements. Among them, photon diffusion model and Monte Carlo model are most often used [14]. Since biological soft tissues are non-homogeneous, volume fractions and distribution of tissue constituents will affect the absorption property. Therefore, large variation in tissue absorption property is generally found among different samples, and it is very difficult to accurately measure the absorption properties of biological tissues. By assuming the intrinsic absorption properties of each tissue constituent will remain the same after they are brought together to compose a tissue, the absorption spectra of tissue constituents are measured separately [15].
In many applications it can be useful to measure the absorption of light in sample or object, even samples that scatter light a lot. One example is to measure the amount of oxygen in blood, where knowing the absorption at two different wavelengths will give a ratio between the haemoglobin carrying oxygen and that without oxygen. Another example is that the absorption spectrum may vary between tissue types, possibly enabling detection of tumours if the characteristics of both healthy tissue and tumours are known [16,17].
The objective of this paper was firstly to determine the optical properties of non-malignant and malignant breast tissue that govern the transport of light through tissue to tumour discrimination and secondly to develop a model for light transport in tissue that makes it possible to predict various parameters of clinical interest. These parameters are the diffuse reflectance of tissue and the effective optical path-length for light transmitted through tissue, needed for the purpose of quantities spectroscopy, and the light distribution in tissue produced by an external light source in order to determine the deposited dose and for the study of imaging through tissue. Finally, breast cancer imaging, clinical diffuse optical tomography and related instrumentation are demonstrated. Bulk physiological properties were quantified for five bulk healthy subjects samples collected from national institute of cancer in the designed optical imaging system. The reconstructed for subjects with breast tumours and, tumour contrast with respect to normal tissue was found in total haemoglobin concentration and scattering was quantified for four breast carcinomas.
The work described in this paper was aimed to find a suitable laser to provide discrimination between normal and abnormal breast tissues by development of a method to accurately determine the optical properties of breast tissue, and using these methods to measure these properties from a representative range of tissue samples Use the model for light transport together with the data on the optical properties of breast to make predictions about a number of diffuse reflectance of normal and abnormal breast tissues. Finally design and implementation of optical imaging prototype system used for differentiate between normal and malignant breast tissue.
The propagation of light in a medium is described by its optical properties. The fundamental optical properties of interest are the absorption coefficient, μa, scattering coefficient, μs, total attenuation coefficient, μt, scattering anisotropy, g, reduced scattering coefficient, μsʹ, effective attenuation coefficient, μeff, and the tissue refractive index, n.
The optical properties of non-malignant and malignant human breast tissues are measured using 10 mw He:Ne laser at wavelength 633 nm and optical spectrophotometer (ocean optics) with spectral resolution (the increment step) of 0.1 nm at central wavelength. Spectral bandwidth was 1.2 nm, and wavelength accuracy was 0.6 nm. Average of ten scans was taken on each sample as its absorption spectrum. The light beam was collimated with a spherical lens of 150mm focal length before incident on the tissue sample. Based on the Beer-Lambert law, the attenuation coefficient c (λ) with unit m-1 was calculated from the transmission spectra through two light paths as:
I=I0 e-c(λ)L (1)
Where I is the transmitted intensity of light, I0 is the incident intensity of the light and L is the path
Monte Carlo (MC) uses another approach to simulate light transport in the turbid sample investigated. Also implementing the radioactive Transport Equation (RTE) it uses probability distributions, simulating the path of a package of photons by random walk steps.
At each step the photon can be scattered or absorbed randomly according to the absorption and scattering probability values, until the package exits the sample or is absorbed. By doing this a very large number of times and recording the end state for each photon, a statistical distribution of the light propagation cans be derived. MC simulations gives accurate results regardless of the scattering and absorption values but is computationally heavy and therefore takes long time.
In our Monte Carlo calculation, we start with a given set of optical parameters of the non-malignant (normal) and malignant breast tissue sample in which light propagate, such as μa, μs and g, and proceeds to obtain various quantities such as diffuse reflectance, diffuse transmittance and Absorption as a function of layer that are experimental observable.
For in vivo breast cancer imaging, we design and implement of an optical imaging system illustrated in Figure 1, was utilized to extract the amplitude of the detected diffuse reflected signal from tissue sample after illuminated by beam 10 mw He:Ne laser at central wavelength 633 nm. A lens-coupled 16-bit CCD camera system was used for collecting CW transmission data reflected from sample within anti-reflection coated glass viewing window. Automatic microscopic lenses to collect the light diffuse reflectance from the sample onto the CCD chip. To reduce ambient light, a long-pass colour-glass filter was placed in front of the lens and a light shielding box was placed surrounding the space between the viewing window and the camera. The camera interfaced to computer, for analysis and digital image processing. Three-dimensional images of breast were reconstructed for subjects with breast tumors and, tumor contrast with respect to normal tissue was found in total hemoglobin concentration and scattering and was quantified for twelve breast carcinomas.
First, we investigate the feasibility of using optical spectroscopy for identification of malignant in freshly excited breast tissue. The resultant decision algorithm shows good discrimination in classifying normal (non-malignant) tissue as well as malignant. Experiments on for twelve breast carcinomas from different patient interact with a laser at wavelength of 633 nm show the following results.
In order to establish a range of optical and Breast physiological properties for the healthy breast tissue, it might be expected that tumors and other diseased tissue are distinguished by the relative value of their total hemoglobin concentration and blood oxygen saturation. For example, malignant tumors might be expected to have high blood volume with low oxygen saturation since both a higher blood content and higher metabolism are necessary to achieve tumor growth in proliferating tumor cells. We choose He:Ne laser to interacts with the tissues for high scattering from blood volume.
The measured optical properties of the non-malignant and malignant breast tissues using optical spectroscopy are shown in Table 1. The average absorption coefficient for normal breast tissue samples at 633 nm is 23 (cm-1) with a standard deviation of 0.091, while the value of malignant tissue is 10.2 (cm-1) with a standard deviation of 0.19. The scattering coefficient is 78.2 and 290.3(cm-1) with a standard deviation of 0.02 for normal and malignant breast tissue respectively. The scattering anisotropy has an average of 0.9 at 633 nm. Calculated spectra for the absorption (μa) and scattering (μs) coefficients derived from experimental setup for normal and malignant breast tissue are illustrated in Figure 2 and 3.
The comparison of the optical properties between the non-malignant (normal) and malignant breast tissue samples at wavelengths 633 nm illustrated in Figure 4. The results showed that the absorption coefficient (μa) of normal breast tissue significantly increased at 633 nm compared with malignant tissues as shown in Figure 4(a). However, the value of the scattering coefficient (μs) illustrated in Figure 4(b), decreased significantly at 633 nm. The computed statistics did not show any significant changes for the anisotropy coefficient (g). These significant variations in optical properties especially scattering coefficient between non-malignant (normal) and malignant tissue at 633 nm give us a powerful tools for discriminations and detection of breast cancer using optical imaging system.
A three windows approach was designed as shown in Figure 5 and 6. The design split up the coexisting functions into two windows, one named absorption vs. depth, which focuses on the absorption of He:Ne laser in samples (normal and malignant breast tissue). While the other window, named reflectance vs. depth, and was solely to perform the light reflected from the samples and extract chromophore data from the measurements. The final windows named reflectance vs. depth vs. angle.
Figure 5 shows calculations of the diffuse reflectance of normal breast tissue for the case μs =78.2 cm-1, μa =23 cm-1, and g = 0.9. In general, the angular distribution is more peaked toward small angles than the Lambertian distribution, and the difference is greatest at positions small distances from the source.
Figure 6 shows calculations of the diffuse reflectance of malignant tissue for the case μs =290.3 cm-1, μa = 10.2 cm-1, and g =0.9.
The diffuse reflectance and depth of light penetration in a medium are dependent on the absorption and scattering coefficients. The penetration depth is a measure of how deep photons can travel and still be detected at the tissue surface. Figure 5 and 6 shows MC simulations for how the diffuse reflectance against penetration depth differs for normal and malignant breast tissue at 633 nm. The white line indicates the penetration depth for these photons. The diffuse reflectance 0.0661356 mm-1 and penetration depth almost 4 cm-1 in normal tissue compared to 0.395818 1 mm-1 and cm-1 for malignant tissue.
Breast tissues have been investigated with diffuse reflectance to diagnose normal and cancer as displayed in Table 2. It was shown that blood volume fraction is the main discriminator between malignant and non-malignant and being less abundant in normal tissue.
Diffuse reflectance spectroscopy investigations showed that blood is a discriminator between cancerous tissue and normal tissue as well as the scattering amplitude and slope.
The aim of optical imaging is to provide three-dimensional mapping of tissue structures using light. Photon selection and image reconstruction techniques are implemented to improve image contrast and resolution. Optical biopsy uses the difference in the optical properties of different tissue components to obtain information regarding the tissue makeup, status, and composition. Optical biopsy methods to detect breast cancer in vivo have been explored. Such optical biopsy methods have demonstrated high sensitivity for cancer detection in various parts of the body. Cancer specific optical “signatures” must be present in order to devise optical biopsy methods for cancer detection. These optical “signatures” may arise from differences in the biochemical and/or structural characteristics of the tissues.
Diffuse reflection imaging using He:Ne laser: Fresh tissue procured during breast conserving surgery was obtained directly from the Department of Pathology from patients who did not decline this use of their tissues. Tissues imaged by the optical imaging system are reported in section 2.3. Specimen imaging did not affect procedure time in the operating room or the content and verification of the final pathology report. Tissues were imaged within 10 minutes of resection and returned to pathology for standard histological processing.
Figure 7(a), illustrate a digital photograph taken from the breast samples of a 55-year-old patient affected by breast cancer, the affected tissue of size 2 cm3. All samples of more than 12 biopsies (some of this irradiated sample are seen at end of this section in rainbow styles) were irradiated for 10s at 10 mWcm−2 with the 633-nm visible laser with a laser spot size of 4.4 cm2.
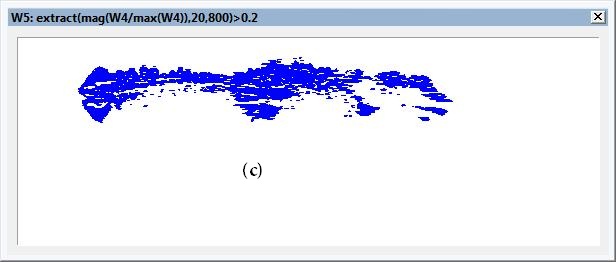
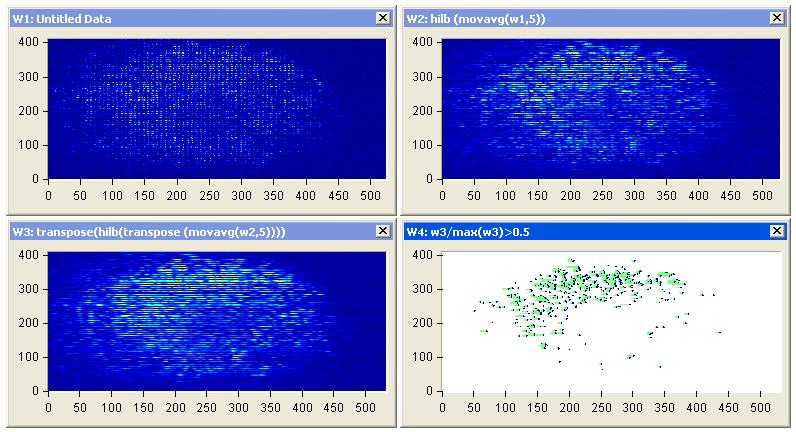
Representative images of diffuse scattering classification results due to changes on the diffuse reflectance from non-malignant and malignant tissues at 633 nm was monitored continuously by CCD camera of the surgical tissue for all diagnostic classes are shown in Figure 7(b). Tumor position and malignant tissue can be classified according to high intensity of reflectance is shown in Figure 7(c) after image processing and edge detection using Hilbert transform.
The intensity images of typical in vivo two affected breast samples in Figure 7(a) and (c) shows significant deviation from non-malignant and malignant tissue. The reflection amplitude increased linearly with most affected tissue and then tumors position can be discriminate.
In other words, for malignant areas, the reflection coefficient is higher than that of the non-malignant (normal) parts, but the opposite is the case for the absorption coefficient. This is the reason for the direct proportionality between the amplitude of the peak at the tumor position with the level of the cancer grads as shown in 3D image plotting illustrated in Figure 8(b) and (d) for two affected breast sample (Figure 8(a) and (c)).
Edge Detection using Hilbert transform: Figures 9(a) and 10(a) illustrate the tumors position using stable edge-detection techniques using Hilbert transforms of two affected breast cancer samples show in Figures 9(a) and 10(a). We select a biopsy at different tumor sizes and locations from women at almost the same edge and same tumor degree (nearly 55years, first degree), image it using our experiment, and save the diffuse reflectance image.
The sensitivity to edge orientation and the ability to localize an edge are both important properties of an edge detector. Figures 9(c) and 10(c) contains the analysis performed to determine the edge detector’s ability of edge localization of tumor affect on breast sample by setting the threshold to 0.2 of the edge height, edge location can be properly localized. Setting a high threshold (0.5 of the edge height )could cause the detector to identify and localized the most affected region of the sample as shown in Figures 11 and 12.
Tumor edge detection boundaries usually generate strong changes in image intensities as shown in Figures 9 and 10. Edge detection is used to identify these changes. An important property of edges is that they are less sensitive to illumination changes compared to color features. Algorithms that track the boundary of the objects usually use edges as the representative feature. Every tracking method requires an object detection mechanism either in every frame. A common approach for object detection is to use information in a single frame. This temporal information is usually in the form of frame differencing, which highlights changing regions in consecutive frames. Given the object regions in the image, it is then the tracker’s task to perform object correspondence from one frame to the next to generatethe tracks. We can determine the tumor location and its size at different slice depth of sample and use this information to identify the most affected region in the sample as shown in Figures 11 and 12.
Breast imaging is an essential cornerstone in the management of breast cancer. It serves not only as breastcancer screening, but also in diagnosis, treatment, and follow-up of patients with breast disease. Attempts toenhance the current imaging modalities and development of new technology are underway. Though X-ray mammography is the gold standard imaging modality, X-rays are carcinogenic. Ultrasound and MRI are restricted in their use to being secondary procedures owing to low sensitivity (US), poor specificity (MRI), and high-expense (MRI). There is thus a requirement for a technique that is relatively harmless and has the potential to detect the presence of carcinoma in a manner that is more specific and reliable than inspection of morphologic and anatomic changes.
In this paper, the motivation, theoretical background, experimental techniques and clinical resultson in vivo breast cancer imaging and monitoring using diffuse optical imaging and spectroscopy were presented. For the breast cancer imaging application, the quantification of tumor contrast based on total hemoglobin concentration and scattering throughthree-dimensional ploting of diffuse reflectance imaging reconstruction is demonstrated. The breast cancer imaging project is at an exploratory stage of finding the opticalcancer contrast, constantly improving techniques for better quantification.
The motivation behind optical imaging is to couple ultrasonic resolution with high contrast light due to a laser source. Our optical imaging can provide a maximum spatial resolution of ~o.11mm. Also it is safe, noninvasive and nonionizedtechnique which can be used as a complement technology along with traditional mammography in determining benign or malignant tumors. Unlike X-ray mammography, optical imaginge uses He:Ne laser ray which is nonionizedand noninvasive and known as a costeffective technique that does not need breast compression or low breast compression.

![]()

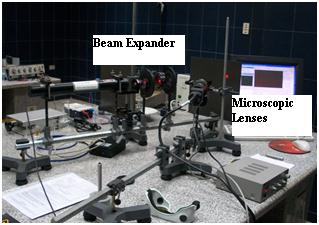 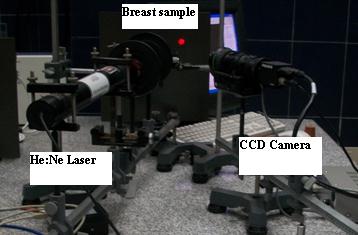 |
Figure 1: Photographs of the experimental Instrumentation setup during a measurement |
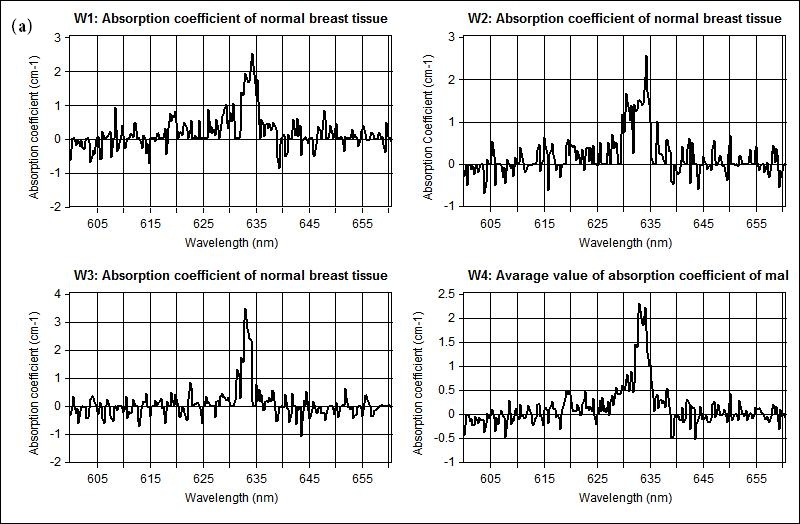 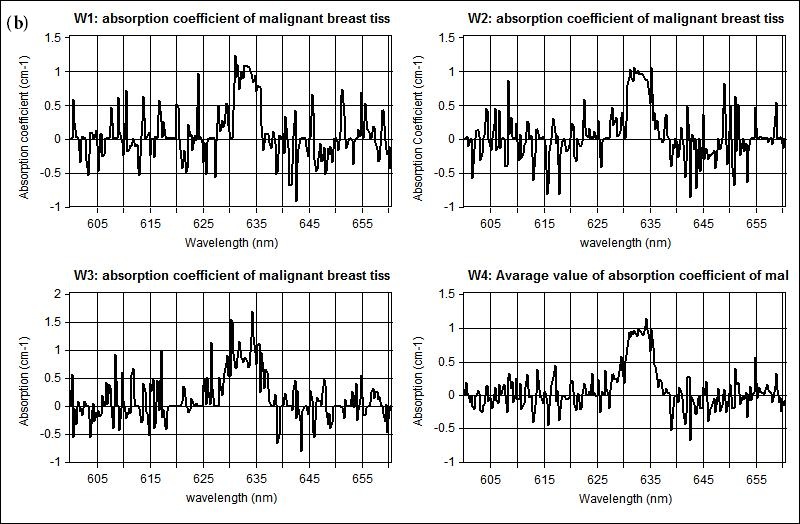 |
| Figure 2: Shows the measured absorption coefficient at 633 nm for scanned different three samples illustrated in (w1, w2, w3) and the averaging of the measured spectral in w4 for (a) non-malignant (normal), and (b) malignant breast tissue respectively |
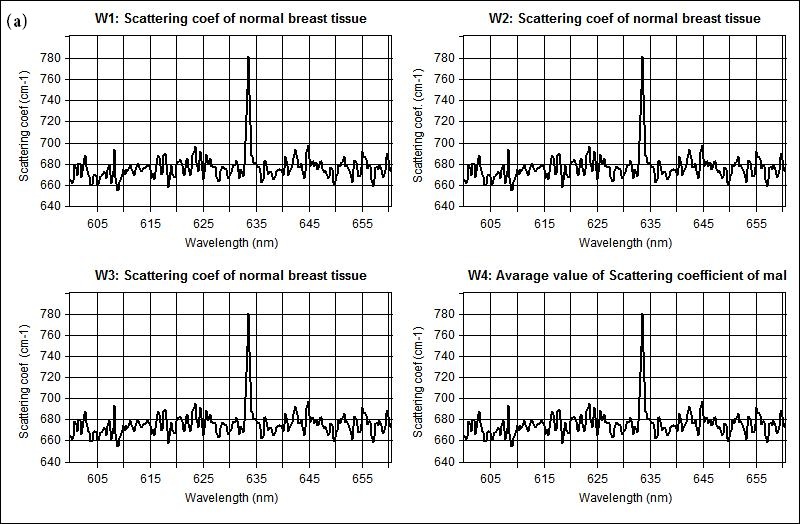 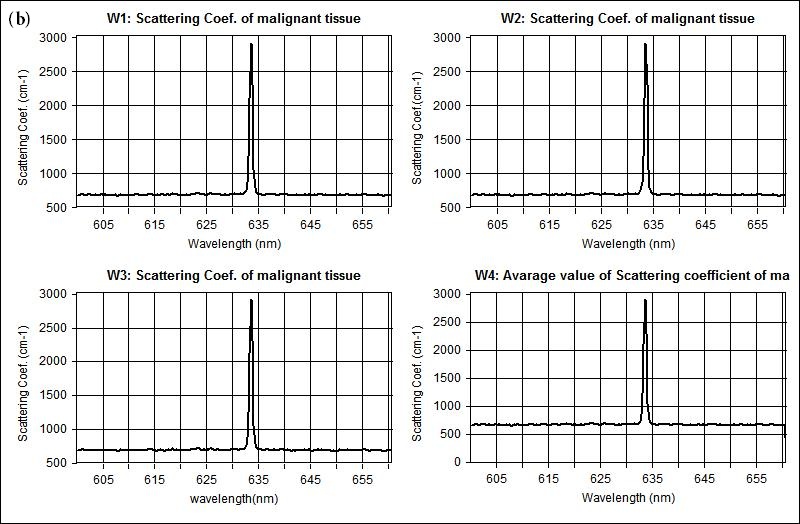 |
Figure 3: Shows representative scattering coefficient spectra acquired from (a) non-malignant (normal), and (b) malignant breast tissue respectively |
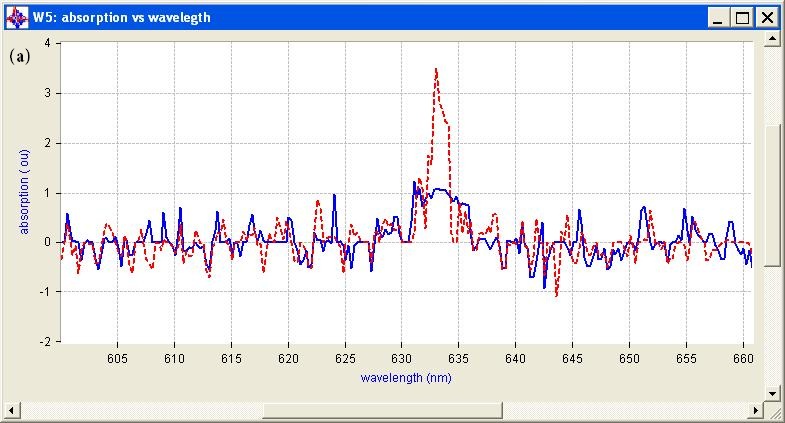 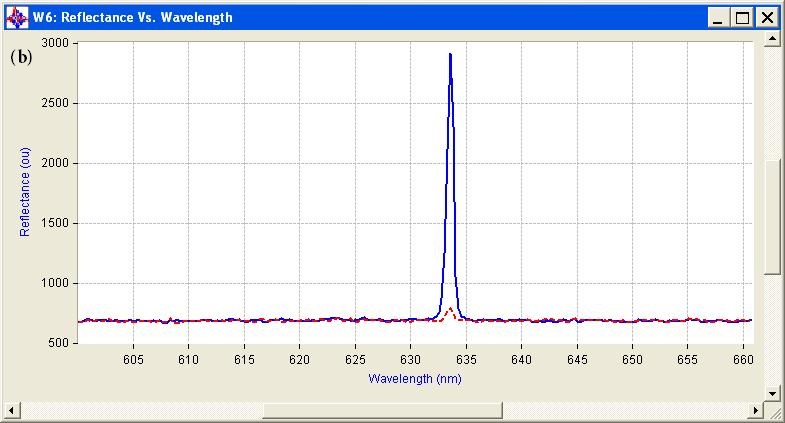 |
| Figure 4: Calculated spectra for the (a) absorption (μa) and (b) scattering (μs) coefficients derived from experimental setup for normal (dot line) and malignant (bold line) breast tissue |
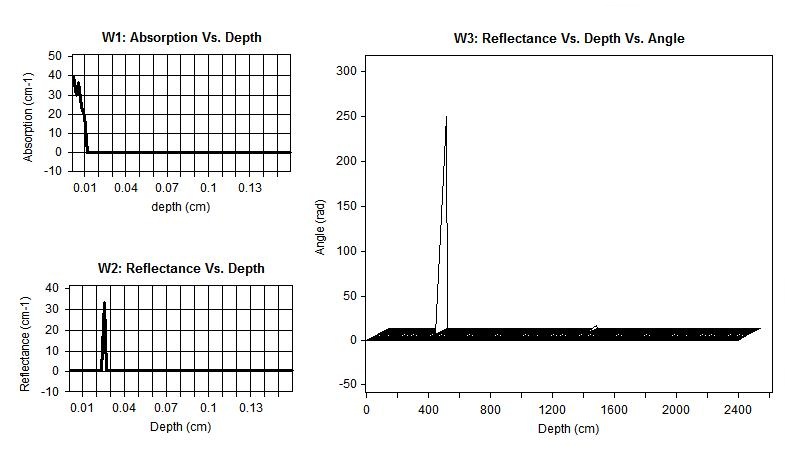 |
| Figure 5: Diffuse reflectance of normal breast tissue, (W1) absorption vs. depth, (W2) reflectance vs. depth and (W3) reflectance vs. depth vs. angle |
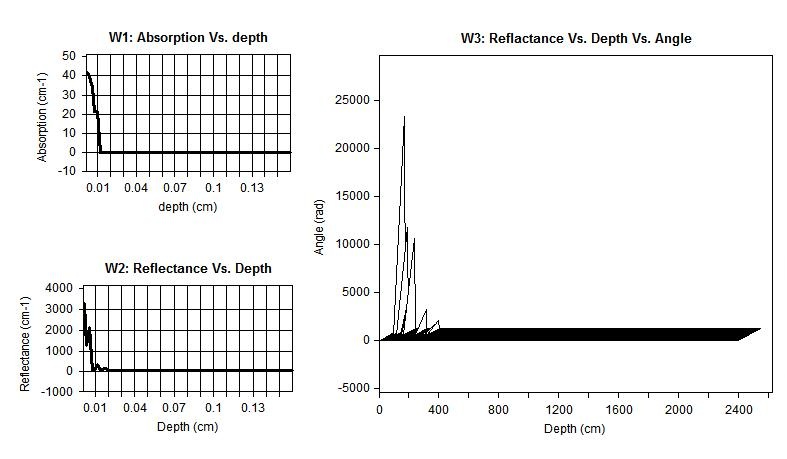 |
| Figure 6: Diffuse reflectance of malignant tissue, (W1) absorption vs. depth, (W2) reflectance vs. depth and (W3) reflectance vs. depth vs. angle |
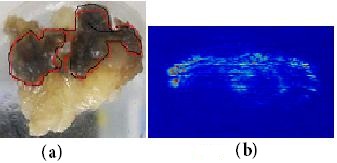  |
| Figure 7: Diffuse reflectance imaging, (a) illustrate a digital photograph taken from the breast samples of a 55-year-old patient affected by breast cancer, (b) Representative images of diffuse scattering classification, and (c) Tumor position and malignant tissue after image processing and edge detection using Hilbert transform |
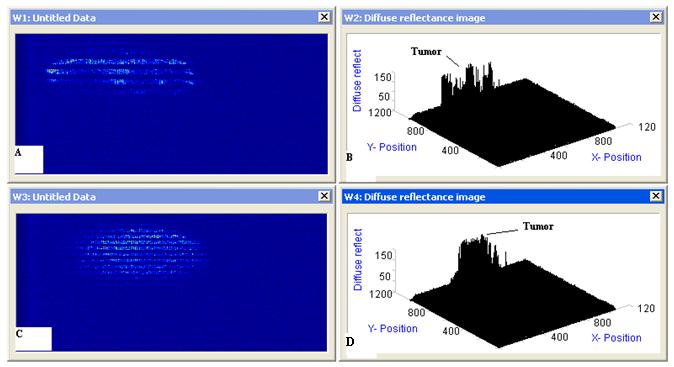 |
| Figure 8: Diffuse reflectance imaging (a), (c) Representative images of diffuse scattering classification, for two affected breast samples and (b), (d) 3D image plotting for the diffuse reflectance imaging of the samples |
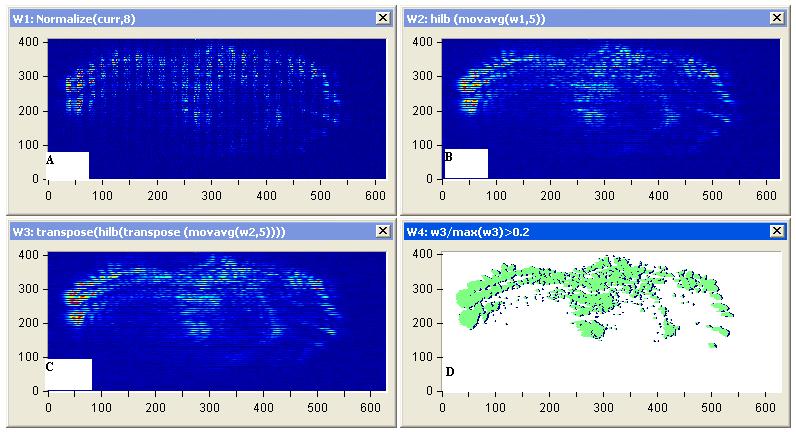 |
| Figure 9: Diffuse reflectance images (a) Representative images of diffuse scattering classification, for affected breast sample 1, (b) image processing of diffuse reflectance images, (C) 2D Edge Detection using Hilbert transform for the diffuse reflectance imaging with threshold 0.2 of the edge height and (d) breast tumor size and position |
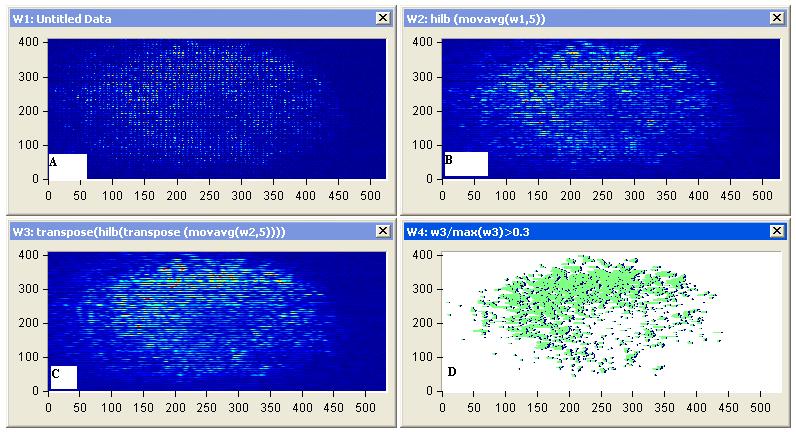 |
| Figure 10: Diffuse reflectance images (a) Representative images of diffuse scattering classification, for affected breast sample 2, (b) image processing of diffuse reflectance images, (C) 2D Edge Detection using Hilbert transform for the diffuse reflectance imaging with threshold 0.2 of the edge height and (d) breast tumor size and position |
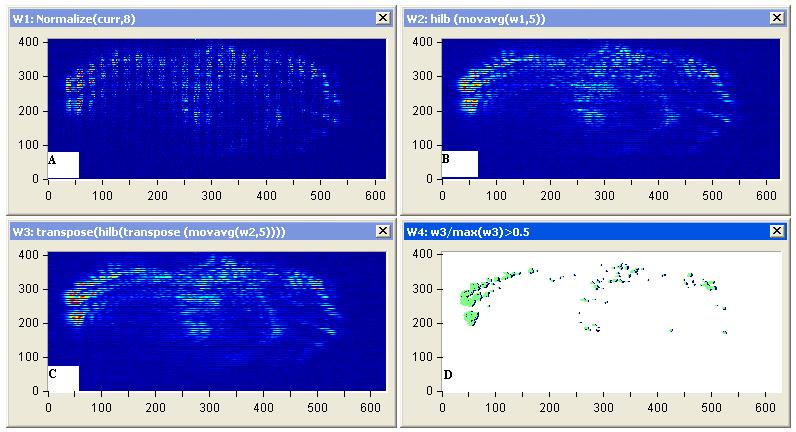 |
| Figure 11: Diffuse reflectance images (a) Representative images of diffuse scattering classification, for affected breast sample 1, (b) image processing of diffuse reflectance images, (C) 2D Edge Detection using Hilbert transform for the diffuse reflectance imaging with threshold 0.5 of the edge height and (d) highly affected breast tumor size and position |
 |
| Figure 12: Diffuse reflectance images (a) Representative images of diffuse scattering classification, for affected breast sample 2, (b) image processing of diffuse reflectance images, (C) 2D Edge Detection using Hilbert transform for the diffuse reflectance imaging with threshold 0.5 of the edge height and (d) highly affected breast tumor size and position |
Tissue |
Normal Breast Tissue |
Malignant Breast Tissue |
|---|---|---|
µa (cm-1) |
23±0.0911 |
10.2±0.19. |
µs (cm-1) |
78.2±0.02 |
290.3±0.02 |
Table 1: Average measured optical properties of normal and malignant breast tissue samples using optical spectroscopy at 633 nm |
||
Tissue |
Normal breast tissue |
Malignant breast tissue |
|---|---|---|
Specular reflectance |
0.0277778 |
0.0277778 |
Diffuse reflectance |
0.0661356 |
0.395818 |
Absorbed fraction |
0.906033 |
0.576384 |
Transmittance |
0 |
0 |
Absorption as a function of layer |
0.906 |
0.5764 |
| No. of photons: 10000.0 Bin size=1.5 cm Table 2: Different Values Obtained From Simulation |
||


