Open Access
Research Article
Max Screen >>
ISSN: 2575-551X
Copyright: © 2017 Lucio-Maldonado S. This is an open-access article distributed under the terms of the Creative Commons Attribution License, which permits unrestricted use, distribution, and reproduction in any medium, provided the original author and source are credited.
Related article at Pubmed, Google Scholar
Pamabrom is a common over-the-counter mild diuretic that is often used in combination with acetaminophen and other drugs for the treatment of menstrual pain. It consists of a 1:1 ratio mixture of 8-bromotheophylline and 2-amino-2-methyl-1-propanol.
A bioanalytical method for pamabrom, determined as 8-bromotheophylline, was developed and validated using reverse-phase HPLC coupled with UV detection.
This method was found to be reliable based on its validation and it was successfully applied to a pharmacokinetic study, in which a single dose of 25 mg of pamabrom was administered orally in combination with 300 mg of paracetamol and 220 mg of naproxen sodium to Mexican female subjects.
Keywords: Pamabrom; 8-bromotheophylline; Bioanalytical method; Pharmacokinetics
Pamabrom is a mild diuretic that consist of a 1:1 ratio mixture of 8-bromotheophylline and 2-amino-2-methyl-1-propanol (Figure 1), in which 8-bromotheophylline is the active diuretic ingredient [1]. There is a hypothesis that the 2-amino-2-methyl-1-propanol may also function as a diuretic, as some alcohols act indirectly as diuretics by suppressing the release of antidiuretic hormone from the posterior pituitary gland [2]. However, we did not find any study supporting this hypothesis.
Pamabrom, a common over-the-counter diuretic, is often used in combination with acetaminophen and other drugs for the treatment menstrual pain [2,3]. For example, in a recent clinical trial, the efficacy and safety of two oral medications (with different drug combinations): a test medication containing naproxen sodium (220 mg), paracetamol (300 mg) and pamabrom (25 mg); and a reference medication containing paracetamol (500 mg), pyrilamine (15 mg) and pamabrom (25 mg), were evaluated on primary dysmenorrhea in Mexican women. In this trial, it was concluded that both drug combinations were not different in reducing the dysmenorrheic pain [4].
Considering the combination of pamabrom, paracetamol and naproxen sodium, there is information regarding bionalytical methods for the simultaneous determination of naproxen sodium and paracetamol in human plasma [5]. However, we found two references on bionalytical methods for the determination of pamabrom (determined as 8-bromotheophylline) in combination with only paracetamol in human plasma [6,7].
Therefore, the aim of this research was to develop and validate a bioanalytical method for pamabrom, determined as 8-bromotheophylline, in human plasma for pharmacokinetic evaluation of the oral administration of 25 mg of pamabrom in combination with 220 mg of naproxen sodium and 300 mg of paracetamol in human Mexican female subjects.
Pamabrom (98% purity) was obtained from Toronto Research Chemicals (Ontario, Canada), and the caffeine, the internal standard (IS), was obtained from USP (Rockville, MD).
All solvents (including water) were HPLC grade (Avantor Performance Materials, Inc., Phillipsburg, NJ) and all reagents were analytical grade (Mallinckrodt Baker, Inc., Phillipsburg, NJ).
Pooled blank human plasma from healthy subjects was provided by Medica Sur Hospital (Mexico City, Mexico), and stored at -75°C ± 5°C until its use.
Pamabrom was determined as 8-bromotheophylline (henceforth referred to as the analyte). A stock solution of the analyte with a concentration of 500 μg/mL was prepared by dissolving the necessary amount of pamabrom equivalent to 2.5 mg of 8-bromotheophylline in 5 mL of water.
A stock solution of the IS with a concentration of 200 μg/mL was prepared by dissolving 2 mg of caffeine in 10 mL of water. The stock solutions were stored at 5°C ± 3°C until use.
The study samples (250 μL) were spiked with 10 μL of the IS solution (100 μg/mL).
The calibration curve consisted of 7 points with concentration levels of 20, 40, 100, 200, 400, 500 and 800 ng/mL. Calibration samples were prepared for each point of the calibration curve using the following components: 200 μL of human plasma (blank), 40 μL of water, 10 μL of the corresponding stock solution of the analyte and 10 μL of the IS solution (100 μg/mL).
The QCs (low, medium, high) and diluted samples were prepared as described for the calibration samples, at concentrations of 60 ng/mL (LQC), 300 ng/mL (MQC), and 600 ng/mL (HQC), respectively.
All samples were treated with 1000 μL of a mixture of ethyl acetate and cyclohexane (90:10 v/v) and 100 μL of an aqueous solution of phosphoric acid (3.8%). The resulting mixtures were vortexed for 1 minute and then centrifuged for 5 minutes at 8000 rpm (20°C). The organic phase was transferred to a test tube where it was evaporated to dryness under a stream of nitrogen at 50°C. The extracts were reconstituted in 100 μL of methanol:water mixture (75:25 v/v). The reconstituted solutions were then vortexed for 15 seconds. Finally, 20 μL of the reconstituted solution were injected into the chromatographic system.
Although it is common practice to dissolve the dried extract in the mobile phase, the methanol and water mixture was selected because the extract has better solubility in this mixture than in the mobile phase. There were no compatibility problems with the mobile phase.
An Agilent 1200 and an Agilent 1260 were used for high-performance liquid chromatography (HPLC), both from Agilent Technologies (Palo Alto; California). Both equipments consisted of a binary pump, a high-performance degasser, a high performance autosampler, a thermostatted column compartment, and a multiple wavelength detector.
Pamabrom concentrations were determined with a column (150 x 4.6-mm, 5-μm particle size, Zorbax® SB–C8, Agilent Technologies, Palo Alto, California) equipped with a pre-column (12.5 x 4.6-mm, 5-μm particle size, Zorbax® SB–C8 (Agilent Technologies, Palo Alto, California) and eluted with a mobile phase consisting of: component A (aqueous ammonium acetate (10 mM, pH 5.0 ± 0.1)) and component B (acetonitrile:water mixture (95:5 v/v)) with an A:B ratio of 83:17 v/v.
The column temperature was 15°C, the flow rate was kept at 1 mL/minute, the run time was 6.5 minutes, the injection volume was 20 μL and the analyte detection was carried out at a wavelength of 278 nm.
Method validation: The method was validated according to Mexican and international guidelines regarding bioanalytical method validation [8-10].
The validation included selectivity, carry-over, calibration curve, lower limit of quantification; accuracy, precision; dilution integrity, and stability.
Data analysis: The calibration curves were analyzed by linear regression of the peak area ratios (analyte/IS) as a function of the analyte concentrations.
The pharmacokinetic (PK) parameters were:
Cmax: maximum plasma drug concentration,
Tmax: time to reach Cmax,
ke: apparent terminal elimination rate constant,
t1/2: apparent terminal elimination half-life,
AUC0-t: Area under the plasma concentration-time curve from zero
(0) hours to the last measurable concentration (t).
AUC0-∞: Area under the plasma concentration-time curve from zero
(0) hours to infinity (∞).
These were estimated using the non-compartmental approach with WinNonlin Phoenix software version 6.4.
Figure 2 shows several representative chromatograms obtained during the validation of the bioanalytical method.
The retention times (mean±SD) for the analyte and the IS were 4.30±0.81 and 5.33±1.02 minutes, respectively.
The selectivity was evaluated by analyzing blank human plasma samples from six different subjects, blank human (hemolyzed and lipemic) plasma samples, anticoagulants (lithium and sodium heparin), xanthines (theobromine), and other drug substances commonly used as analgesics (acetylsalicylic acid, ibuprofen, diclofenac, paracetamol and naproxen). No interferences were observed in the resulting chromatograms.
The calibration curve consisted of 7 points with concentration levels of 20, 40, 100, 200, 400, 500 and 800 ng/mL. Thus the range of the curve was 20 ng/mL to 800 ng/mL. The lower limit of quantification (LLOQ) was 20 ng/mL and the upper limit of quantification (ULOQ) was 800 ng/mL. The LLOQ was determined as the lowest concentration of the analyte in a sample which can be quantified reliably, with an acceptable accuracy and precision, which is discussed below.
The carry-over of the method was evaluated by injecting blank samples after the injection of the ULOQ sample, and no signals were detected at the expected retention times for either the analyte or the IS in the resulting chromatograms.
The linearity of the method was evaluated by analyzing the data obtained from 4 calibration curves. The corresponding slopes, intercepts, as well as the correlation and determination coefficients are shown in Table 1.
All of the correlation coefficients and the determination coefficients were greater than 0.99, which supports the linearity of the method.
The intra-day accuracy and precision of the method was evaluated by analyzing 5 replicates of LLOQ and QCs (low, medium, high).
In order to evaluate dilution integrity, two additional samples were analyzed using 5 replicates, at an initial concentration of 1000 ng/mL (higher than the ULOQ), which were further diluted (1:2 and 1:5 dilution ratios).
In a similar manner, the inter-day accuracy and precision of the method were evaluated using 3 analytical runs by analyzing 5 replicates of LLOQ and QCs (low, medium, high).
Accuracy was expressed as the % relative error (%RE) between the quantified and the nominal value; and the precision was expressed as % coefficient of variation (%CV).
The results for the accuracy and precision of the method are summarized in Table 2 and those for the evaluation of dilution integrity are shown in Table 3.
The mean %RE results for both intra- and inter-day accuracy for all tested concentration levels were within the acceptance range of ±20% of the nominal value for the LLOQ and within ±15% of the nominal values for the higher concentration levels. In addition, the %CV results for both intra- and inter-day precision for all tested concentration levels were less than 20% for the LLOQ, and less than 15% for the higher concentration levels [8-10].
For the dilution integrity evaluation, the results of this evaluation indicated that the above mentioned criteria for both accuracy and precision were also met.
The use of the HPLC equipment (Agilent 1200 and 1260) was also evaluated, and the results indicated that the accuracy and precision criteria were met in this case as well (data not provided).
The stability of the analyte was evaluated under the following conditions: freeze and thaw (3 cycles); processed sample at room temperature; evaporated sample (dry extract); in autosampler, long term stability (at -75°C ± 5°C) and stock solutions (analyte and IS). Triplicate QCs (low and high) were used for this evaluation. The results are summarized in Table 4.
The results indicated that the stability acceptance criteria were met (all mean %RE values for all tested concentration levels were within ±15% of the nominal values) [8-10].
This indicates that the analyte was stable in plasma for 16 weeks at -75°C ± 5°C and during 3 freeze and thaw cycles. In a sample processed at room temperature for 27 hours; in an evaporated sample for 24 hours at room temperature and in an autosampler for 74 hours at room temperature, and in a stock solution for 3 weeks at 5°C ± 3°C.
The method was applied to a pharmacokinetic study, in which a single dose of 25 mg of pamabrom was orally administered in combination with 300 mg of paracetamol and 220 mg of naproxen sodium to Mexican female subjects.
As described above, the pharmacokinetics of pamabrom was studied by determining 8-bromotheophylline, the active diuretic ingredient.
Plasma samples were obtained from 12 subjects (aged 19 to 36 years); who participated in a pharmacokinetic study conducted at a clinical unit (IPHARMA, S.A. de C.V. Monterrey, Nuevo León, Mexico).
The study protocol (B19-15) and the informed-consent form were reviewed and approved by an ethics and research committee and authorized by the Federal Commission for Protection against Sanitary Risks (COFEPRIS).
The study was conducted in accordance with the ethical principles of the Declaration of Helsinki and its amendments, as well as the International Conference on Harmonisation for Good Clinical Practice Guideline.
During this study, the subjects fasted for 10 hours overnight before the oral administration of a coated tablet (ANALGEN FEM®, Laboratorios Liomont, S.A. de C.V.) containing pamabrom (25 mg), naproxen sodium (220 mg) and paracetamol (300 mg).
Blood samples (6 mL) were drawn from a suitable forearm vein (using an indwelling catheter) at baseline, and at 0.167, 0.333, 0.5, 0.667, 0.833, 1, 1.25, 1.5, 1.75, 2, 2.5, 3, 4, 5, 6, 8, 10, 12, 24, 48 and 72 hours after administration. Lithium heparin was used as an anticoagulant.
Blood samples were centrifuged at 3000 rpm for 10 minutes at 5°C. The plasma was separated and stored at –65°C ± 15°C until the samples were transported to Biokinetics (the analytical unit) where they were stored at -75°C ± 5°C until the time of analysis.
The mean plasma concentration-time curve of 8-bromothophylline is shown in Figure 3 and its corresponding semi-logarithmic plot in Figure 4. The main pharmacokinetic parameters are summarized in Table 5.
The present method allowed us to characterize the pharmacokinetic profile of pamabrom in combination with naproxen sodium and paracetamol. The sensitivity of the method was satisfactory because its LLOQ of 20 ng/mL was 0.54% of the Cmax (3685.60 ng/mL) of 8-bromotheophylline, which should not be greater than 5% of the Cmax to be acceptable [8-10].
The pharmacokinetic profile suggested that the plasma concentrations of 8-bromotheophylline decreased in a biexponential or multiexponential manner. In this case, the estimated ke and its derived pharmacokinetic parameters (t1/2 and AUC0-∞) should be interpreted with caution because the non-compartmental approach is not suitable for determining these parameters under these circumstances. Therefore, further research is needed to clarify this issue.
With this method, it was possible to analyze a total of 158 samples in a single analytical run, including samples from 6 subjects, the system suitability, QCs, and calibration curve samples. The method could be considered convenient for routine application in pharmacokinetic and bioequivalence studies.
A new sensitive bioanalytical method was developed and validated for the determination of pamabrom, quantified as 8-bromotheophylline using HPLC coupled with UV detection.
This method was successfully applied to a pharmacokinetic study, in which a single dose of 25 mg of pamabrom was administered orally in combination with 300 mg of paracetamol and 220 mg of naproxen sodium to Mexican female subjects.
This research and its publication were supported by Laboratorios Liomont, S.A. de C.V., Mexico City, Mexico. The authors have indicated that they have no conflicts of interest regarding the content of the article.

![]()

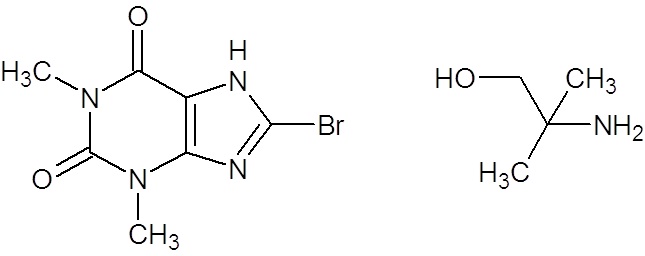 |
Figure 1: Chemical structures of the components of pamabrom: 8-bromotheophylline and 2-amino-2-methyl-1-propanol |
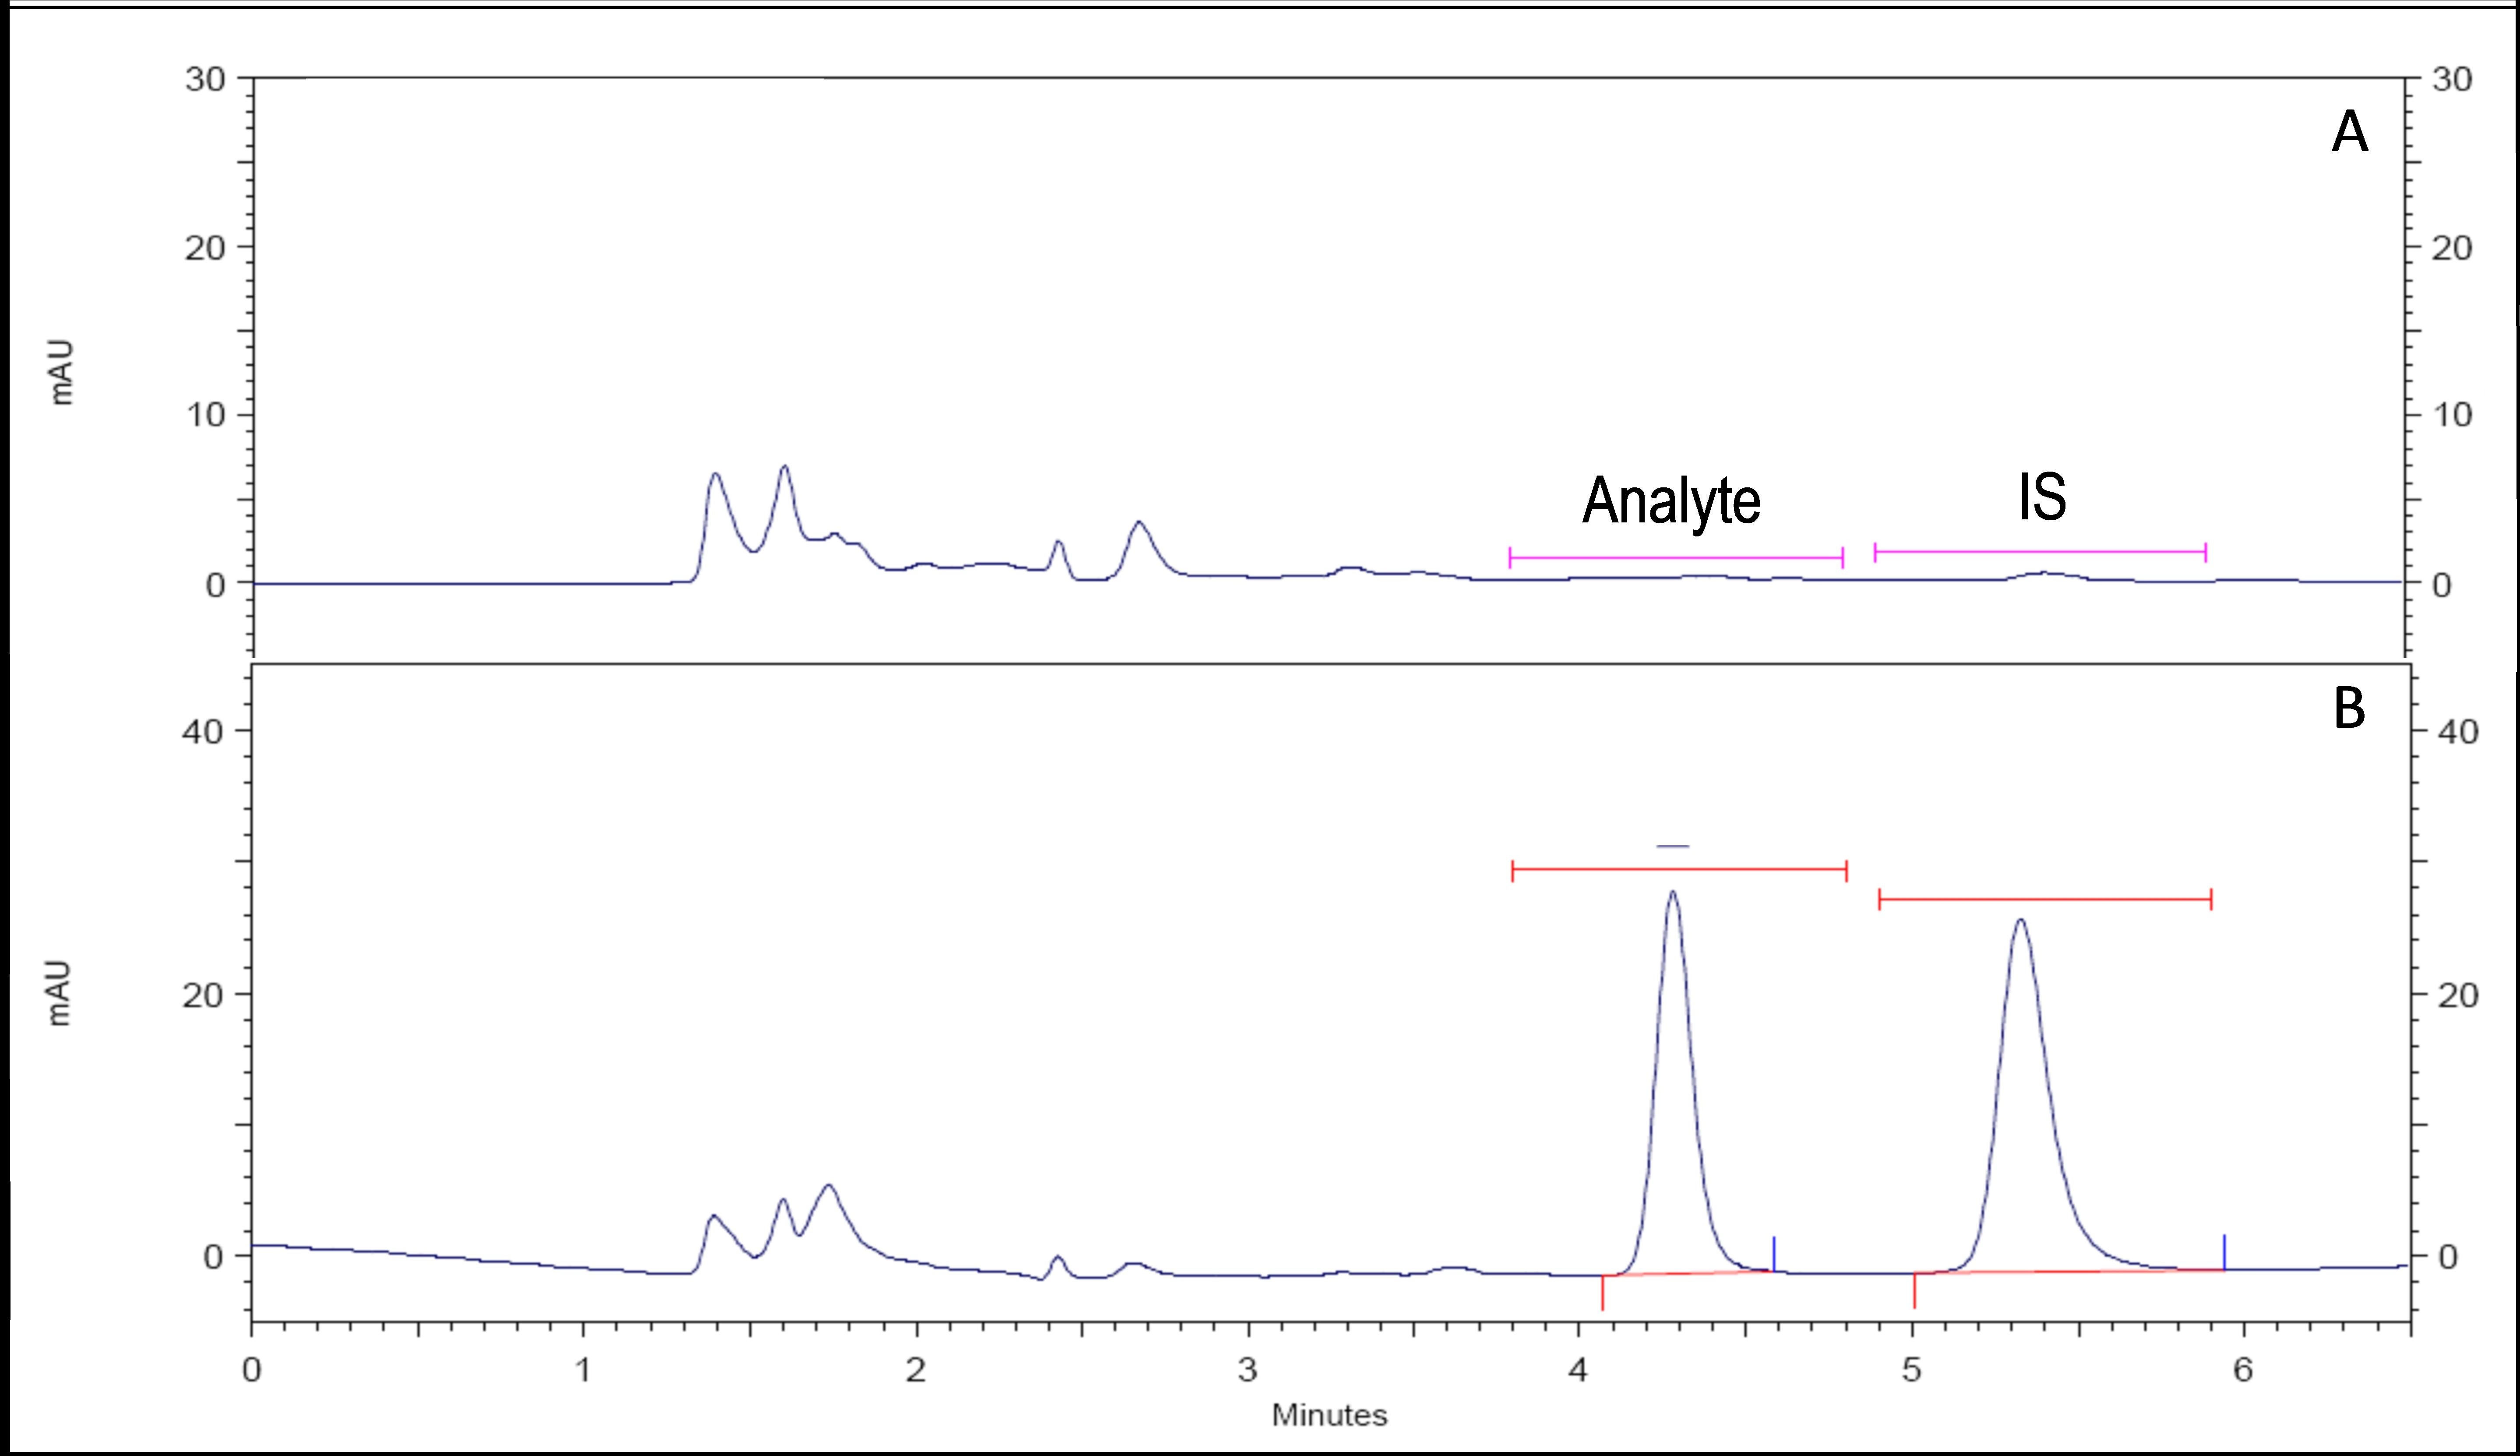 |
Figure 2: Representative chromatograms. .A: blank human plasma sample. B: human plasma sample spiked with the analyte (500 ng/mL) and the internal standard (1000 ng/mL) |
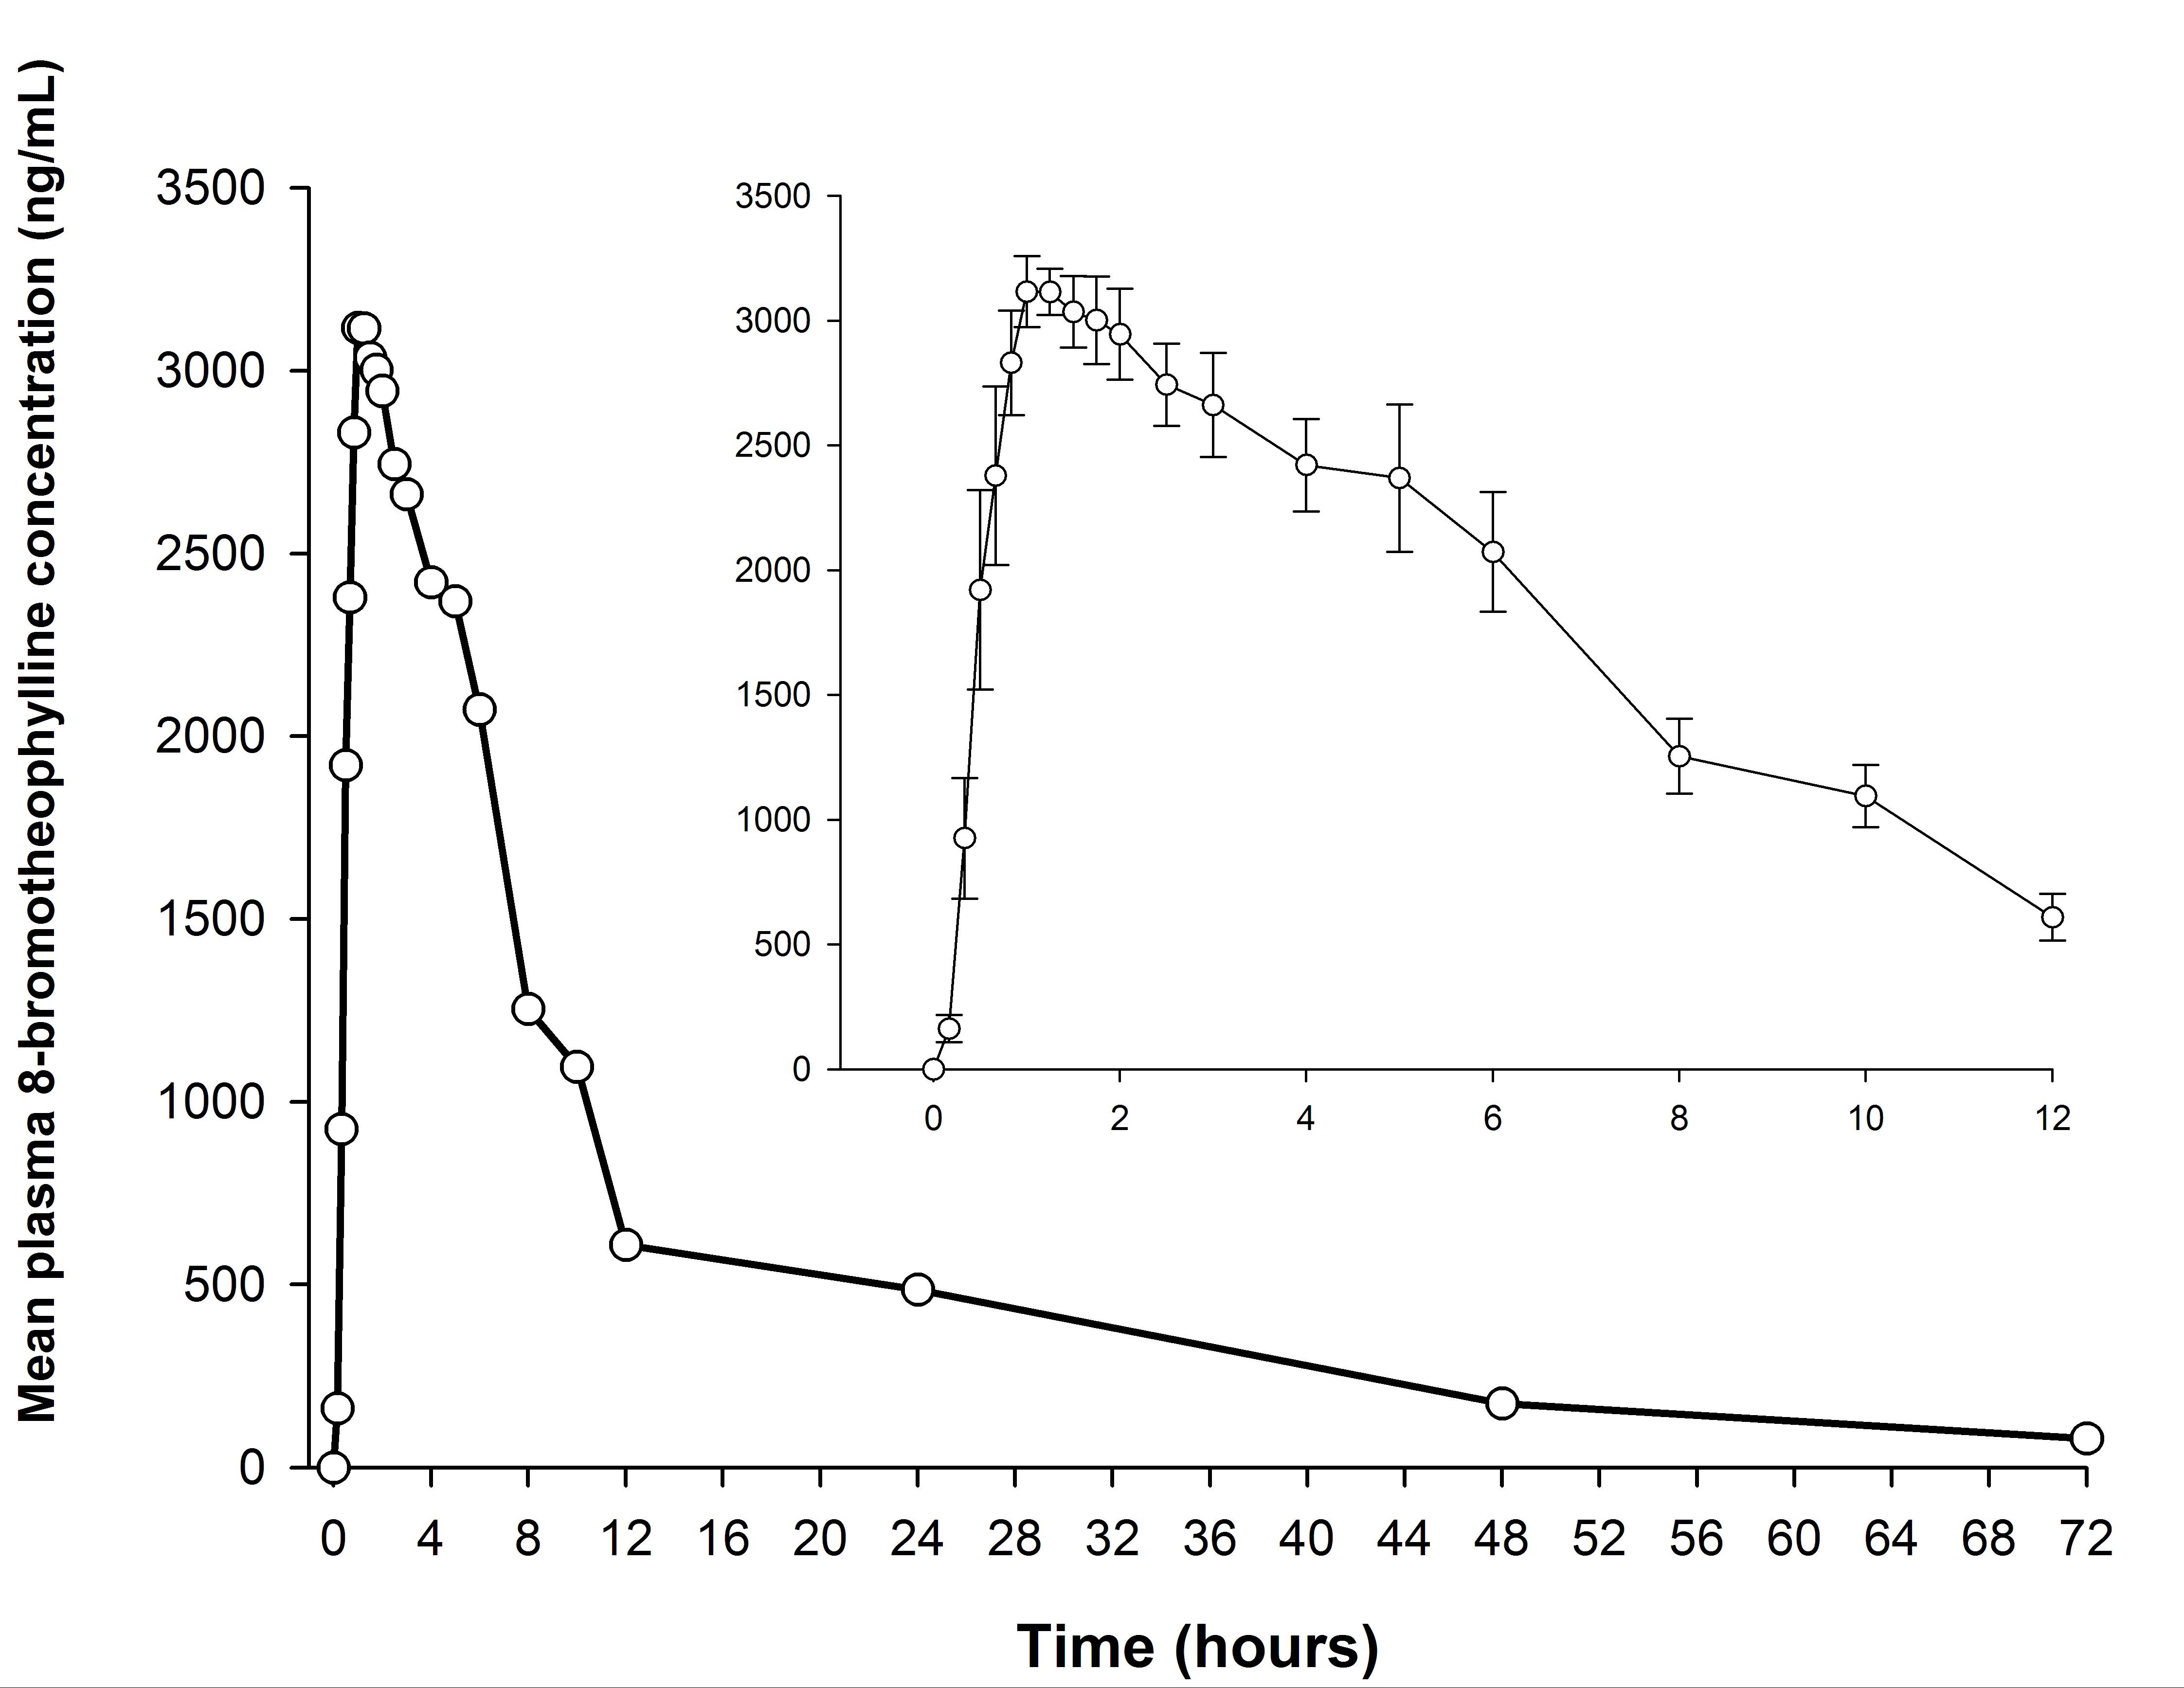 |
Figure 3: Mean plasma concentration-time curve after a single-dose administration of an oral coated tablet, containing, 25 mg of pamabrom in combination with 220 mg of naproxen sodium and 300 mg of paracetamol (trademark: ANALGEN FEM®, Laboratorios Liomont, S.A. de C.V.) in healthy Mexican female subjects (n = 12). Pamabrom was determined as 8-bromotheophylline. Inset: mean (±SE) concentrations over the first 12 hours after administration |
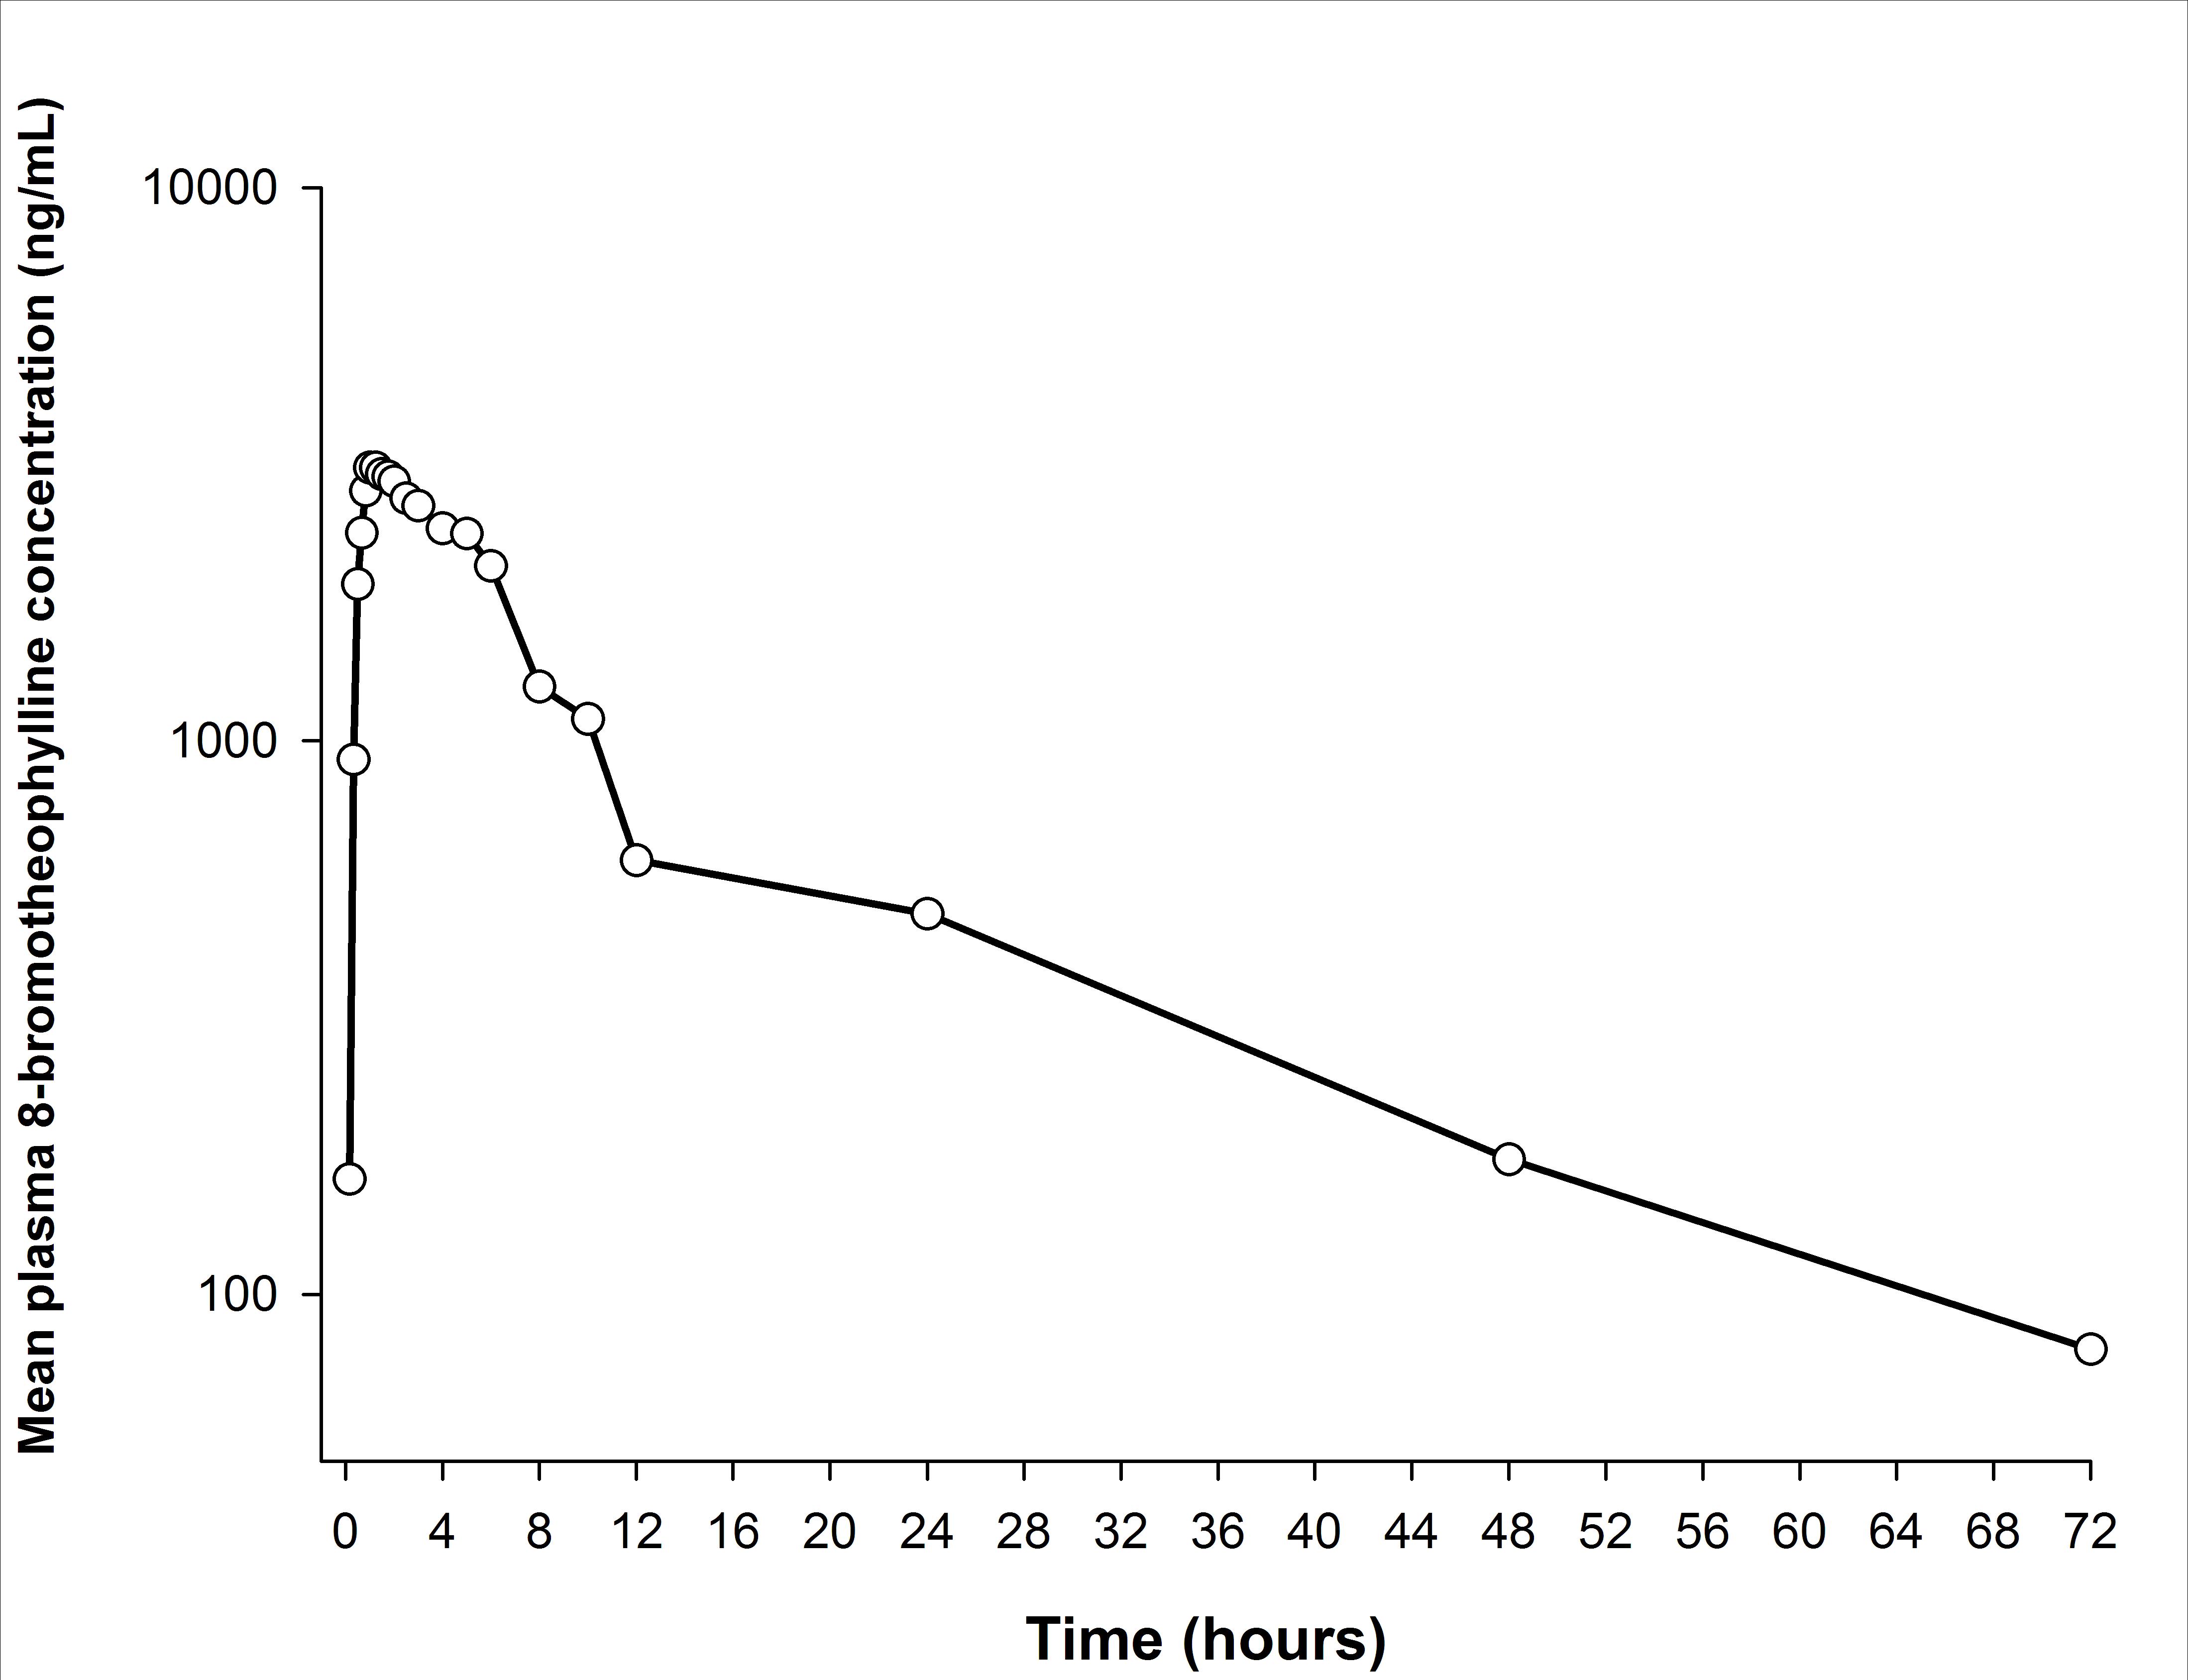 |
Figure 4: Semi-logarithmic plot of 8-bromotheophylline plasma concentration-time profile after a single-dose administration of an oral coated tablet, containing, 25 mg of pamabrom in combination with 220 mg of naproxen sodium and 300 mg of paracetamol (trademark: ANALGEN FEM®, Laboratorios Liomont, S.A. de C.V.) in healthy Mexican female subjects (n = 12) |
Calibration curve |
Slope (m) |
Intercept (b) |
Determination coefficient (r2) |
Correlation coefficient (r) |
1 |
0.00153 |
-0.00711 |
0.99951 |
0.99976 |
2 |
0.00155 |
-0.00021 |
0.99954 |
0.99977 |
3 |
0.00157 |
-0.00887 |
0.99990 |
0.99995 |
4 |
0.00155 |
-0.00456 |
0.99839 |
0.99919 |
| Table 1: Linearity of the method | ||||
Intra-day |
Inter-day |
||||||
|---|---|---|---|---|---|---|---|
Sample |
Nominal concentration (ng/mL) |
Concentration found (ng/mL) ± SD |
Precision CV (%) |
Accuracy RE(%) |
Concentration found (ng/mL) ± SD |
Precision CV (%) |
Accuracy RE (%) |
LLOQ |
20 |
20.13 ± 0.43 |
2.16 |
0.67 |
20.03 ± 2.12 |
10.60 |
0.15 |
LQC |
60 |
60.18 ± 0.96 |
1.60 |
0.31 |
60.95 ± 1.36 |
2.23 |
1.59 |
MQC |
300 |
275.07 ± 10.53 |
3.83 |
-8.31 |
294.85 ± 15.98 |
5.42 |
-1.72 |
HQC |
600 |
613.97 ± 16.95 |
2.76 |
2.33 |
611.88 ± 10.30 |
1.68 |
1.98 |
CV: coefficient of variation; RE: relative error; LLOQ: lower limit of quantification; LQC: low quality control sample, MQC: medium quality control sample, and HQC: high quality control sample |
|||||||
Dilution integrity |
||||
|---|---|---|---|---|
Sample |
Nominal concentration (ng/mL) |
Concentration found (ng/mL) ± SD |
Precision CV (%) |
Accuracy RE (%) |
DS 1:2 |
1000 |
974.59 ± 66.66 |
6.84 |
-2.54 |
DS 1:5 |
1000 |
965.95 ± 24.08 |
2.49 |
-3.41 |
CV: coefficient of variation; RE: relative error, DS diluted sample |
||||
Stability |
LQC 60 (ng/mL) |
HQC 600 (ng/mL) |
||||
|---|---|---|---|---|---|---|
Concentration found (ng/mL) ± SD |
Precision CV (%) |
Accuracy RE (%) |
Concentration found (ng/mL) ± SD |
Precision CV (%) |
Accuracy RE (%) |
|
Freeze and thaw ( 3 ycles) |
53.65 ± 1.51 |
2.82 |
-10.58 |
559.03 ± 5.64 |
1.01 |
-6.83 |
Processed sample at room temperature (27h) |
60.85 ± 1.43 |
2.34 |
1.42 |
586.95 ± 15.38 |
2.62 |
-2.17 |
Evaporated sample: dry extract (24 h at room temperature) |
56.54 ± 1.17 |
2.08 |
-5.77 |
523.86 ± 13.31 |
2.54 |
-12.69 |
Long term (16 weeks at-75°C± 5°) |
66.33 ± 1.05 |
1.58 |
10.56 |
618.60 ± 3.65 |
0.59 |
3.10 |
In autosampler (74 h at room temperature) |
62.21 ± 0.88 |
1.41 |
3.69 |
575.58 ± 9.48 |
1.65 |
-4.07 |
Stability |
LQC 60 (ng/mL) |
HQC 600 (ng/mL) |
||||
Precision CV (%) |
Accuracy RE (%) |
Precision CV (%) |
Accuracy RE (%) |
|||
Stock solution: Analyte standard (3 weeks at 5°C ± 3°C) |
0.12 |
6.76 |
0.29 |
2.42 |
||
Stock solution: Internal standard (3 weeks at 5°C ± 3°C) |
0.06 |
0.43 |
0.91 |
1.34 |
||
CV: coefficient of variation, RE: relative error |
||||||
Parameter |
Mean ± SD |
|---|---|
Cmax (ng/mL) |
3685.60 ± 621.35 |
Tmax (h) |
1.41 ± 1.24 |
Apparent ke (h-1) |
0.05 ± 0.04 |
Apparent t1/2 (h) |
21.35 ± 12.81 |
AUC0-t (ng•h /mL) |
36693.31 ± 14083.74 |
AUC0-∞ (ng•h /mL) |
46210.49 ± 24196.28 |
Table 5: Pharmacokinetic parameters |
|


