Open Access
Research Article
Max Screen >>
ISSN: 2575-551X
Copyright: © 2016 Geervani P. This is an open-access article distributed under the terms of the Creative Commons Attribution License, which permits unrestricted use, distribution, and reproduction in any medium, provided the original author and source are credited.
Related article at Pubmed, Google Scholar
Iron is an important component of hemoglobin, in addition to other positive roles like proper growth and development of humans and for growing of fetus in pregnancy women. Iron deficiency anemia is more prevalent among vegetarian than non vegetarians. The purpose of this study was to develop and validate an bioanalytical technique for the estimation of iron levels in food samples (chicken liver, spinach, sprouts), in rabbit plasma by derivatised RP-HPLC by using 1-(2-pyridyl azo)-2-naphthol (PAN) as reagent. The separation was carried out using gradient elution with TAHS & acetonitrile with detection wave length at 280 nm. Grouping was done, each group contain 3 rabbits (same strain, weight, age). After overnight fasting, rabbits were fed with 100g of cooked spinach, sprouts and chicken liver with 240 mL of water. Blood samples were collected randomly at different time intervals upto 30 hrs. The plasma was separated and analyzed on basis of chromatographic conditions. The results showed the distribution of iron contents in various plasma samples. A high iron bioavailability was obtained from chicken liver sample when compared to spinach and sprouts. The method has been successfully applied to determine the trace levels of iron in biological samples with high precision & accuracy with sensitivity in less elution time of 3.2 ± 0.02 mins.
Keywords: PAN reagent; RP-HPLC; Iron
Iron in general has poor availability from food derived from plant sources compared to food from animal sources. However, the Food and Nutrition Board of the National Research Council (National Research Council, 1989) has also stated that iron deficiency (anemia) appears to be highly prevalent among vegetarian women than among non-vegetarian women [1-3]. This was because in many studies of vegetarians in Western societies have found poorer iron status in vegetarian than in omnivores on the basis of measurements of hemoglobin, serum iron, iron binding capacity, or transferring saturation [4-8]. In this context further study of iron bioavailability in vegetarian diets is needed, because, several studies also suggested that vegetarians, compared to omnivores, have a greater risk of low iron status as indicated by lower concentration of serum ferritin [9-12]. This is because iron from plant derived foods is non-haem in nature which is markedly influenced by a greater number of dietary factors. It was also reported that lacto ovo vegetarian diet had 70% lower non-haem iron absorption than from non-vegetarian diet [13-17]. Majority of the Indian population with lower socio-economic status have to depend on foods from plant origin to satisfy their iron requirement, because of their poor purchasing capacity [18-22]. Their diet mostly constituted of cereals, millets, pulses and vegetables [23-25].
The most reliable method for determining bioavailability is measurement of absorption in human volunteer using radioisotopic technique, adoption of such technique involves ethical clearance. It is also expensive and needs elaborate experimental arrangements [26,27]. Considering the above aspects, the present study was designed to analyze various samples of spinach, sprouts and chicken liver for in-vivo availability of iron in rabbit blood by RP-HPLC.
Instrumentation: Method development and validation was performed on Stainless steel Inertsil C18 (250 x 4.6 mm, 3.5 μ) column. The HPLC system includes HPLC pump (Agilent 1200 Infinity series) and UV detector (Agilent 1200 Infinity series). The software used was Ezichrome Elite Compact.
Chemicals and reagents: Ferrous sulphate, PAN (1-(2pyridyl azo)-2-naphthol), Tetrabutyl Ammonium Hydrogen Sulphate (TAHS), Sulphuric acid (H2SO4) (1:1, % v/v), 30 % v/v Nitric acid, HPLC grade Methanol, Acetonitrile and water.
Chromatographic separation was achieved with 10 mM Tetra butyl hydrogen ammonium sulphate : Acetonitrile (20:80, % v/v), gave the best peak shape and low base line noise was observed using the Inertsil C18 column (250 x 4.6 mm, 3.5 μ) with run time of 7 min at a flow rate of 1.0 mL / min with detection wavelength at 280 nm. Temperature of the column oven set to ambient temperature. Sample volume for injection into HPLC was adjusted to 20 μL for better chromatography. The retention time of iron eluted was 3.2 ± 0.02 min with total run time of 7 min for each sample.
Food samples selected for this study are spinach, sprouts and Chicken liver were collected. Samples were cleaned, washed with tap water followed by deionized distilled water, dried in an oven at 50-60°C. Using a mill, samples were converted in to pieces.
For extraction of Iron from plasma samples Liquid-Liquid Extraction (LLE) was employed. For this, 3 mL of 30 % v/v nitric acid was used as an extraction solvent which was added into pre labelled polypropylene (PP) tubes containing 100 μL of plasma sample (respective concentration) and vortexed for 15 min. The samples were centrifuged at 4000 rpm for 10 min at ambient temperature. The supernatant phase was transferred to a clean PP tube and dried at 120°C for 30 minutes. The residue was reconstituted with 0.2 mL of 0.2 % w/v PAN reagent and 500 μL mobile phase and vortexed. The mixture was heated at 50°C for 5 min and cooled to room temperature. Finally, 20 μL sample was injected into HPLC system.
Analytical method was validated adhere to the U.S. FDA guidance for industry: Bioanalytical method validation (10).
Selectivity was performed by analyzing the six different charcoal treated rabbit blank plasma samples to test for interference at the retention time of analyte.
The stock solution of Ferrous sulphate was prepared in diluted H2SO4 (1:1, % v/v) at the concentration of 1000 μg/mL. The stock was used to prepare calibration and quality control samples. Charcoal treated blank rabbit plasma was screened prior to spiking to ensure it was free from endogenous interference at retention time of analyte. Calibration Standards (0.50, 1.00, 5.00, 10.00, 20.00, 40.00, 60.00, 80.00, 100.00, 200.00, 400.00, 600.00 and 800.00 μg/mL), quality control samples of Lower Limit of Quantification (LLOQ), Low Quality Control(LQC), Medium Quality Control (MQC), High quality control (HQC) (0.50, 1.50, 400.00, 700.00 μg/mL) were prepared by spiking the appropriate amount of standard solution in charcoal treated rabbit plasma and stored in deep freezer till analysis.
Matrix effect for total Iron was evaluated by comparing peak area ratio in post-extracted plasma sample from six different drug-free blank plasma samples and aqueous reconstitution samples. Experiments were performed at LQC and HQC levels in triplicate with six different plasma lots.
It was determined by replicate analysis of quality control samples (n = 6) at LLOQ, LQC, MQC and HQC levels.
The extraction efficiencies were determined by analysis of six replicates at each quality control concentration level. The percent recovery was evaluated by comparing the peak areas of extracted standards to the peak areas of no extracted standards.
Stock solution stability was performed by comparing the area response of analyte in the stability sample, with the area response of sample prepared from fresh stock solution. Stability studies in plasma were performed at the LQC and HQC concentration levels using six replicates at each level. Analyte was considered stable if the change is less than 15% as per US-FDA guidelines. The stability of spiked rabbit plasma samples stored at room temperature (bench top stability) was evaluated for 24 hrs. The stability of spiked rabbit plasma samples stored at 2-8°C was evaluated for 65 hrs. The sample stability was evaluated by comparing the extracted plasma samples that were injected immediately (time 0 hrs), with the samples that were re-injected after storing in the autosampler at 2-8°C for 25 hrs. The freeze-thaw stability was conducted by comparing the stability samples that had been frozen at -30°C and thawed three times, with freshly spiked quality control samples. Six aliquots each of LQC and HQC concentration levels were used for the freeze–thaw stability evaluation. For long term stability evaluation the concentrations obtained after 45 days were compared with initial concentrations.
The validated method has been successfully applied to estimate iron levels in rabbit plasma (Newzealand white rabbits). The study was conducted according to GCP guidelines. Before conducting this study it was approved by institutional ethics committee (IEC, Approval No:1O/IAEC/CIPS/2012-13). After overnight fasting (10 hours), rabbits were fed with 100g of spinach to group-1, sprouts to group-2 and chicken liver to group-3 with 240 mL of water. The blood samples were collected in separate vaccutainers containing K2EDTA as anticoagulant. Blood sampling (1mL) was carried out at pre-dose (0), 1.000, 2.000, 3.000, 4.000, 5.000, 6.000, 7.000, 8.000, 9.000, 10.000, 20.000, 24.000 and 30.000 hrs. The collected blood samples were centrifuged at 4000 rpm within the range of temperature 2-8°C and plasma was separated. The plasma samples thus obtained were stored in -20°C till analysis. Post analysis the pharmacokinetic parameters were computed using WinNonlin® software version 5.2.
The selectivity of the method no endogenous plasma peaks were observed at the retention time of the analyte Representative chromatograms obtained from blank plasma and plasma spiked with a lower limit of quantification (LOQ) sample are shown in Figure 1 and Figure 2. All calibration curves analyzed during the course of validation were linear for the standards ranging from 0.5 to 800 μg/mL. A straight-line fit was made through the data points by linear regression analysis. The % accuracy results for intra-batch and inter-batch were within 98.53–100.44% respectively, at all spiking levels. The detailed results were presented in Table 1 & 2. The control plasma samples (bench top) at room temperature were stable at 24.5 hrs at 25°C. During freeze-and-thaw cycles in spiked plasma samples stored at –30°C determined up to 48 hrs. Spiked plasma samples stored at –30°C for long-term stability experiment were stable for a minimum of 90 days. Different stability experiments in plasma and the values for the precision and percent change are shown in Table 3. The proposed validated method was successfully applied for the assay of iron in healthy rabbits. Figure 3 shows the mean plasma concentration-time profile under fasting conditions up to 30 hrs. The mean pharmacokinetic parameters obtained for the test samples were presented in Table 4.
During method development, different options were evaluated to optimize chromatography and sample extraction. Initially, a mobile phase consisting of ammonium formate and acetonitrile in varying combinations was tried, but a low response was observed. The mobile phase containing acetic acid: acetonitrile (30:70, % v/v) and aceticacid: Methanol (25:75, % v/v) gave the better response, but poor peak shape was observed. A mobile phase of 10 mM tetra butyl hydrogen ammonium sulphate in combination with acetonitrile and methanol with varying combinations was tried. Using a mobile phase containing 10 mM tetra butyl hydrogen ammonium sulphate: Acetonitrile (20:80, % v/v), the best signal along with a marked improvement in the peak shape was observed with Inertsil C18 column (250 x 4.6 mm, 3.5 μ). Flow rate of 1.0 mL/min was used with total run time of 7 min. The column oven temperature was kept at a constant temperature of about 30°C. Injection volume of 20 μL sample is adjusted for chromatography. Prior to load the sample for LC injection, the co-extracted proteins should be removed from the prepared solution. For this purpose, different extraction procedures like Protein precipitation (PPT), Liquid-liquid extraction (LLE) and Solid phase extraction (SPE) were tested. It was observed that less matrix effect and high recovery in Liquid-liquid extraction method. These optimized detection parameters, chromatographic conditions and extraction procedure resulted in reduced analysis time with accurate and precise detection of total iron in rabbit plasma.
A thorough and complete method validation of total iron in rabbit plasma was done as per US-FDA guidelines [28]. The method was validated for selectivity, sensitivity, matrix effect, linearity, precision and accuracy, recovery, re-injection reproducibility and stability.
The mean % interference observed at the retention time of analytes between six different lots of rabbit plasma, containing K2EDTA as an anti-coagulant calculated. Six replicates of extracted samples at the LLOQ level in one of the plasma sample having least interference at the retention time of analyte were prepared and analyzed. The % CV of the areas of these six replicates of samples was 1.4% confirming that interference does not affect the quantification at LLOQ level. The LLOQ was found to be 0.5 μg/mL. All the values obtained below 0.5 μg/mL were excluded from statistical analysis. The % CV of ion suppression/enhancement in the signal was found to be 1.26% at LQC level and 2.04 % at HQC level, indicating that the matrix effect on the ionization of analyte is within the acceptable range under these conditions. A set of standards were prepared to obtain linearity range of 0.50, 1.00, 5.00, 10.00, 20.00, 40.00, 60.00, 80.00, 100.00, 200.00, 400.00, 600.00 and 800.00 μg/mL and assayed in five replicates on five different days. A very good linearity was generated with excellent regression (0.999). One set of calibration standards and one set contains four different concentrations of quality control standards of LLOQ (0.50 μg/mL), LQC (1.50 μg/mL), MQC (400.00 μg/mL) and HQC (700.00 μg/mL) concentrations were prepared in screened charcoal treated rabbit plasma and analyzed each quality control (QC) standards in six replicates on the same day and different days. Precision (%CV) for intra-batch and inter batch ranged from 0.83% to 1.75% and 1.40% to 1.63%, respectively. The accuracy results for intra-batch (Within run) and inter-batch (Between run) were within 96.56% to 103.00% and 98.53% to 100.44% respectively, at all QC levels.
The extraction recovery was determined by comparing the extracted QC standards with un-extracted QC standards at three different concentrations of LQC (1.50 μg/mL), MQC (400.00 μg/mL) and HQC (700.00 μg/mL). The mean recovery was found to be 96.23%. Stock solution stability was performed to check stability in stock solutions prepared in diluted H2SO4 stored at 2-8°C in a refrigerator. The freshly prepared stock solutions were compared with stock solutions prepared before 18 days. The % change was 0.03% indicates that stock solutions were stable at least for 18 days. Bench top and autosampler stability was investigated at LQC and HQC levels. The results revealed that iron was stable in plasma for at least 24 hrs at room temperature. It was confirmed that repeated freezing and thawing (three cycles) of plasma samples spiked at LQC and HQC levels did not affect their stability. The long-term stability results also indicated that analyte was stable in a matrix up to 45 days at a storage temperature of -30°C. The validated method has been successfully applied to quantify total iron concentrations in rabbit plasma samples. Male rabbits were obtained from Bioneeds, Bangalore. After 100g of feed administration from left ear marginal vein 1mL of blood samples were collected at specific time intervals up to 30 hrs. Plasma was separated from blood samples and was stored at -30°C until analysis. The study was carried out after approval from an independent animal ethics committee. The pharmacokinetic parameters evaluated were Cmax (maximum observed drug concentration during the study), AUC0-30(area under the plasma concentration–time curve measured 30 hours, using the trapezoidal rule), Tmax (time to observe maximum drug concentration), Kel (apparent first order terminal rate constant calculated from a semi-log plot of the plasma concentration versus time curve, using the method of least square regression) and T1/2 (terminal half-life as determined by quotient 0.693/Kel).
A HPLC method was developed to determine the iron concentration in rabbit plasma using derivatised RP-HPLC .The present study on iron bioavailability serves as a basis for calculating total iron requirement or recommendation for various segments of the population. Depending on the bioavailability it reveals the total iron content in vegetarian and non vegetarian food. Method validation was performed as per US-FDA procedure for the developed method for the intended use .All the values are within the acceptance criteria. The highlights of the developed method include, low plasma volume, simple extraction process and matrix free interfered makes the method very rapid and sensitive for estimating the concentration of iron in rabbit plasma.
The Authors are grateful to the Chalapathi Institute of Pharmaceutical sciences, Lam, Guntur, Andhra Pradesh, India to carry out of this research work. The authors declare that they have no conflicts of interest in the research.

![]()

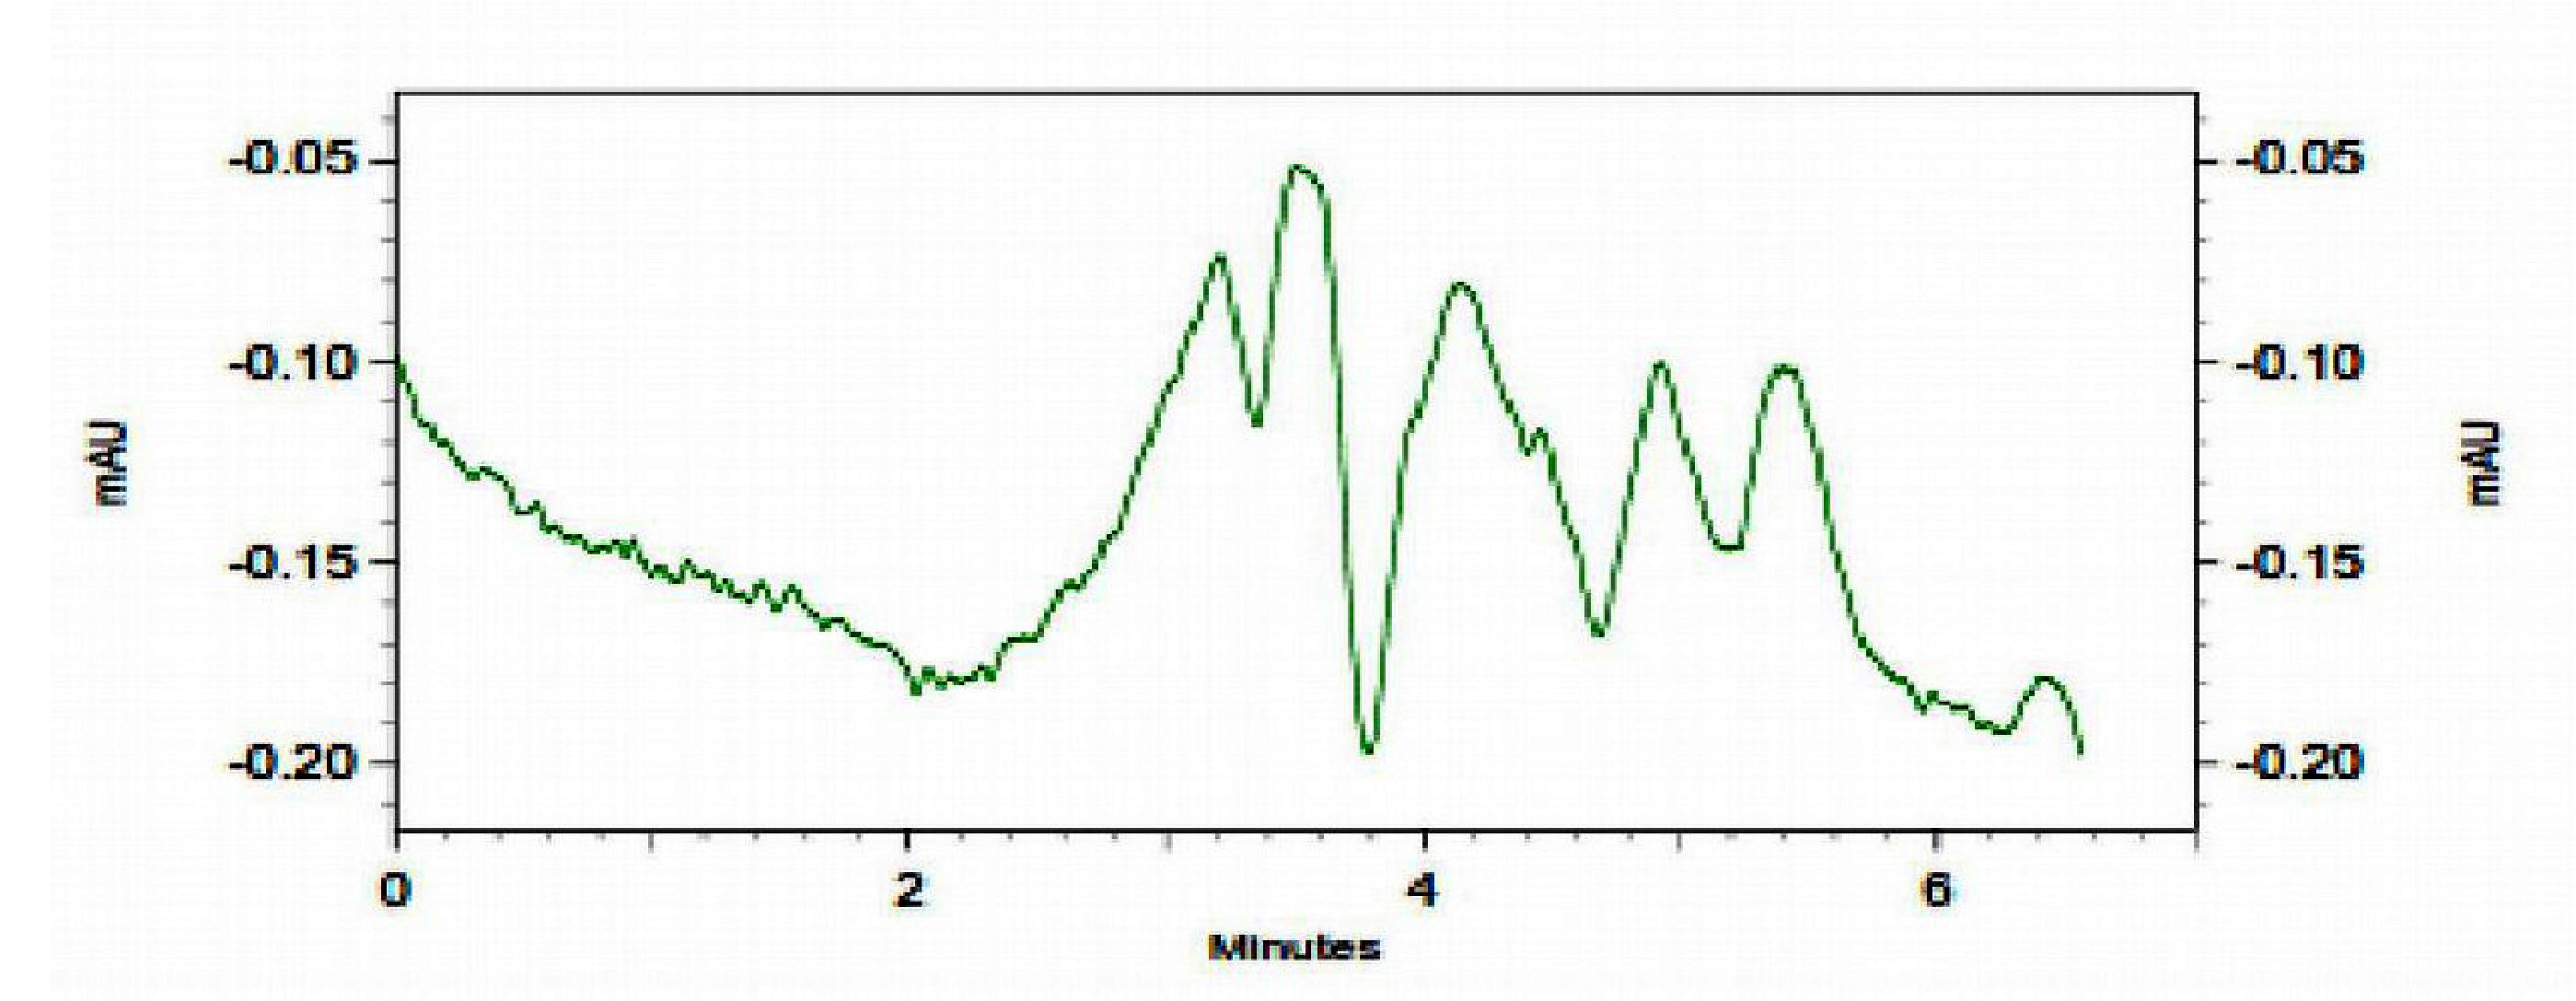 |
Figure 1: Chromatogram of rabbit plasma sample |
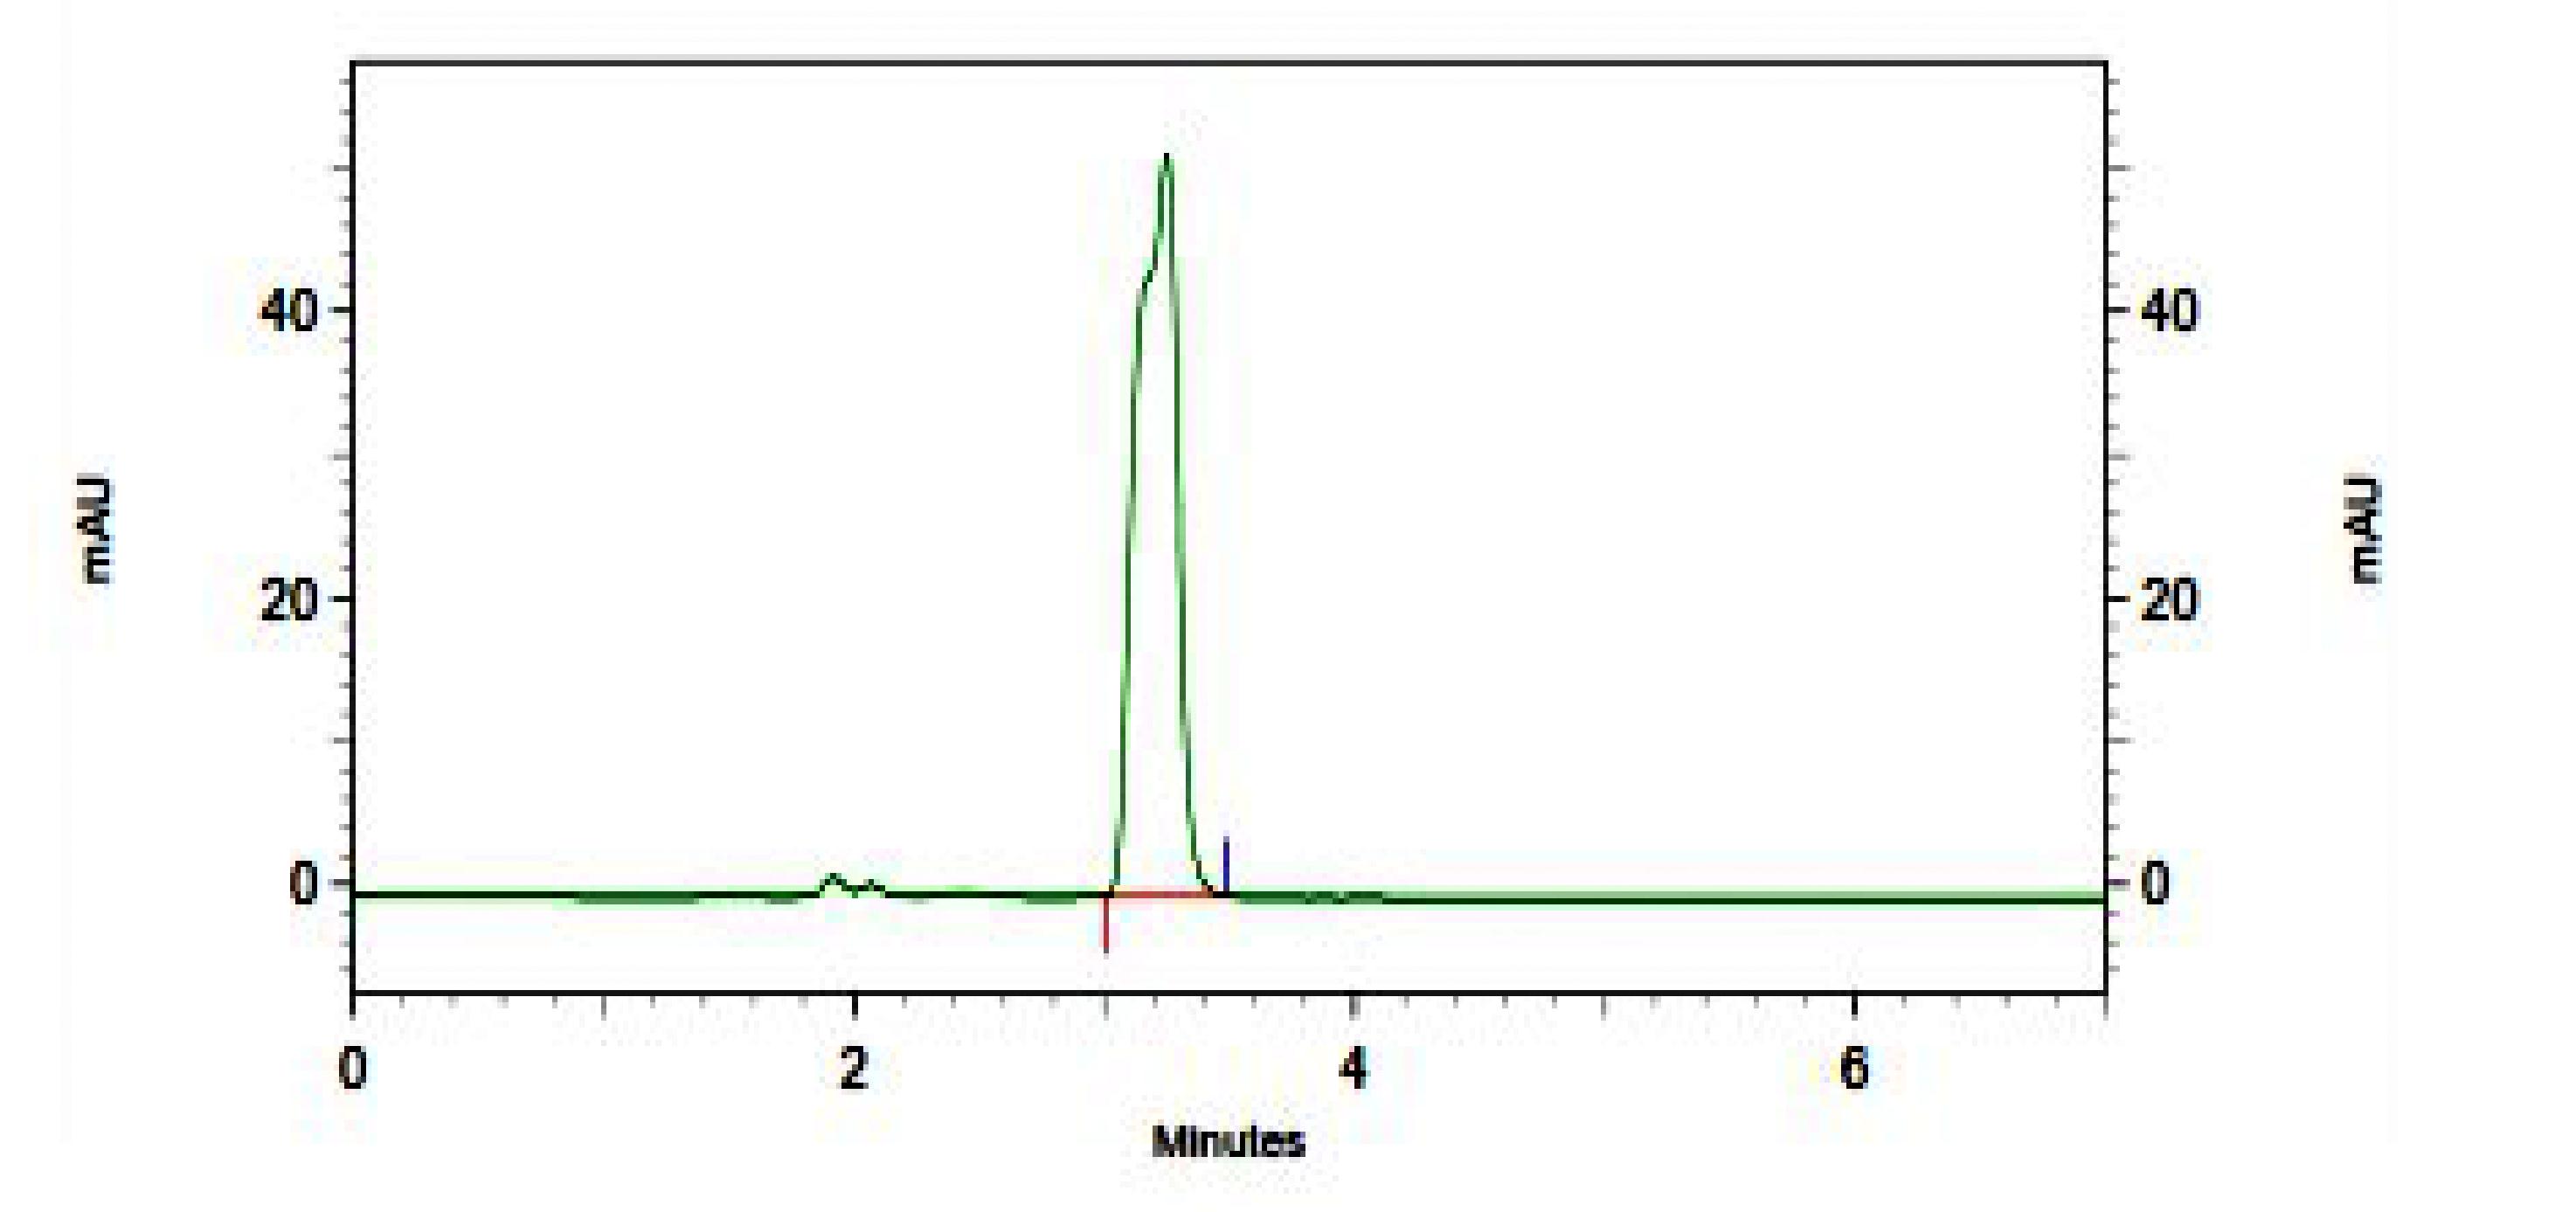 |
Figure 2: Chromatogram of total iron rabbit plasma sample |
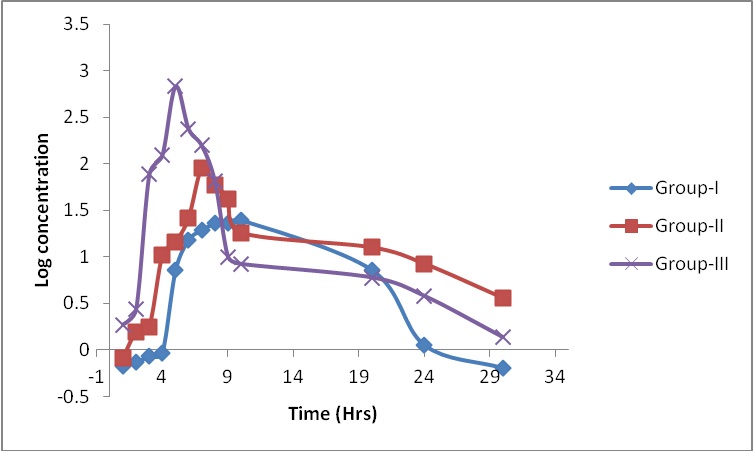 |
| Figure 3: Log concentration vs time graph of iron after oral administration in rabbit |
Spiked plasmaconcentration (µg/ml) |
Concentration measured (mean, µg/ml) |
SD* |
CV (%)**(n=6) |
Accuracy (%) |
0.5 |
0.5 |
0.01 |
1.39 |
99.32 |
1.00 |
1.01 |
0.03 |
1.04 |
101.04 |
5.00 |
5.51 |
0.24 |
1.74 |
103.08 |
10.00 |
9.84 |
0.34 |
1.46 |
98.38 |
20.00 |
28.42 |
1.64 |
0.39 |
96.84 |
40.00 |
41.48 |
2.37 |
1.38 |
99.48 |
60.00 |
62.00 |
4.64 |
1.05 |
101.33 |
80.00 |
80.20 |
7.09 |
0.49 |
101.60 |
100.00 |
101.780 |
4.82 |
1.95 |
98.72 |
200.00 |
201.80 |
4.82 |
1.15 |
98.72 |
400.00 |
401.80 |
4.82 |
1.95 |
98.72 |
600.00 |
601.80 |
4.82 |
1.55 |
98.72 |
800.00 |
801.80 |
4.82 |
1.45 |
98.72 |
*Standard deviation |
||||
Spiked plasma concentration (µg/ml) |
Within run |
Between run |
||||
|---|---|---|---|---|---|---|
Concentration measured (mean, µg/ml, mean ± SD) |
CV (%) (n=6) |
Accuracy (%) |
Concentration measured (mean, µg/ml, mean ± SD) |
CV (%) (n=6) |
Accuracy (%) |
|
0.50 |
0.48±0.003 |
1.06 |
96.56 |
0.50±0.04 |
1.59 |
100.44 |
1.50 |
1.48±0.08 |
1.13 |
98.68 |
1.49±0.08 |
1.45 |
99.43 |
200 |
201.23±5.99 |
1.75 |
103.00 |
201.81±3.46 |
1.63 |
99.78 |
700 |
701.50±10.56 |
0.83 |
96.88 |
701.40±7.59 |
1.40 |
98.53 |
| Table 2: Precision and Accuracy data | ||||||
Stability |
Spiked plasma concentration (µg/ml) |
Concentration measured (mean, µg/ml, mean ± SD) |
CV (%) (n=6) |
|---|---|---|---|
Room temperature stability (24.5 hrs) |
1.50 700 |
1.48±0.08 702.50±10.46 |
5.13 6.03 |
Long term stability (90 days) |
1.50 700 |
1.42±0.03 701.50±10.26 |
5.33 6.3 |
Freeze and thaw stability (cycle 3, 48hrs) |
1.50 700 |
1.43±0.04 702.50±10.51 |
5.67 6.88 |
| Table 3: Stability of the plasma samples | |||
Pharmacokinetic parameter |
Group- 01 |
Group-02 |
Group-03 |
|---|---|---|---|
Cmax (µg/ml) |
12.9 |
89.00 |
681 |
AUCo-t (µg h/ml) |
286.655 |
494.2 |
1473 |
AUCo-α (µg h/ml) |
288.04 |
56365.29 |
1473 |
tmax (h) |
10.00 |
7 |
5 |
t1/2 (h) |
9.00 |
13 |
7.0 |
kel |
0.1 |
0.08913 |
0.42 |
| Table 4: Mean Pharmacokinetic parameters of total iron in Rabbit plasma after oral feed | |||


