Open Access
Research Article
Max Screen >>
ISSN: 2456-5504
Copyright: © 2016 Salas Buzón M del C. This is an open-access article distributed under the terms of the Creative Commons Attribution License, which permits unrestricted use, distribution, and reproduction in any medium, provided the original author and source are credited.
Related article at Pubmed, Google Scholar
Background: To study the reliability and agreement between electronic portal imaging (EPI) and cone beam computed tomography (CBCT) with megavoltage (MV) and fiducial markers (FM), in image-guided radiotherapy (IGRT) for prostate cancer.
Materials and Methods: A total of 40 patients with prostate cancer were enrolled in a prospective study. Before each daily session, one megavoltage ortogonal EPI in two proyection (antero-posterior and lateral) and two megavoltage cone beam computed tomography (MV CBCT) images were sequentially acquired for 11 days. A total of 1,320 images from 40 patients were obtained and analyzed, of which 440 were megavoltage electronic portal images with fiducial markers (MV EPI-FM) images, 440 were megavoltage cone beam with fiducial markers (MV CBFM) images, and 440 were megavoltage cone beam soft tissue (MV CBST) images. Off-line reconstruction was performed using fiducial markers (MV CBFM) and soft tissue matching (MV CBST). To evaluate the correlation between the three imaging methods, each one was compared to the other two. The Intra-class Correlation Coefficient (ICC) was calculated and Bland-Altman analysis was performed. Value of ICC was used to assess the agreement or reliability of quantitative data for the two techniques namely displacement of the isocenter in the three spatial axes between MV EPI-FM and MV CBCT (FM or ST).
Results: Using FM matching ICC values for MV EPI-FM versus (vs.) CBFM were 0.911, 0.849, and 0.924 in the left-right (LR), superoinferior (SI) and anterior-posterior (AP) axis, respectively. Using soft tissue matching ICC values for MV EPI-FM vs. CBST were 0.767, 0.715, and 0.806 in LR, SI and AP axis. ICC values for CBFM vs. CBST were 0.795, 0.725, and 0.834 in the LR, SI and AP axis.
Conclusion: Reliability and agreement between EPI-FM and CBFM using MV images is greater, as compared to the agreement between EPI-FM and CBST, and between CBFM and CBST. Concordance as measured by the ICC was higher when fiducial markers were used.
Keywords: Image Guided Radiation Therapy; Correlation analysis; MV Cone Beam CT; Electronic portal imaging; Fiducial markers; Prostate cancer
List of Abbreviations: 3D CRT: Three-dimensional conformational radiotherapy; 2D: Two dimensions; 3D: Three dimensions; IMRT: Intensity-modulated radiation therapy; IGRT: Image guided radiotherapy; LR: Left-rigth: SI: Supero-inferior; AP: Anteroposterior; LAT: Lateral; EPI: Electronic portal Image; CBCT: Cone beam computed tomography; PTV: Planning tumor volume; MV: Megavoltage; KV: Kilovoltaje; FM: Fiducial markers; ICC: Intraclass correlation coefficient; CBFM: Cone beam with fiducial markers; CBST: Cone Beam with soft tissues; LINAC: Linear accelerator; KV CT: Kilovoltaje computed tomography; MV EPI: Electronic portal image with megavoltage; MV CBFM: Megavoltage cone beam computed tomography with fiducial markers; MV CBST: Megavoltage cone beam soft tissues; MV EPI-FM: Megavoltage electronic portal image with fiducial marker
IGRT combined with three-dimensional conformal radiation therapy (3D CRT) and intensity-modulated radiation therapy (IMRT) is gaining quick acceptance in radiotherapy treatment of prostate cancer [1-4]. The advantage of this technique is that it localizes the target volume accurately, thus increasing precision in treatment delivery. Also, IGRT allows to reduce planning target volume (PTV) margins, which spares rectal and bladder toxicity and makes modern, daily-use technological tools highly reliable [5-8] .
FM are used in radiotherapy for to enhance the process of identifying prostate [9-11]. Normally, FM are placed inside to the target volumes prior to the radiotherapy simulation and serve as surrogates to the target volumes [12-16]. It is hoped that the FM can be clearly and easily identified and localized on both simulation and verification images. An important requirement is that serve to reduce uncertainties related to the process of positioning and administration of radiotherapy [2,17] .
A condition on the use of FM is a clear identification of markers on the images without introducing a significant amount of artifacts. The reduction of artifacts on the planning CT is especially desirable, since extensive artifacts could interfere with structure delineation, dose calculation and affect the clarity of the anatomical region of interest [18].
The gold markers, are widely used in IGRT, having studied the visibility and artifacts resulting in various modalities of image [19]. After analysis of gold FM, carbon and polymers as fiducial markers on the CT images, gold markers produced a significant artifact, while no artifacts were observed with polymer markers. Also the contrast increased with KV for the gold markers, whit decreasing for the polymer and carbon marker [20,21]. If MV will be the sole imaging modality for positioning verification, it may be necessary to use gold markers despite the artifacts they create on the CT simulation images [20].
Although we cannot ignore the fact that insert FM is an invasive procedure, and that involve an economic cost and human resources [22,23], fiducial marker implantation for prostate IGRT is associated with a small percentage of patients experiencing moderate to severe complications requiring further medical interventions [24].
As usual, the FM are widely used in imaging methods 2D and 3D, since they are easily visualized on EPI and KV-CBCT scans [3,13-15,25,26].
Studies have been conducted comparing displacements measured by fiducial markers in 2D EPI vs. 3D KV CBCT [27-31]. But, there are no studies available comparing the accuracy of different imaging methods, for their application in IGRT, using MV linear accelerators (MV LINAC) [32,33], although this technology (KV or MV) is extensively used in our professional field [3,29,34,35].
The MV LINAC allow 2D orthogonal images systems such as electronic portal image (EPI) [36] and volumetric or 3D imaging systems, such as cone beam computed tomography (CBCT) [37,38]. Both imaging methods have different characteristics and acquisition protocols and are performed differently. However, such differences do not mean that any of these systems is superior to the other. There is no clear evidence on the best imaging method in daily clinical practice [39,40], the most accurate in target localization, or the preferable method -planar or volumetric images- when an IGRT protocol is initiated for treating a prostate cancer [30,31,41,42].
Both, 2D and 3D imaging systems have advantages and disadvantages, and there is no general agreement on the best method to be used in centers fitted with MV IGRT equipment [30]. It depends on the technical characteristics of the LINAC, the energy available for the acquisition of images, the use or not of FM, and the organizational reliability of each institution [29,34,37].
There are some studies conducted to assess agreement between EPI and CBCT but have different methods of assessment to ours [29-31,34,43], and performed mainly with KV energy, nevertheless there are few data quantifying the agreement between EPI and CBCT with MV energy.
Therefore, the aim of this study was quantify the reliability or reproducibility of the different imaging methods provided by a exclusive MV image device, by calculating agreement between EPI, CBFM and CBST.
The study sample was composed of 40 patients with early T1-T3a prostate adenocarcinoma included in a prospective IGRT protocol between January 2012 and June 2013. The study was approved by the Ethics Committee of the Puerta del Mar University Hospital, Cadiz, Spain.
Four (3mm x 1mm) gold FM (Lorca Marín®) were implanted in the prostate under trans-rectal ultrasound guidance. Treatments were delivered using the LINAC ONCOR, SIEMENS, of 6 MV. The Planning Target Volume (PTV) was defined as the prostate ± the seminal vesicles with a 7 mm. margin in each direction, except for a 5 mm. posterior margin. Ninety-five percent of the dose was delivered to 95% of the target volume. Patients and treatment characteristics are presented in Table 1.
All patients underwent bowel, colon and vesicle preparation according to an adapted protocol of Smitsmans et al. [44]. With the patients in supine position with a support under the knees and feet, CT scans (Phillips Brillance CT 64-slices, 120 Kvp, 60 mA) of the pelvis were acquire with a slice thickness of 3 mm and a transversal pixel size of 0,65 x 0,65 mm2. Reference points were marked on the skin. Treatment volumes, FM, bladder, rectum and femoral heads were contoured using the Virtual Simulator PCRT, version 6.0.
Patients were positioned daily using the immobilization system described above and aligned to the treatment room isocentre using skin markers. Daily pre-treatment 6 MV-EPI were acquired by antero-posterior (AP) and lateral (LAT) projection, using 2 Units Monitor (UM) in AP projection, and 3 UM in LAT projection. By means of specific ONCOR software (Coherence Therapist system Work Space 2.2.09), we performed the matching of the four FM on MV EPI AP and LAT images, which were compared with digitally reconstructed radiographs (DRR) generated from the planning CT. Shifts between image sets were calculated automatically to identify the new position of the isocenter in cm. in the three axes. Isocenter deviations from initial tattoos (skin markers) were calculated and recorded, obtaining 1520 EPI (38 sessions per patient). For the purposes of concordance analysis, the EPI on days 1,2,3,4,5,10,15,20,25,30 and 35 were selected: 440 EPI (projections AP and LAT).
A total of 440 CBCT (29%) were acquired in 11 sessions per patient (days 1,2,3,4,5,10,15,20,25,30 and 35) at standard dose, using 190-degree arc therapy. Thickness of reconstruction: 10 mm, 10 x 10 cm field. Off-line reconstruction and MV-CBCT adjustment with FM (CBFM) and soft-tissue (CBST). Shifts were firstly estimated by alignment of FM on CBFM and later of soft tissues on CBST. Deviations of the isocenter were measured in the AP, SI and LR dimensions. Shifts estimated by CBCT were registered for analysis, but they were never applied to patients. The matching of the MV-EPI and MV CBFM was performed by five physicians while off-line matching of MV CBST was performed by a single physician.
With the patient immobilized, the isocenter of the treatment was immediately aligned using the shifts identified on EPI images with FM. The radiotherapist did not enter into the room. The process was performed as quickly as possible in 25 to 30 minutes.
An interobserver study was performed to evaluate the influence of interobserver variation on FM matching with the MV CBFM image set. Because these markers are clearly visible on CBCT, they are not clearly visible on KV CT reference images due to the distortion caused by the high atomic number of gold, which causes a slight blurring of the markers and needs careful matching [18-20]. Image sets were randomly chosen from five patients selected from the 40 study patients. The interobserver study was performed by five physicians with experience using planning system alignment tools and involved in the image-guidance program. The observers performed volumetric registration using translational shifts only, to align the FM as visualized on the CBCT dataset with the FM visualized on CT reference images. The resulting isocenter shift was computed and recorded for each observer and for each dataset. To give an estimate of intraobserver variability, one observer repeated the entire FM alignment procedure 1 week later.
An intraobserver study was performed to evaluate the influence of intraobserver variation for soft tissue matching on MV-CBST following the same procedure. Both studies were conducted over a period of seven days.
Statistical analysis was performed using IBM SPSS Statistics 21 and the freeware EPIDAT 4.0. Quantitative variables are described as frequencies and tables. Agreement or reliability of quantitative variables are frequently assessed using Pearson's correlation coefficient (r). However, in this study the Pearson's correlation coefficient is not useful, given that two measuring tools can systematically provide different values other and obtain a perfect correlation (r=1) but null reliability [45]. Therefore, Intraclass Correlation Coefficient (ICC) [46], was used to assess the agreement or reliability of quantitative data for the two techniques i.e. displacement of the isocenter in the three spatial axes between MV EPI-FM and MV CBCT (FM or ST). ICC is defined as the proportion of variance among patients and provides an objective coefficient that is especially useful when comparing two methods, as it is the case of this study.
As a rough guide, we followed the ratings suggested by Landis and Koch et al. An agreement level of 0–0.2 was considered poor, 0.2–0 .4 fair, 0.4–0.6 moderate, 0.6–0.8 substantial, and 0.8-<1.0 almost perfect [47]. Interobserver agreement for MV EPI, MV CBFM and planning CT was calculated by the ICC in each axis, while intraobserver agreement was calculated for MV CBST (Figure 1).
The difference between measured couch shifts was then plotted against the average couch shift as recommended by Bland and Altman [48] when new methods of measurement emerge. The 95% confidence interval (CI) of the error distribution is also reported. The percentage of shifts within a ± 3 mm and ±5 mm tolerance was calculated for the three techniques, in order to make a comparison with previous concordance studies. The frequency of differences between measurements in each plane was calculated and represented graphically (Figure 2).
A total of 1,320 images from 40 patients were obtained and analyzed, of which 440 were MV EPI-FM images, 440 were MV CBFM images and 440 were MV CBST images. All shifts resulting from the EPIs were applied to each session. Each EPI delivered 2 UM per image AP and 3 UM per image LAT. The CBCT delivered 10 cGy per scan. MV CBST matching was performed with soft-tissue and ignoring FM.
To evaluate the correlation between the three imaging method, each one was compared to the other two. As summarized in Table 2, ICC values are shown along with their corresponding 95% CI and significance values for all three axis. We found an "almost perfect" strength of agreement between MV EPI-FM and MV CBFM in LR, SI and AP, as well as between MV EPI and MV CBST and between MV CBFM and MV CBST.
Figure 1 shows the results of the Bland-Altman analysis for the three techniques. The average differences between MV EPI-FM and MV CBFM were: -0.0330 (95% CI.: - 0.0495, -0.0164), -0.0164 (95%CI.: -0.0365, +0.0038), 0.0402 (95%CI: +0.0196 +0.0609) in the LR, SI and AP axis respectively (Figure 1a-c). Between MV EPI-FM and MV CBST: -0.0445 (95%CI.: -0.0717, -0.0174), -0.0430 (95%CI.: -0.0702, - 0.0157), 0.1845 (95%CI: +0.1543, +0.2148) in the LR, SI and AP axis (Figure 1.d-f). Between MV CBFM and MV CBST: -0.0116 (95%CI.: -0.0381, +0.0150), -0.0266 (95%CI.: -0.0539, +0.0008), 0.1443 (95%CI: +0.1153, +0.1734) in the LR, SI and AP axis (Figure 1g-i).
Table 3 Shows the percentage of shift differences within a ± 3mm. and ±5 mm
The interobserver ICC for the LR axis was 0.963 (95% CI.: 0.874 - 0.996); 0.958 (IC 95%: 0.856 - 0.995) for the SI axis, and 0.978 (IC 95%: 0.922 - 0.997) for the AP axis, interpreting the strength of agreement as "almost perfect" in the three axis. All physicians had a minimum of six month experience in MV CBFM matching. The intraobserver ICC for the LR axis was 0.960 (95% CI.: 0.871 - 0.997); 0.956 (IC 95%: 0.860 - 0.990) for the SI axis, and 0.972 (IC 95%: 0.990 - 0.998) for the AP axis, interpreting the strength of agreement as "almost perfect" in the three axis.
Figure 2 shows histograms of the frequency of differences between shifts in each technique in each axis
To the extent of our knowledge, there are no previous studies comparing agreement between MV energy and FM imaging methods used before treatment and sequentially in the same patient. Such lack of literature is surprising, considering the large number of institutions that use MV IGRT exclusively.
We evaluated agreement between planar systems and MV volumetric systems using EPI images with FM, since according to numerous studies, it is a valid reference method in IGRT [11,15,16,41,49-51]. As alternative methods, we used CBCT with fiducials and CBCT with soft-tissue. Table 4 summarizes the studies assessing agreement between IGRT methods with FM and transponders.
Agreement between planar and volumetric imaging techniques with FM and ST registration
The highest coefficient of concordance (ICC) was found between MV-FM EPI and MV CBFM: 0.911, 0.849, 0.924 in the LR, SI and AP axes respectively, which is an "almost perfect" agreement, similar to that reported in previous studies [31,34]. Moseley et al. reported a Pearson's correlation coefficient of 0.95, 0.81, and 0.84 in the LD, SI, and AP dimensions between MV and KV using FM, and 0.90, 0.49 and 0.51 respectively using soft tissue [34]. Foster el al. reported high coefficients of concordance between kV imaging systems, CBCT and the Calypso-4D system. Although the mean of mismatches among the three methods was lower than 0.8 mm, Foster observed more uncertainty in prostate localization by CBCT as compared to 2D orthogonal images, although such differences were not clinically significant [31].
In our study, interobserver variability in MV CBFM did not have any impact on agreement among images. According to the ICC values obtained for the five observers, agreement was excellent. And it was so despite the potential difficulty involved in seed matching due to sligth distortion and artifacts caused on gold seeds on reference CT [18-20], which is more dramatic in the LR and SI dimensions. The high agreement observed demonstrates that the MV CBCT system has millimeter accuracy and precision when localizing unambiguous objects such as FM [25].
Analyzing the possible impact of the size of the FM used, we do not believe to be significant. DeLangen et al, and Chan et al, investigated a large number of commercial FM including solid gold, gold coil, and polymer types, in various imaging IGRT modalities. They found that solid markers were preferred in EPI, that only the large diameter markers are visible in MV, that the marker measuring 0,9 mm x 5 mm appears to be clinically optimal in pelvic radiotherapy patients (80% visualization success in lateral EPID) [18,52] and visibility of gold coils of 0,75 mm diameter or larger is comparable across all imaging modalities studied.
When the planar or volumetric system was compared with CBST, agreement diminished in the three axes. Agreement was lower in the LR and SI axes, and higher in the AP axis, where agreement was "almost perfect". When comparing the two volumetric imaging methods, the results obtained are very similar, with higher agreement in the AP axis. There is an explanation to such results, since although the quality of MV images is lower than that of KV images [53], the interface and gray gradients on rectum and prostate tissue MV images (often with gas inside) and prostate and seminal vesicle tissue images is higher as compared to the interface and gray gradients on prostate and peripheral prostate tissue images in the LR axis [37,43], and on prostate and penile bulb tissue images, in the SI axis. The quality of the image is also deleterious to the reproducibility of IGRT based on soft-tissue, which could increase interobserver variability [53]. Langen et al. stated that 3D data delivered by CBCT images may hinder the localization of the prostate, as it adds more uncertainty than two 2D orthogonal images. In addition, reported that FM are more advantageous and accurate, which would reduce inter-user variability [54].
We reviewed the studies available comparing EPI with CBCT based on FM/electromagnetic transponders and observed that most studies were performed with KV energy and yielded higher percentages of concordance when using FM/transponders than when using volumetric images without markers [29,34,54].
If the rotation of the prostate is not considered, only Logadottir et al. reported similar position uncertainties when comparing 2D/3D techniques based on FM and KV soft-tissue for patient positioning, soft-tissue requiring only a 1mm higher positioning margin [30].
The highest percentage of shifts within a ± 3 mm. differences was between EPI-FM and CBFM: 94.5%, 89.5% and 90.7% in LR, SI and AP directions, as compared to CBST, which is in agreement with the results obtained by Moseley et al. [34] and Foster et al [31] and slightly lower in the SI axis. The CT slice thickness also adds to the uncertainty inherent to localization by CBCT, as compared to 2D localization based on FM. In our study, CT slice thickness was 3 mm. Slices of lower thickness such as 2.5 mm.[34], or 1 mm. [31], would improve precision, since a better resolution in the SI direction would increase the precision of CBMF scans in this axis.
A limitation to this study is that FM was visible during off-line reconstruction of CBST, which was performed by a single physician. As FM could not be suppressed using any software, the strategy used was to initiate matching by bone references and then by prostate soft tissues, ignoring FM. We are aware that this could lead to bias, therefore, concordance results in matching based on CBST would be considered cautiously. This bias was unavoidable, since we wanted to assess agreement among MV imaging techniques prior to delivering the treatment to each patient.
This study contributes useful comparative data on the effectiveness of MV in IGRT that could be used in the selection of the most appropriate imaging method for positioning patients with prostate cancer prior to the treatment.
The precision, agreement and reliability of IGRT based on MV imaging for the localization of the prostate is similar among EPI and CBCT based on FM. The lower precision or reliability observed in the absence of FM could be due to the lower quality on MV CBCT images localizing soft tissues, which have a higher impact on the shifts observed. It is true that el use of soft tissue resulted in greater discrepancy, but the difference is clinically insignificant. The difference between MV CBFM and MV CBST was less than 2 mm in any direction. Considering the PTV margin, it is safe to use soft tissue for guidance to ensure adequate coverage.

![]()

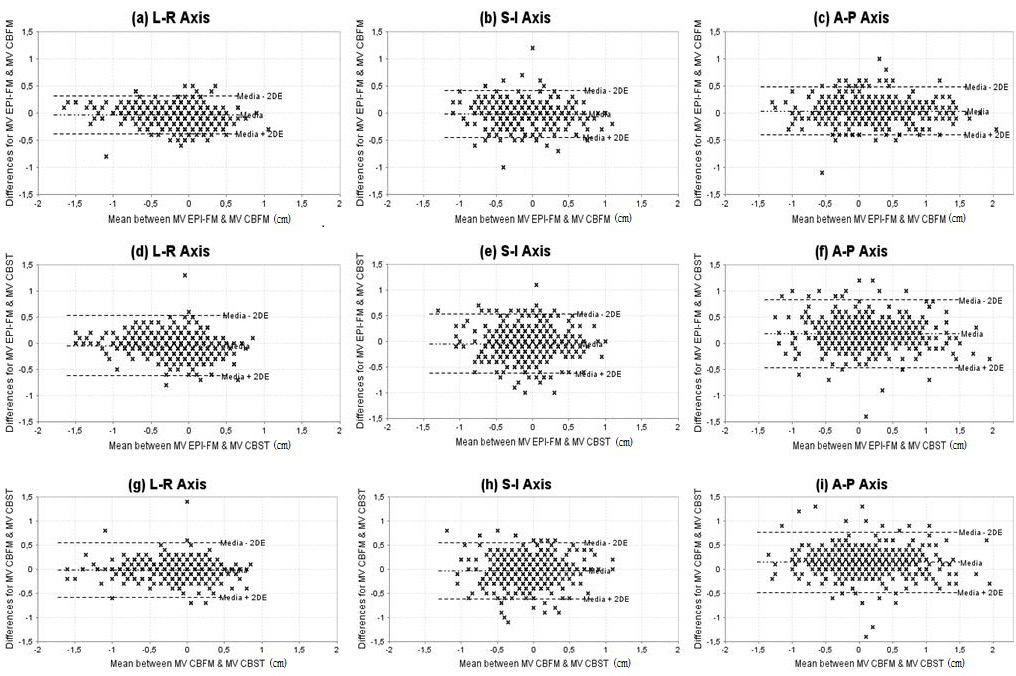 |
| Figure 1: The difference between the imaging modalities as a function of the mean value of FM and soft tissues (prostate), in cm. The dashed lines show the media +/- 2 SD in each plane. (a-c) MV FM vs. MV CBFM; (d-f) MV FM vs. MV CBST; (g-i) MV CBFM vs. MV CBST |
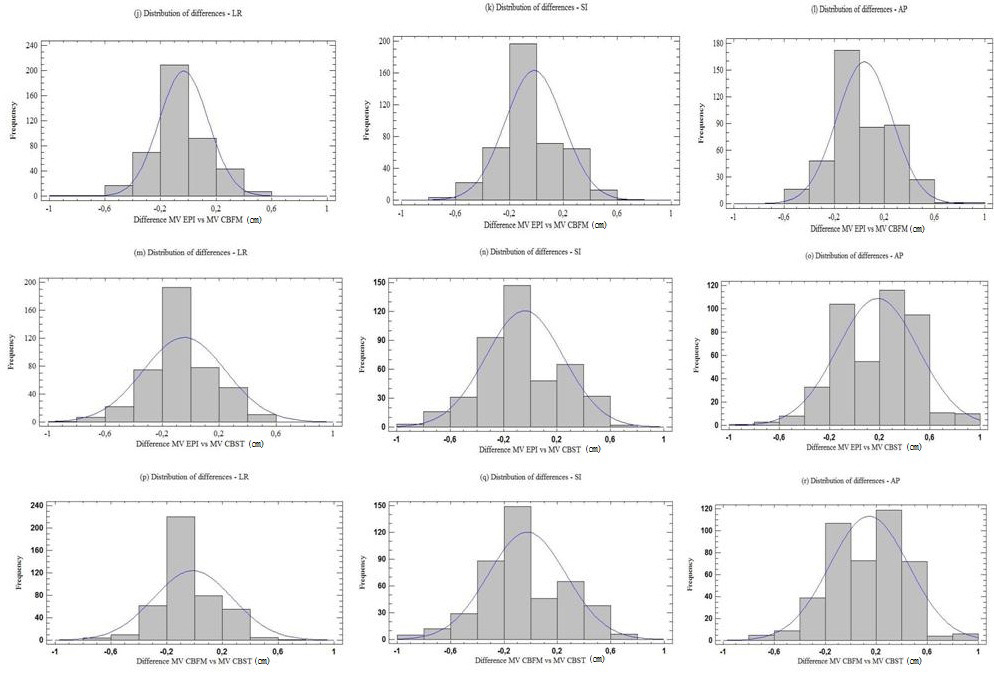 |
| Figure 2: Frequency of differences in cm. occurring between shifts according to the method and each axis. (j-l) MV FM vs. MV CBFM; (m-o) MV FM vs. MV CBST; (p-r) MV CBFM vs. MV CBST |
| No. of patients | 40 |
|---|---|
| Age | |
| Median | 68 |
| Range | 52-79 |
| Radiotherapy dose (cGy) | |
| Median | 7670 |
| Range | 7540-7850 |
| Fraction size (cGy) | 200 |
| Gleason Score (no. of patient) | |
| ≤6 | |
| 7 | 37 |
| ≥8 | 0 |
| Clinical stage (no. of patients) | |
| T1c | 22 |
| T2a | 10 |
| T2b | 1 |
| T2c | 6 |
| T3a | 1 |
| Androgen supression (no. of patients) | |
| Yes (neoadyuvant+concurrent) |
13 |
| Non | 27 |
| Treatment technique (no. of patients) | |
| 3D CRT | 4 |
| IMRT | 36 |
| Abbreviations.3D CRT: 3D conformational radiotherapy; IMRT: intensitymodulated radiation therapy Table 1: Patients and treatment characteristics |
|
| Intra class Correlation Coefficient and 95% Confidence Interval | Significancerelative to 0 | |||||
|---|---|---|---|---|---|---|
| LR | SI | AP | LR | SI | AP | |
| MV EPI-FM vs. MV CBFM |
0.911 (0.891-0.927) |
0.849 (0.820-0.873) |
0.924 (0.908-0.932) |
F:22.081 p<0.0001 |
F:22.081 p<0.0001 |
F:26.195 p<0.0001 |
| MV EPI-FM vs. MV CBST |
0.767 (0.725-0.804) |
0.715 (0.665-0.759) |
0.806 (0.633-0.884) |
F:7.740 p<0.0001 |
F:6.125 p<0.0001 |
F:12.003 p<0.0001 |
| MV CBFM vs. MV CBST |
0.795 (0.758-0.827) |
0.725 (0.678-0.767) |
0.834 (0.731-889) |
F:8.752 p<0.0001 |
F:6.313 p<0.0001 |
F:13.158 p<0.0001 |
| Abbreviations: LR: Lateral; SI: Supero-inferior; AP: Antero-posterior; MV EPI-FM: Megavoltage electronic portal image with fiducial markers; MV CBFM: Megavoltage cone beam computed tomography with fiducial markers; MV CBST: Megavoltage cone beam soft tissues Table 2: Results of Intraclass Correlation Coefficient between three methods |
||||||
| Method | ±3mm | ±5mm | |
|---|---|---|---|
| LATERAL | MV EPI-FM vs. MV CBFM | 94.5% | 99.5% |
| MV-EPI-FM vs. MV CBST | 89.8% | 97% | |
| MV CBFM vs. MV CBST | 94.1% | 97.7% | |
| LONGITUDINAL | MV EPI-FM vs. MV CBFM | 89.5% | 98.2% |
| MV EPI-FM vs. MV CBST | 80.2% | 92.3% | |
| MV CBFM vs. MV CBST | 79.1% | 93.2% | |
| VERTICAL | MV EPI-FM vs. MV CBFM | 90.7% | 97% |
| MV EPI-FM vs. MV CBST | 70% | 90.2% | |
| MV CBFM vs. MV CBST | 76.8% | 91.8% | |
| Abbreviations: MV EPI-FM: Megavoltage electronic portal image with fiducial markers; MV CBFM: Megavoltage cone beam computed tomography with fiducial markers; MV CBST: Megavoltage cone beam computed tomography soft tissues Table 3: Percentage of shifts within a ±3 and ± 5 mm differences |
|||
| Author | Year | No. Patients | Energy | No. Dataset | Comparison | Objetive | Conclusion |
|---|---|---|---|---|---|---|---|
| Langen KM. et al. [37] | 2005 | 3 patients | MVCT with KVCT images (planification) | 120 | Marker, anatomical and contour using MVCT | Asses three techniques with MV-CBCT | The use of FM in MVCT is ventajous to reduce the inter-user variability of image registration. Markers based registration to be more accurate than the other techniques. |
| Moseley DJ et al. [21] | 2007 | 15 patients | MV-EPI FM KV-CBFM KV-CBST | 547 | MV-EPI FM vs. CBCT-FM MV-EPI FM vs. CBCT-ST | Determining the equivalence of two methods to determine the isocenter corrections | Cone-beam CT is an accurate and precise tool for image guidance. It provides equivalent means of patient setup correction for prostate patients with implanted gold fiducial markers. |
| Gayou O. et al. [36] | 2008 | 19, 17 and 12 patients | US; MV-CBST; MV PI-FM | 696 vs. 598 vs.393 | US. vs. MVCBCT vs. PIFM | Analyzed couch alignments to calculate margins based on the three methods (IMRT) | MV-CBCT and FM localization suggest smaller variability. |
| Owen R. et al. [38] | 2009 | 8 patients | In-room CT; KV-EPI | 254 | CT on rails and electronic portal image (EPI) radiograph | Agreement between inroom CT on rails and EPI radiograph | Found significant differences between in-room CT and electronic portal imaging |
| Ogunleye P. et al. [39] | 2009 | 30 Phantom measures and 259 patients measurements | KV images | 30 Phantom measures and 259 patients measurements | Electronic tranponder/Calypso 4D vs. OBI-KV Image | Correlation of three systems | Good correlation between Calypso and OBI |
| Barney M. et al. [20] | 2010 | 36 patients | KV-PIFM; KV-CBST | 1244 vs. 286 | KV-PIFM vs. KV-CBST | Comparing fiducial markers and CBCT for dairy localization of prostate | Cone-beam computed tomography and KV fiducial imaging are similar; however, more than one fourth of CBCT and KV shifts differed enough to affect target coverage. |
| Logadottir A. et al. [17] | 2011 | 20 patients | KV-CBCT; KV-PIFM | Unspecified | KV-FM (OBI) vs.KV-FM (Exatrac) and KV-FM vs. KV-CBCT | Positional uncertainties related to setup of prostate: using 2D-2D and 3D images | The precision of the 2D-2D setup is equivalent to the precision of the 3D images. Soft-tissue based set-up needs 1 mm larger set-up margins. |
| Foster RD. et al. [19] | 2012 | 21 and 6 patients | KV-FM (Calypso); KV-CBCT (Calypso) | 915 CBCT and 260 OBI | KV-OBI vs. Calypso 4D KV-CBCT vs. Calypso 4D | Comparison of three systems | Localizations with CBCT/KV imaging and the Calypso system indicating excellent agreement. |
| Salas C. Present study | 2014 | 40 patients | MV EPI-FM; MV CBCT | 418 each method | MV FM vs.MV CBFM vs. MV CBST | Correlation of three systems | The MV CBCT provides excellent agreement and reliability if we use FM. |
| Abbreviations: MVCT: Megavoltaje CT; KVCT:Kilovoltaje CT; KV-CBST:Kilovoltaje cone beam computed tomography with soft tissues; MV EPIFM:
Megavoltaje electronic portal image with fiducial markers; US: Ultrasound; MV-CBST:Megavoltaje cone beam CT soft tissues; MV-PIFM:Mega voltaje
portal image with fiducial markers; KV images:Kilovoltaje images; OBI: On board images; KV-PIFM:Kilovoltaje portal image with fiducial markers; KVCBCT:
Kilovoltaje cone beam computed tomography; KV-FM:Kilovoltajefiducial markers; MV CBFM:Megavoltaje cone beam CT with fiducial markers Table 4: Comparison studies agreement between IGRT methods with fiducials |
|||||||


