 |
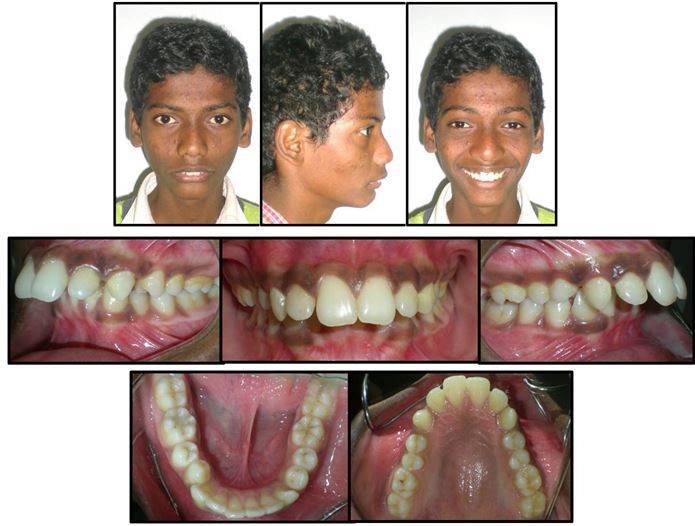
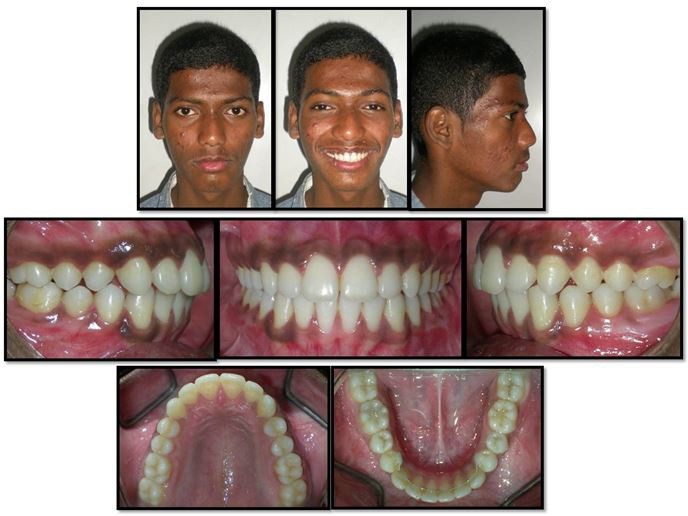
| Figure 1: Pretreatment Facial and Intraoral Photographs |
|
| Figure 1: Pretreatment Facial and Intraoral Photographs |
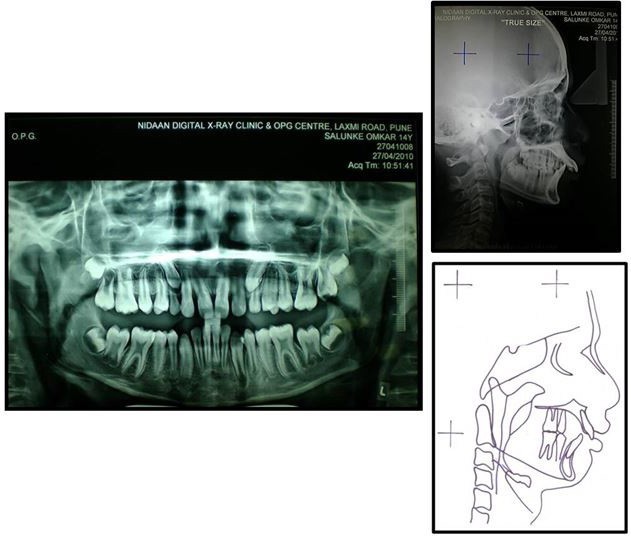 |
| Figure 2: Orthopantomogram, Lateral Cephalometric Radiograph and Tracing |
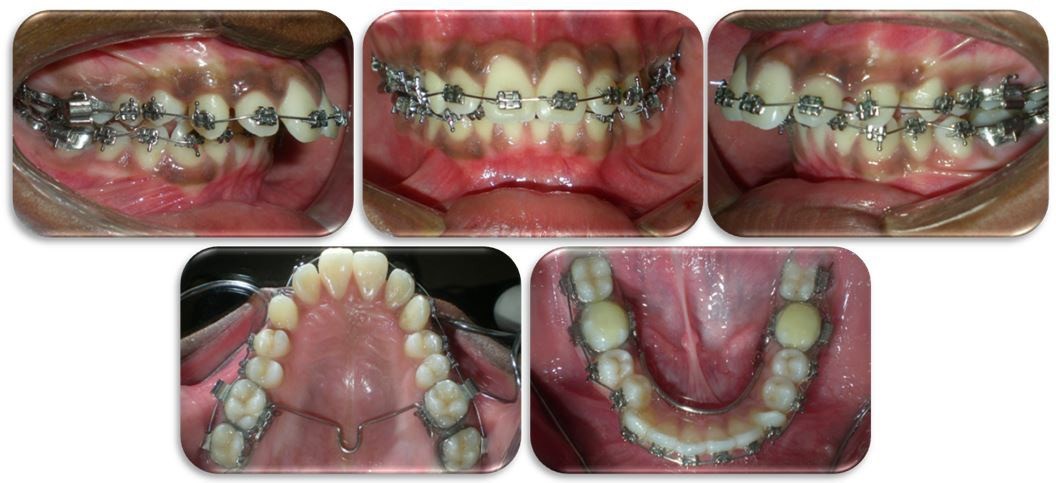 |
| Figure 3: Lateral Cephalogram Indicating Upper Airway Space |
 |
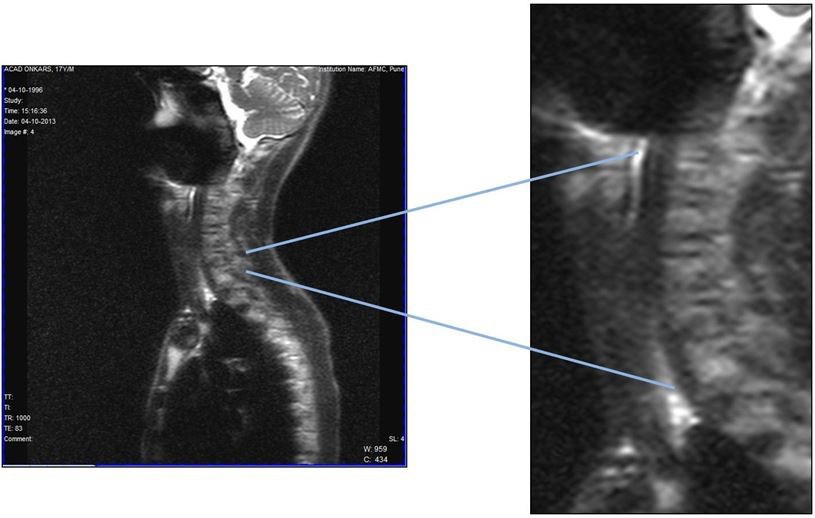
| Figure 4: MRI Showing Compromise Airway |
 |
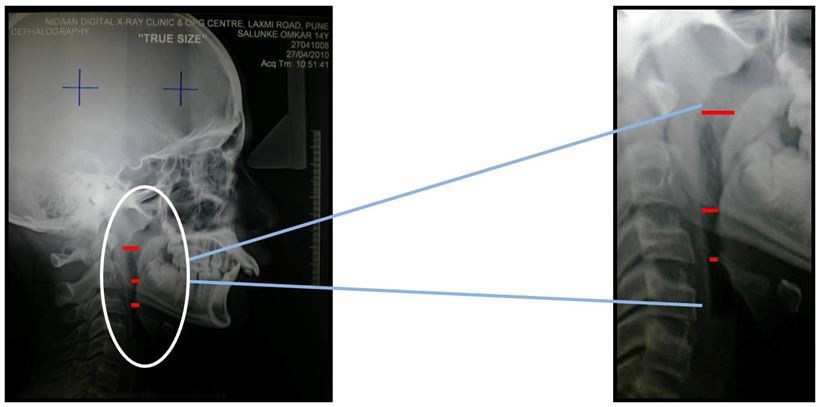
| Figure 5: Initial bonging of Upper and Lower Arch |
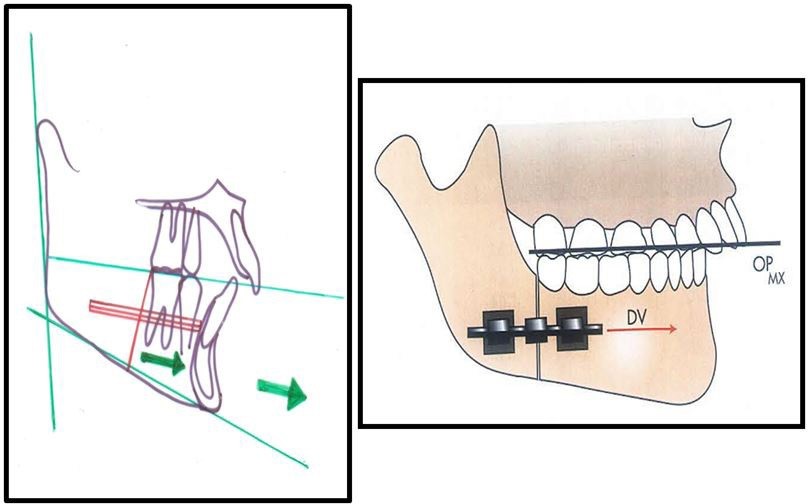 |
| Figure 6: Vector Planning |
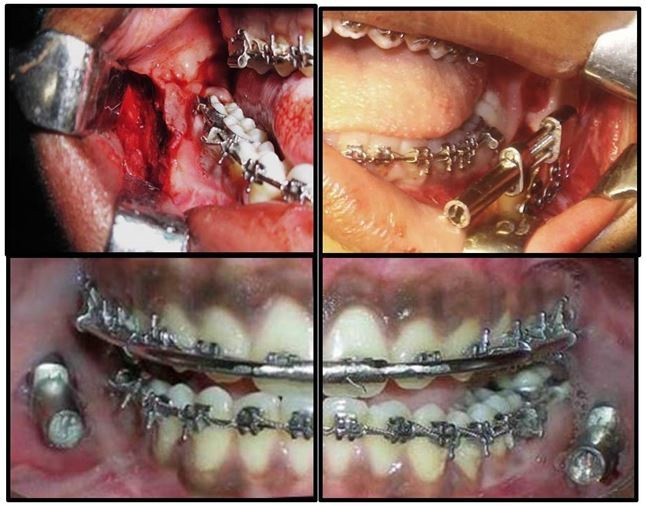 |
| Figure 7: Surgical phase showing Intraoral Distractor in situ |
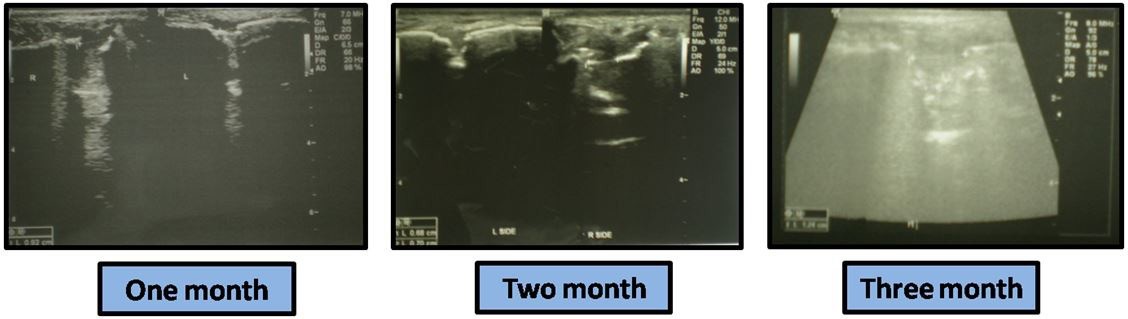 |
| Figure 8: USG Callus Maturation at Different Stages |
 |
| Figure 9: Posttreatment Facial and Intraoral Photographs |
 |
|
Apneas |
Hypopneas |
A + H |
Central |
Obstructive |
Mixed |
#Events |
34 |
53 |
87 |
1 |
86 |
0 |
Index |
5.5 |
8.6 |
14.2 |
0.2 |
14.0 |
0.0 |
Index with Arousal |
2.0 |
1.5 |
3.4 |
0.0 |
3.4 |
0.0 |
Mean duration(s) |
31 |
15.8 |
21.8 |
12.4 |
21.9 |
- |
Longest duration(s) |
87.4 |
49.4 |
87.4 |
12.4 |
87.4 |
- |
Parameters |
Pre-Rx |
Pre-Surg |
Post-Surg |
SNA |
84 O |
84 O |
92 O |
SNB |
93 O |
93 O |
91 O |
ANB |
-9 C |
-9 O |
0 O |
UI-NA |
37 O (10) |
39 O (12) |
36 O (10) |
LI-NB |
19 O (5) |
26 O (6) |
87.4 |
GoGn-SN |
28 O |
28 O |
22 O |
SMA |
22 O |
23 O |
22 O |
IMPA |
98 O |
102 O |
102 O |
LAFH |
69mm |
69mm |
71mm |
Co-A |
84mm |
84mm |
90mm |
Co-Gn |
117mm (107-110) |
117mm |
111mm |
ANS-PNS:GoPoG |
1:1.1.8 |
1:1.1.8 |
1:1.6 |
|
Apneas |
Hypopneas |
A + H |
Central |
Obstructive |
Mixed |
#Events |
26 |
23 |
26 |
1 |
34 |
0 |
Index |
0.5 |
8.6 |
4.5 |
0.2 |
6.0 |
0.0 |
Index with Arousal |
1.0 |
1.5 |
3.4 |
0.0 |
3.4 |
0.0 |
Mean duration(s) |
11 |
15.8 |
21.8 |
12.4 |
11.9 |
- |
Longest duration(s) |
23.4 |
18.4 |
17.4 |
12.4 |
14.4 |
- |